
How To Know When To Buy, Hold, Or Sell Any Liquid Stock Or ETF
A Worked Example.
DISCLAIMER: This note is intended for US recipients only and, in particular, is not directed at, nor intended to be relied upon by any UK recipients. Any information or analysis in this note is not an offer to sell or the solicitation of an offer to buy any securities. Nothing in this note is intended to be investment advice and nor should it be relied upon to make investment decisions. Cestrian Capital Research, Inc., its employees, agents or affiliates, including the author of this note, or related persons, may have a position in any stocks, security, or financial instrument referenced in this note. Any opinions, analyses, or probabilities expressed in this note are those of the author as of the note’s date of publication and are subject to change without notice. Companies referenced in this note or their employees or affiliates may be customers of Cestrian Capital Research, Inc. Cestrian Capital Research, Inc. values both its independence and transparency and does not believe that this presents a material potential conflict of interest or impacts the content of its research or publications.
Everything We Do In Charts, In One Real World Chart
by Alex King
Over in our Growth Investor Pro service, we cover Boeing ($BA) stock. The company, as you know, has had many problems in recent years and the stock has been exceptionally volatile as a result. Using solely technical analysis we managed to spot a selling window at a very opportune moment recently, before the big drop in the stock.
I wanted to take the opportunity to walk through the BA chart to show how we made this righteous call. I want to do this not to tout any kind of special genius - this was a workaday return using a workaday method. Rather, to illustrate that if you take time to learn this method of chart analysis - it takes a while to learn and to apply, but anyone moderately competent can do it, with practice - you can use the method time and again, in any liquid stock or ETF, in pursuit of improved investing and trading returns.
First, the chart, then, I shall walk you through the story of the chart. I flagged to Growth Investor Pro subscribers as a real-time alert that I was selling my $BA position to bank gains on 12 December - the stock closed at $250 that day. It peaked at $268 a week later. Today the stock closed at $205. So, that’s an 18% drawdown avoided, and potentially more to come, too.
You can open a full page version of this chart, here.
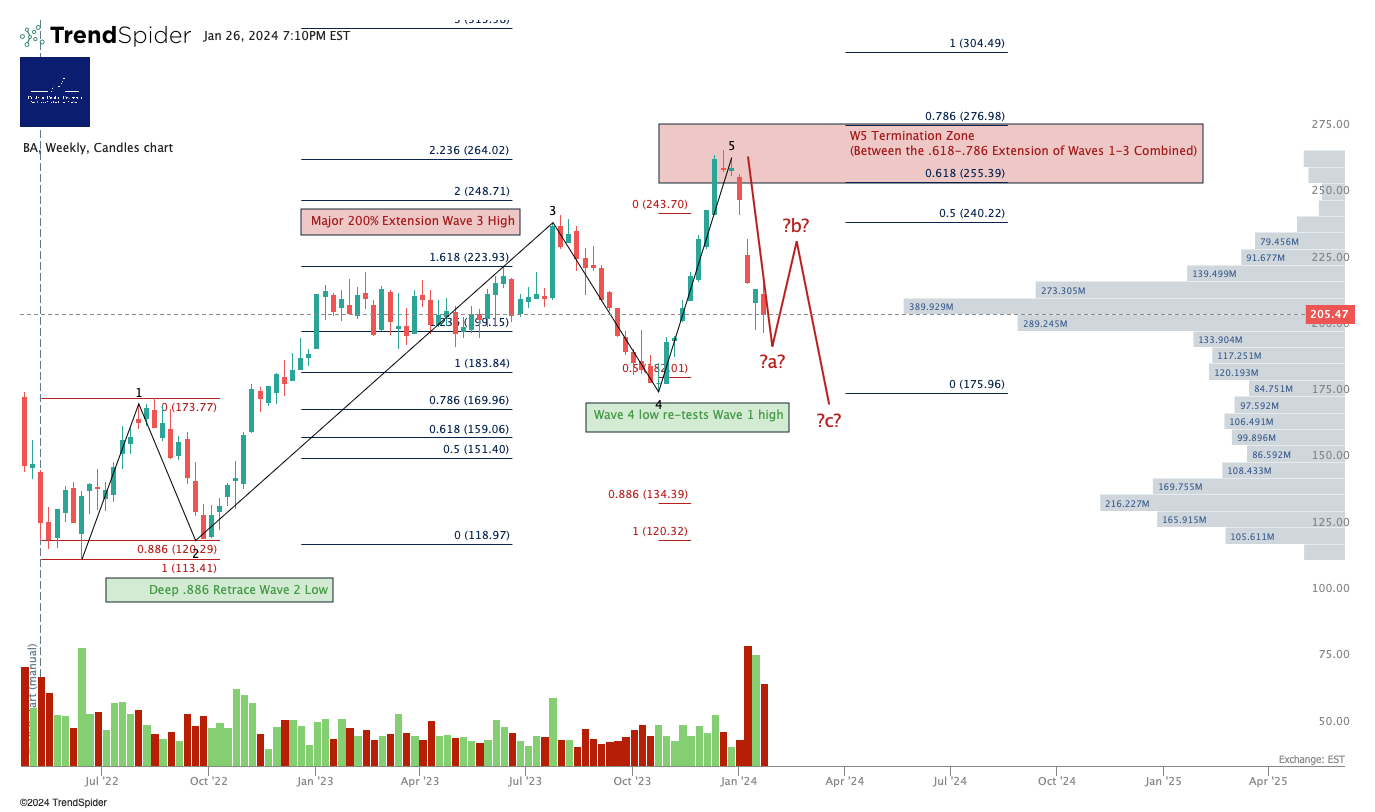
Here's the story of the chart. This happens to be a 5-wave bull cycle in Boeing, but you will see a similar pattern at work in all highly liquid stocks and ETFs. The reason for that is that the ebb-and-flow method used by large account players is constant. It is the ebb-and-flow, pullback and extension, that generates opportunities for large account players to benefit on the long side and on the short side, all the while leaving retail and other poorly-educated market participants scratching their heads as to ‘why’ the stock has moved this way or that on any given day.
- Trade point zero is June 2022. From this point, the stock put in a Wave 1 up from $113 to $174/share. Then a deep Wave 2 correction terminating precisely at the .886 retracement of that Wave 1. Then a Wave 3 up terminating close to the 200% extension of Wave 1 placed at the Wave 2 low. This is a common W3 high. Then a Wave 4 down, a 50% retrace of the W3, which re-tests the Wave 1 high. Then a W5 up terminating between the .618 and the .786 extension of Waves 1-3 combined, placed at the Wave 4 low. All these are normal parameters with the 5-wave Elliott Wave pattern.
- Now look at the volume x price indicator - the gray bars on the right hand side. High volume at the lows - that's institutional accumulation - high volume close to but not right at the highs - that's institutional distribution. Tiny volume right at the highs - that's retail FOMO buying.
- The stock hit the W5 termination zone and then dumped. The wave chart foretold reality, which often happens (because market participants capable of moving price usually know what reality is before it becomes news that normal people can find out about - this is part of their job).
- Now we may see the stock put in an a-b-c correction. The a leg down is in train. When it finishes we will likely see a countertrend move up - a b-leg - which will look like the stock is about to recover and head up to new highs, but which in all likelihood is just a fakeout to be followed by a c-leg down. Retail will buy the highs of the B-leg, enabling institutions who were too slow to sell BA at the top of the A-leg to now sell at the top of the B-leg. C-legs often end at A=C (where the price change in the C leg = the price change in the A leg) or sometimes at C=1.618A.
- The stock may be safe to go long if you see a complete a-b-c pattern AND you start to see high volume x price bars being put in at the lows, with the stock trending sideways in a range at those lows. That will likely be institutional accumulation.
Again, the above is a learnable, repeatable method to identify accumulation (buy), markup (hold), distribution (sell) and do-nothing zones in all highly liquid stocks and ETFs.
Any questions, reach out in Slack (paying members) or comments below.
Want to work side by side with us to learn more and get real-time trade alerts? Yet to join up? Become a paying member of this Inner Circle service, today.
Cestrian Capital Research, Inc - 27 Jan 2024.