
Will Nvidia Drag The Market Down? - NO PAYWALL

DISCLAIMER: This note is intended for US recipients only and, in particular, is not directed at, nor intended to be relied upon by any UK recipients. Any information or analysis in this note is not an offer to sell or the solicitation of an offer to buy any securities. Nothing in this note is intended to be investment advice and nor should it be relied upon to make investment decisions. Cestrian Capital Research, Inc., its employees, agents or affiliates, including the author of this note, or related persons, may have a position in any stocks, security, or financial instrument referenced in this note. Any opinions, analyses, or probabilities expressed in this note are those of the author as of the note's date of publication and are subject to change without notice. Companies referenced in this note or their employees or affiliates may be customers of Cestrian Capital Research, Inc. Cestrian Capital Research, Inc. values both its independence and transparency and does not believe that this presents a material potential conflict of interest or impacts the content of its research or publications.
“The Top Is In. RUN!!!!!”, Or, - Market On Open, Tuesday June 25.
by Alex King
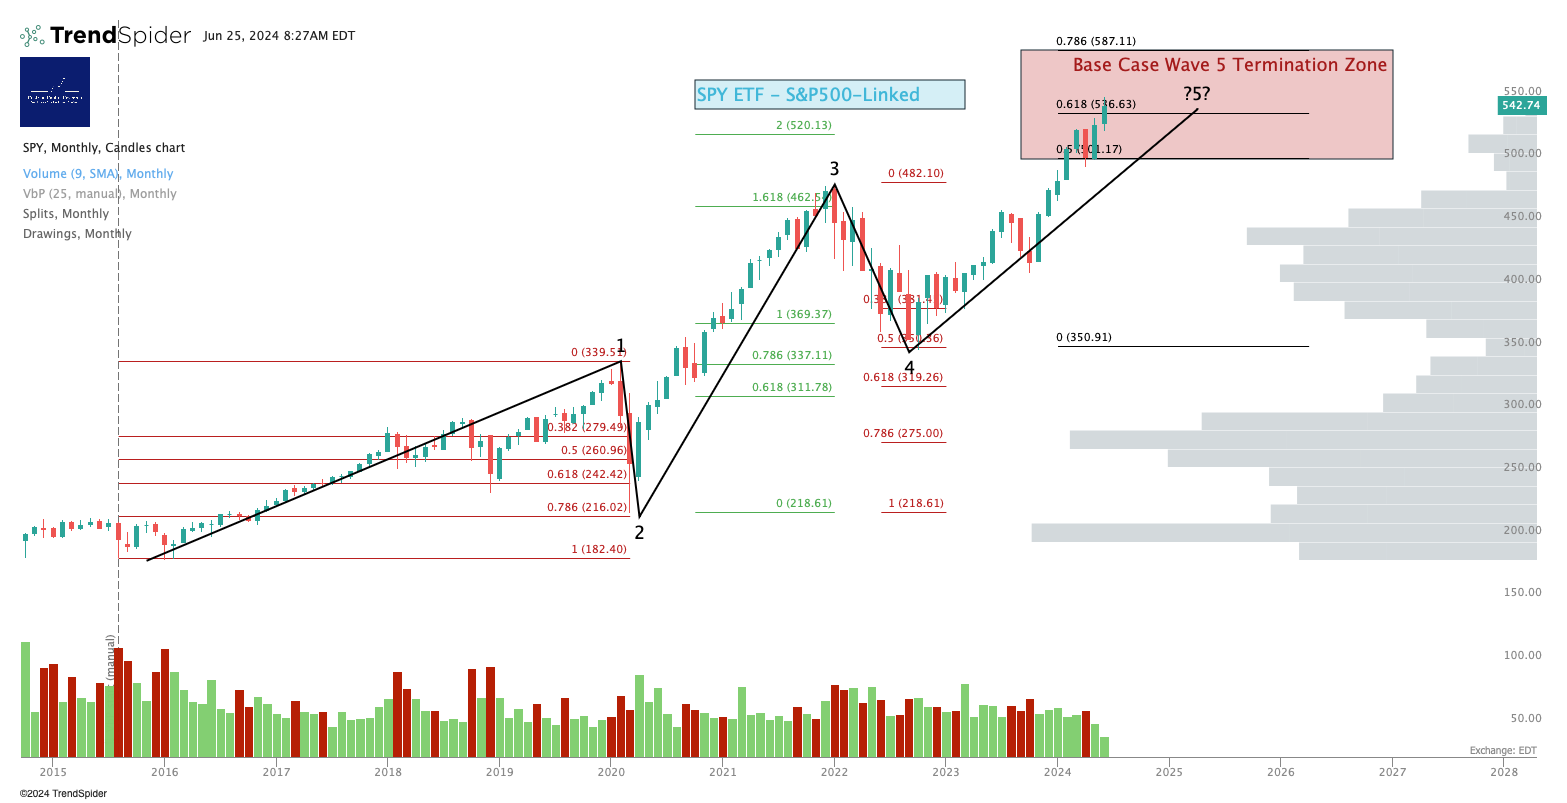
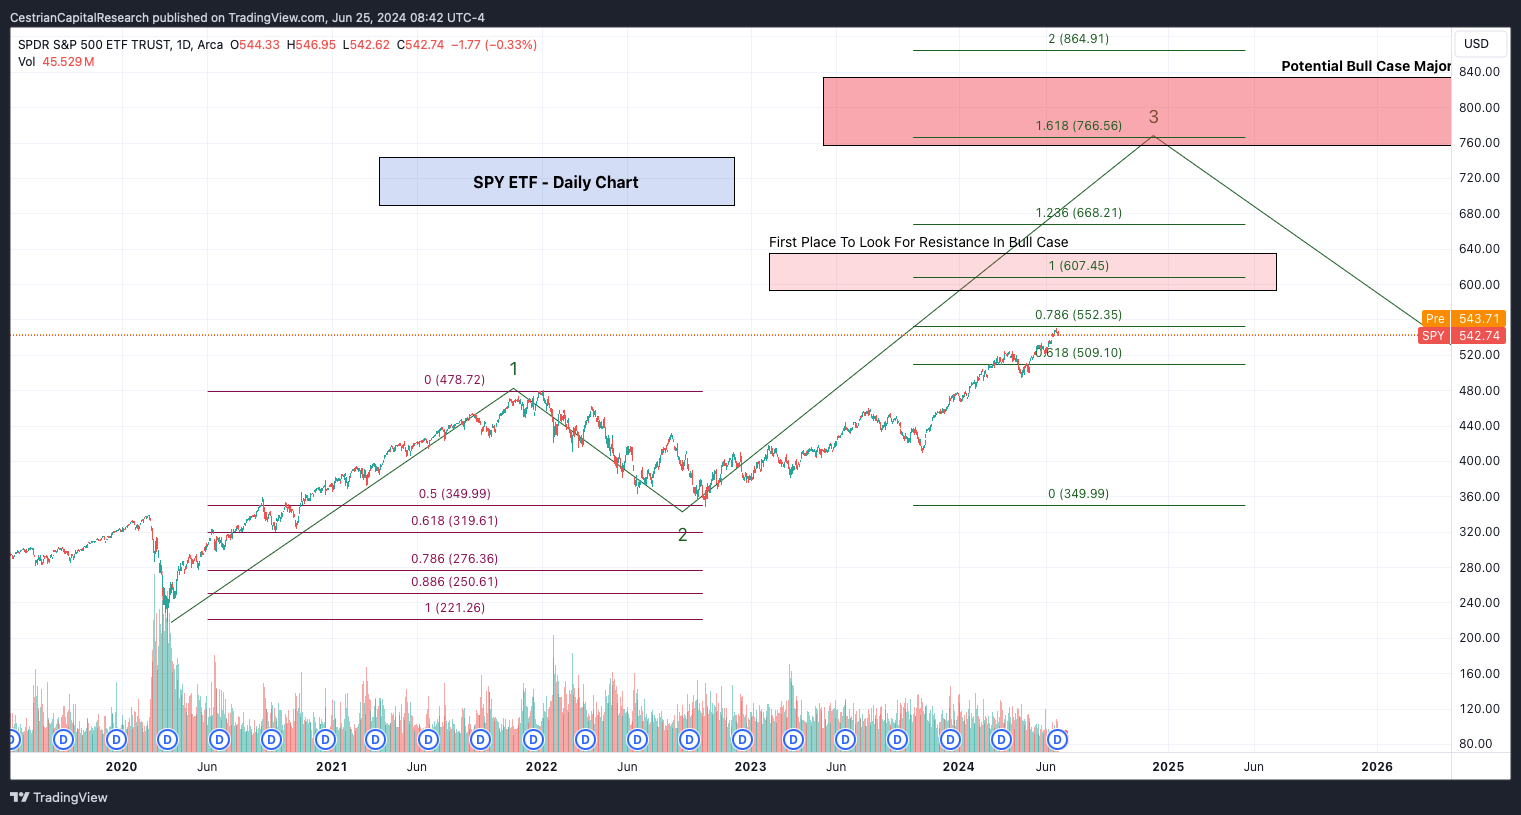
Well, it might be, you never know. If you look at our ‘Base Case’ charts for the S&P500 - subscribers have seen this so often they are bored of it - you might conclude that, yup, if you start the clock at the 2015/16 lows in the S&P500, then a standard 5-wave cycle up should have the S&P topping out around here somewhere. “But of course!” you may say. Bitcoin maxis everywhere, meme stock frenzy on social media, kid at the bus stop YOLO-ing OTM 0DTE Nvidia calls - it’s a veritable Dionysian feast which can only, of course, mean one thing. Decadence. Which is a synonym for decay. Which means - RUN FOR THE HILLS!!
Here’s that base case chart.
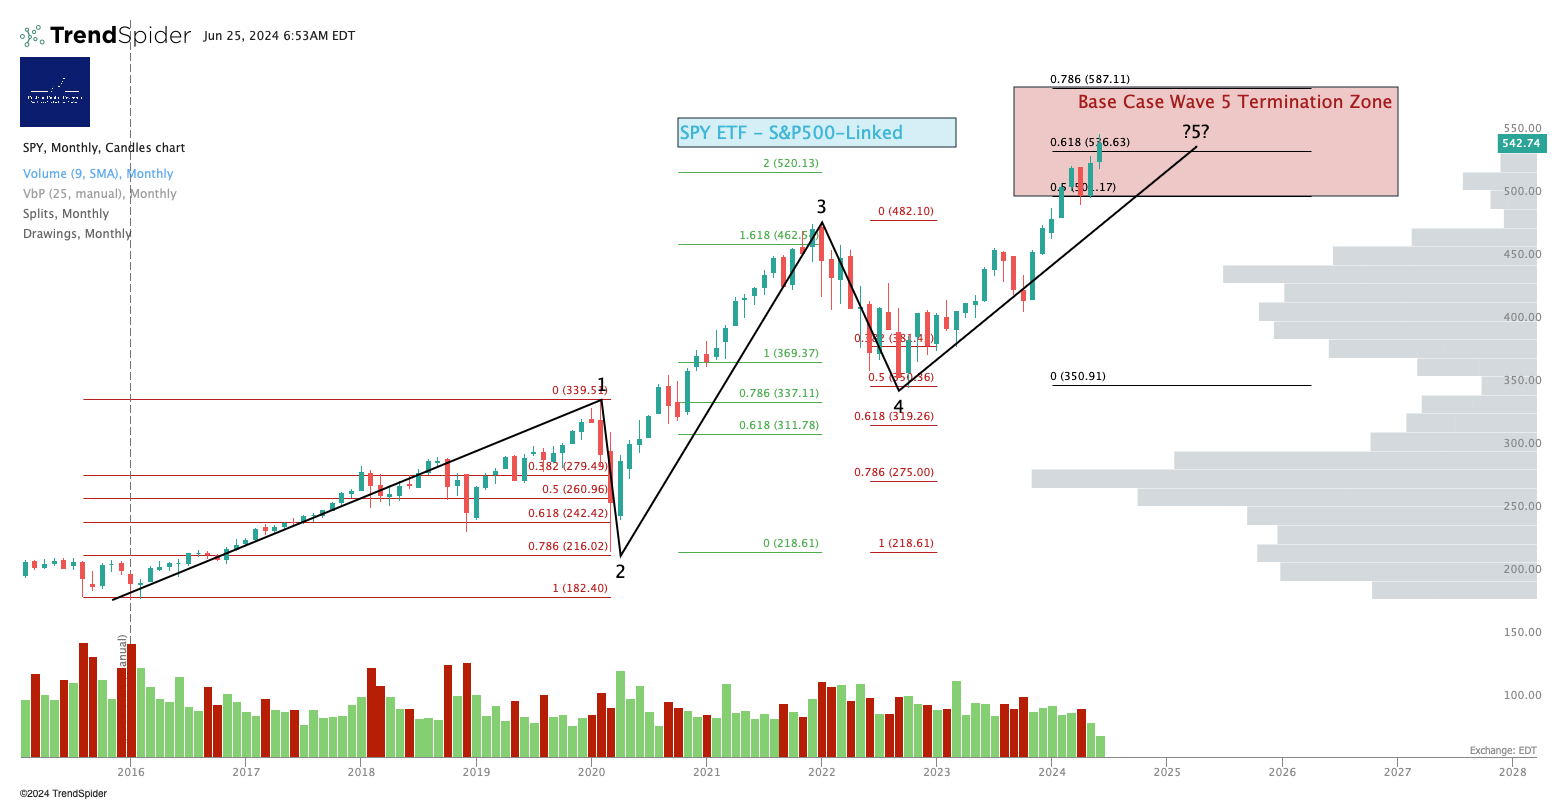
Now I am not saying this is wrong, yet. It’s a perfect technical pattern and it could be that the top is in, or close. If you want my opinion, which is just a feeling, it’s not a fact, unlike a stock chart - well, my opinion is that I don’t think this is the likely outcome. (See below for our more bullish case on the S&P500, which at this point I think is more likely). But this could be the top - certainly the kind of euphoria above is characteristic of market tops. As always, one should react to price not anticipate it.
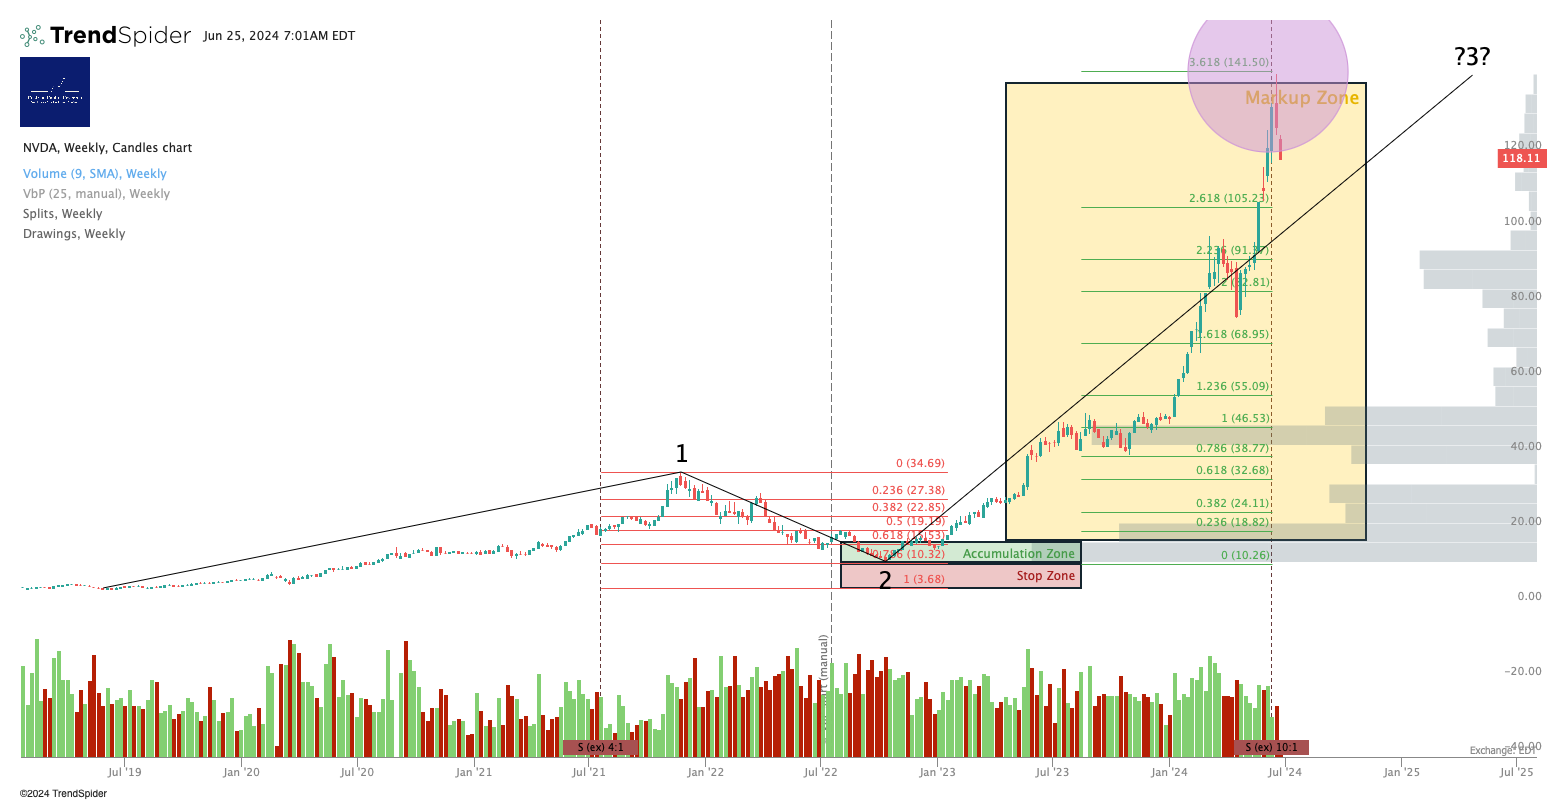
As I noted yesterday, it’s likely that semiconductor sees some weakness at least near term - the sector is a source of funds for rotation into Q3’s top sectors (we think energy may be one of the uses of funds - see this note). You can see a number of top semiconductor names bouncing off key resistance levels. Here’s $NVDA hitting a 3.618 extension:
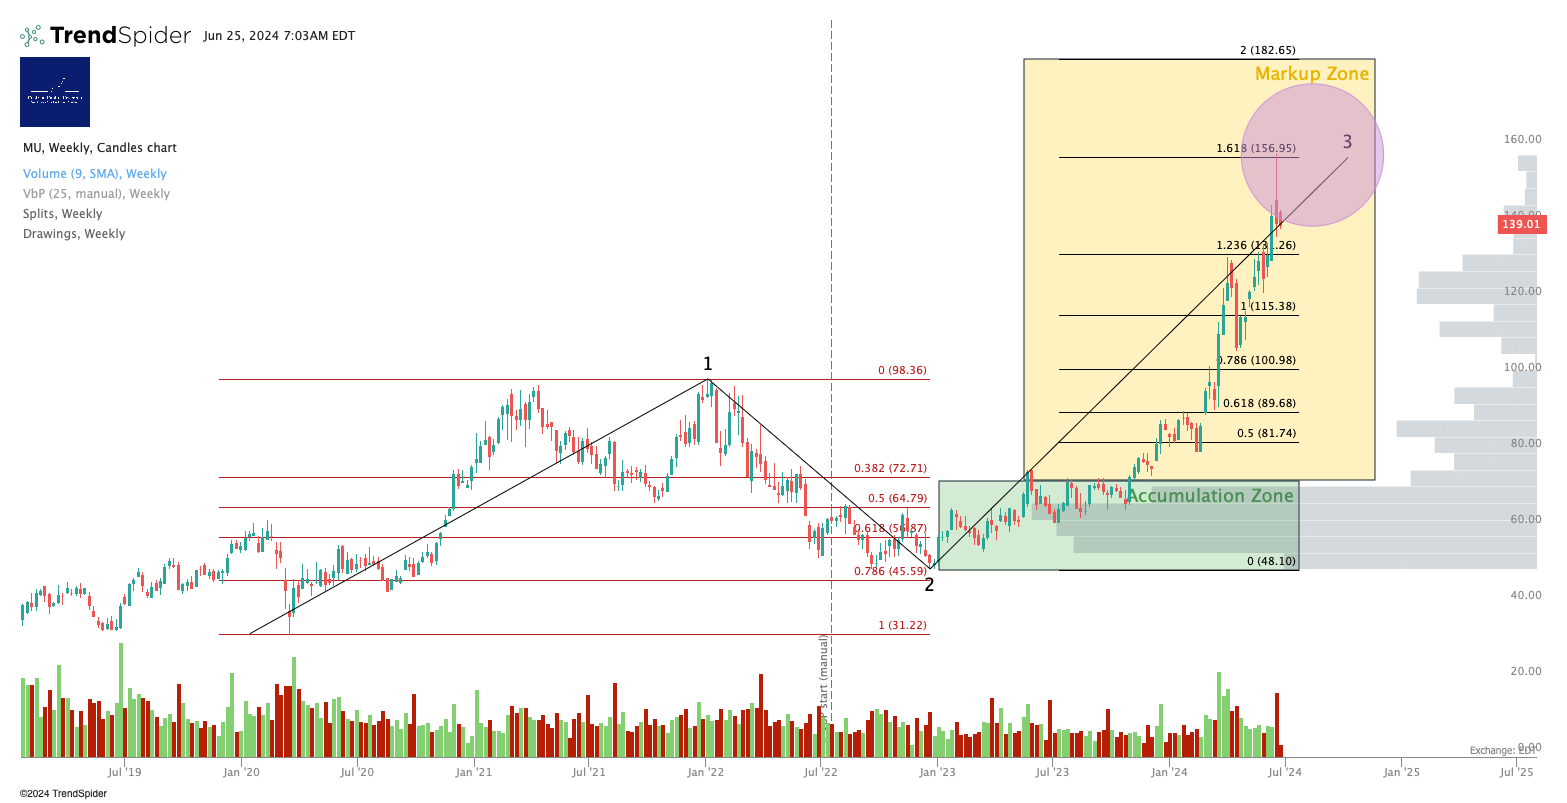
And here’s Micron ($MU) hitting a 1.618 extension. Weird-not-weird how these things all move in sync.
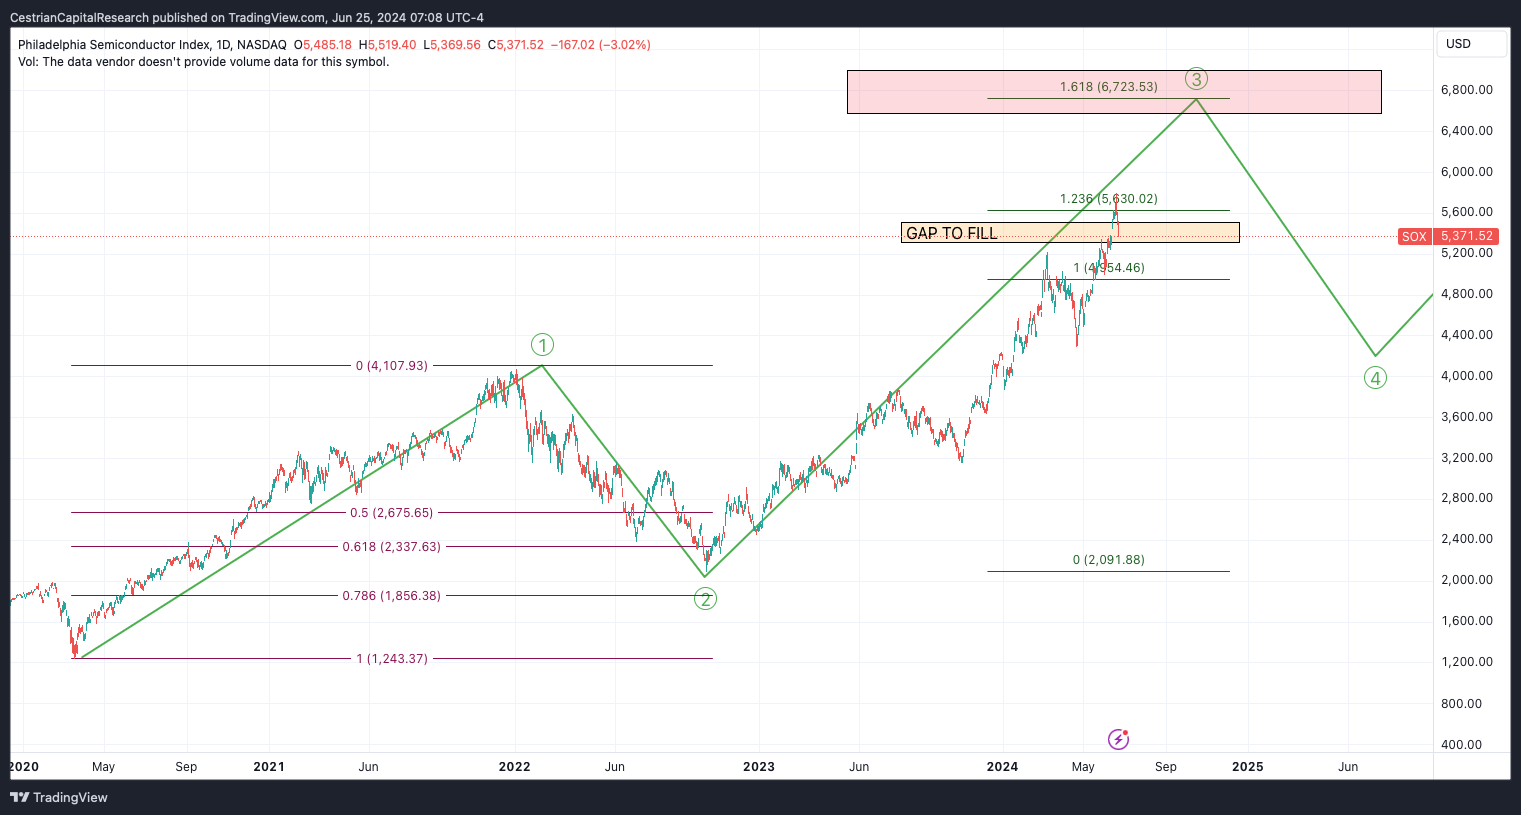
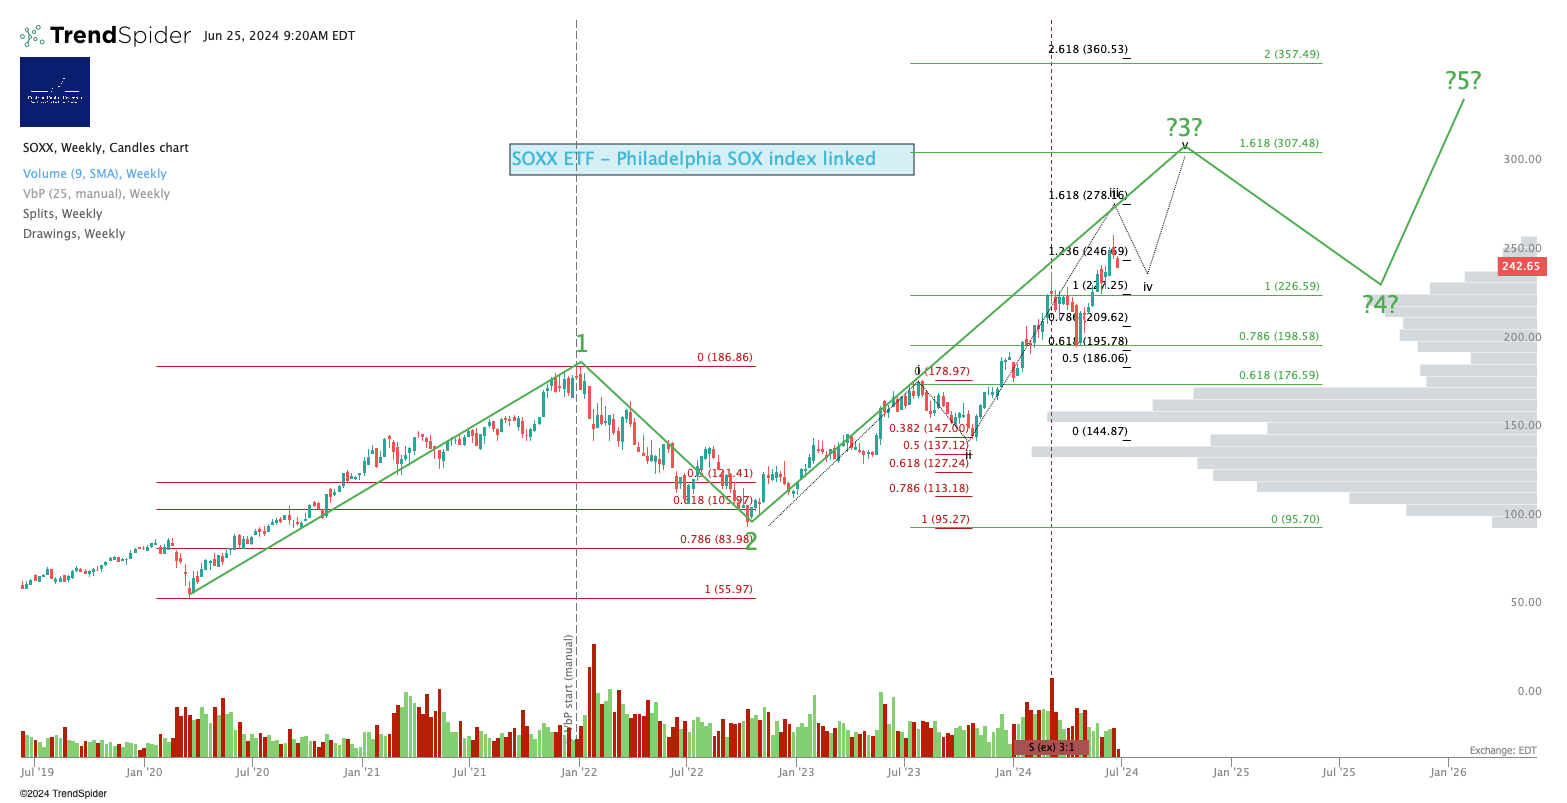
Personally I suspect semiconductor has some ups left in it yet, which will likely mean so too does the market. If you take a look at the Philadelphia SOX index, it’s in my view likely just filling a gap before a move up to its own 1.618 extension.
But again. Opinions don’t matter. Price matters. If price keeps falling, guess what, the market is falling and we have to now play it that way. That hasn’t happened yet, so for now we remain calm and balanced in our outlook - no tin hats for now.
Today, for all our readers, not just the paying ones, let’s get to work. If you’ve yet to join up as paying member and you’re wondering what all the fuss is about? Well, you can use these charts to trade short term and/or invest long term in the instruments covered. If you just want the notes, no interaction, sign up for our Market Insight tier. If you want the whole nine yards with a live, real-money analyst service, with trade alerts, model portfolios, open-mike webinars and all that kind of thing? It’s Inner Circle.
Read on!
Short- And Medium-Term Market Analysis
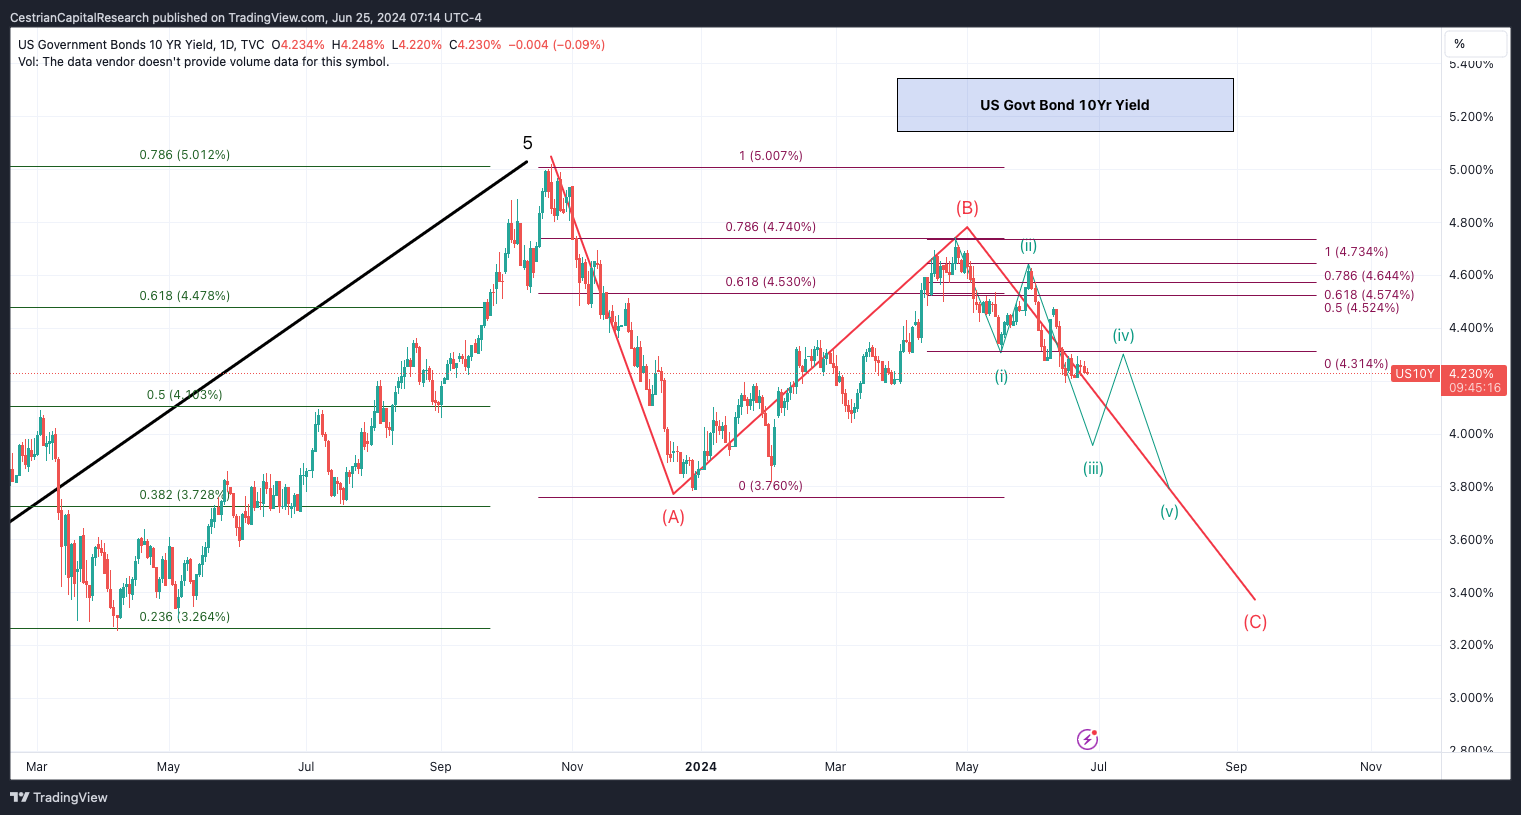
US 10-Year Yield
Equity Volatility
Volatility remains very much under control.
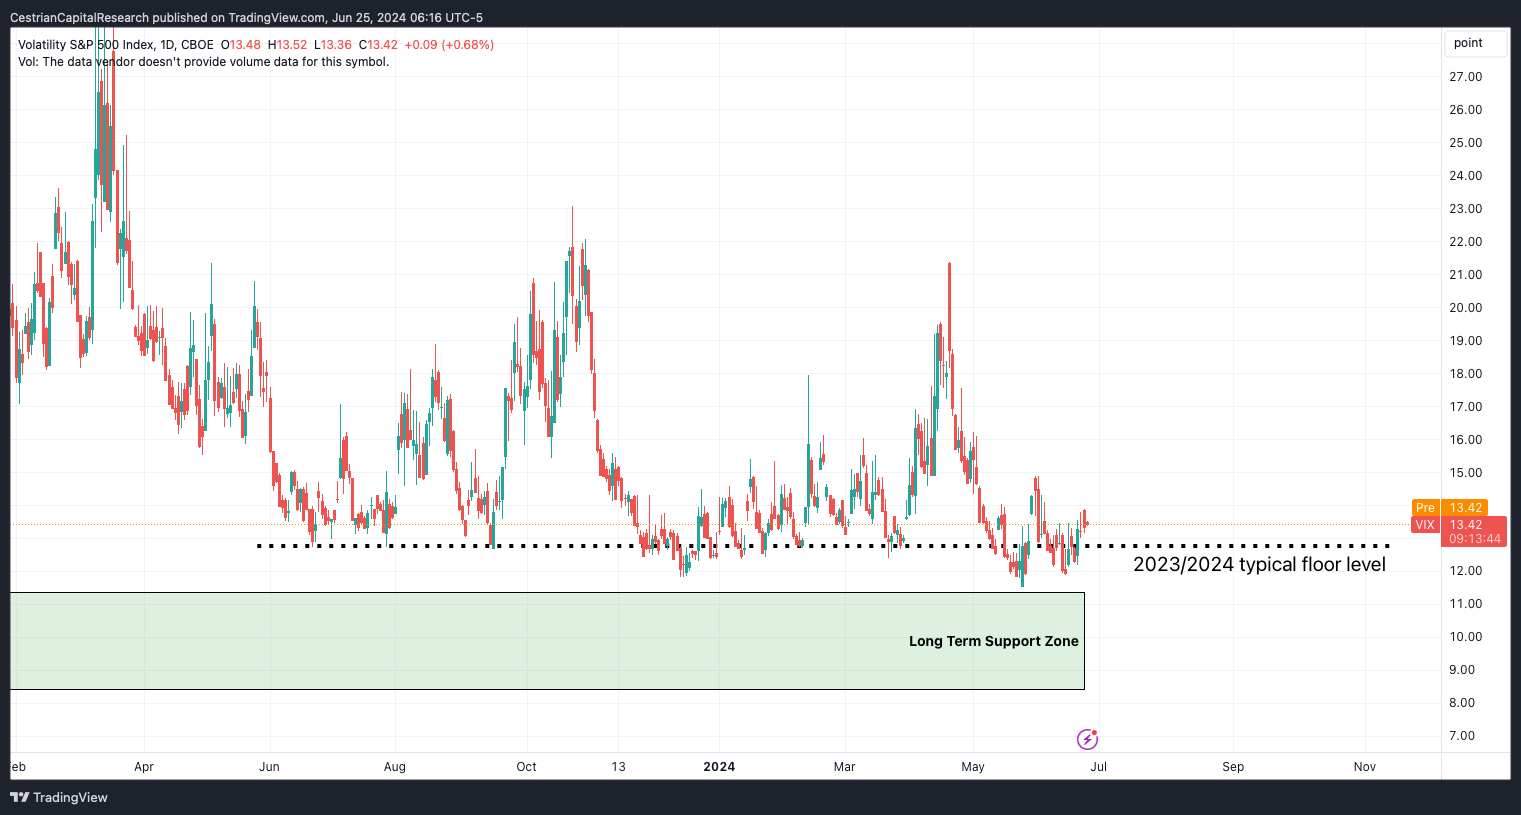
Disclosure: I hold no positions in Vix-linked securities.
Longer-Term Treasury Bonds (TLT / TMF)
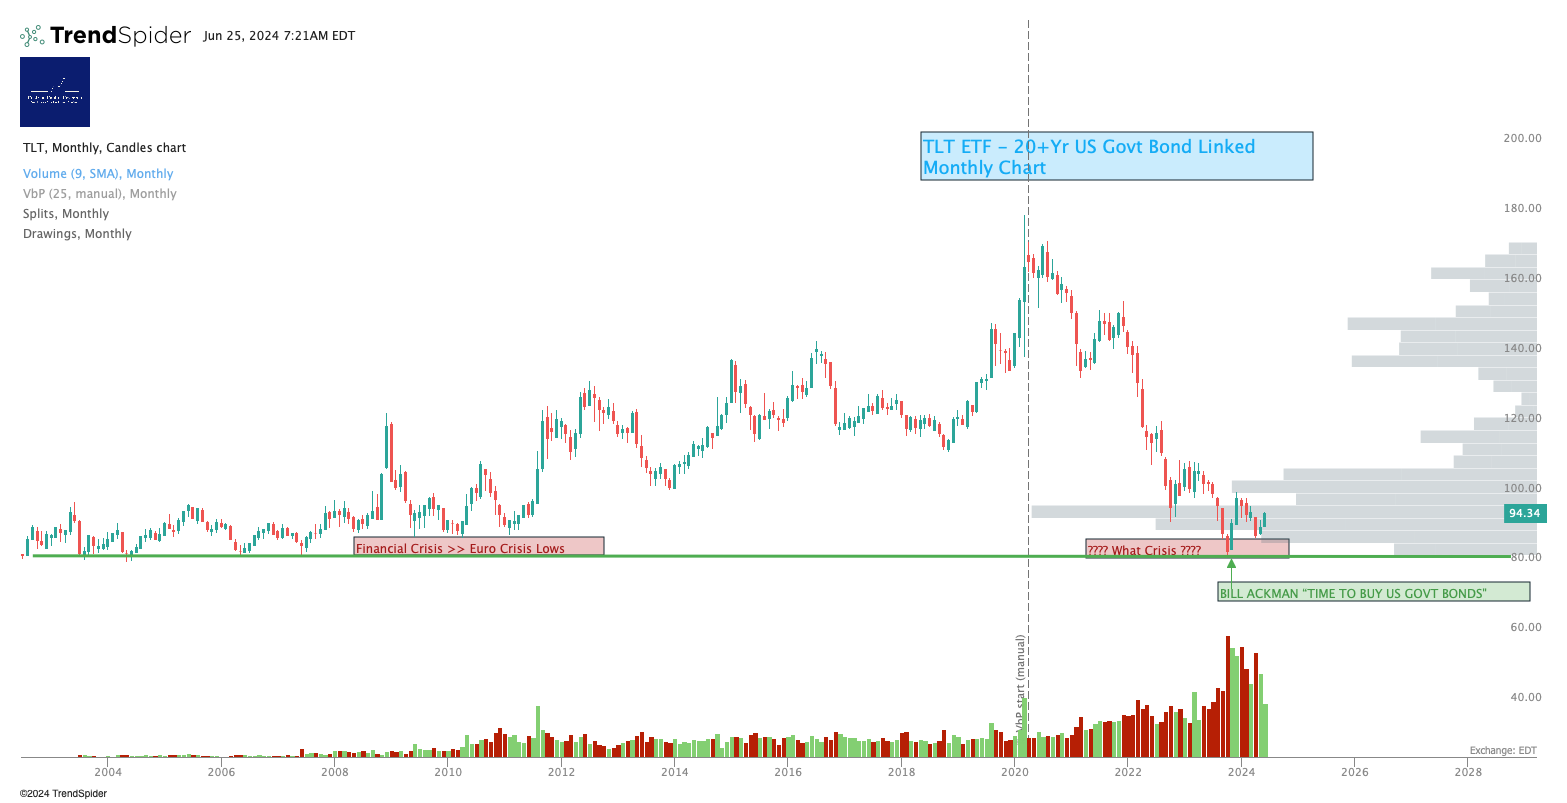
This continues to look very bullish over the coming months to my eye. May hit next resistance at $96-97; currently $94.

Next resistance level at $57 perhaps - that’s the 1.618 Wave (iii) extension of the prior Wave (i) on that chart below - currently $53.
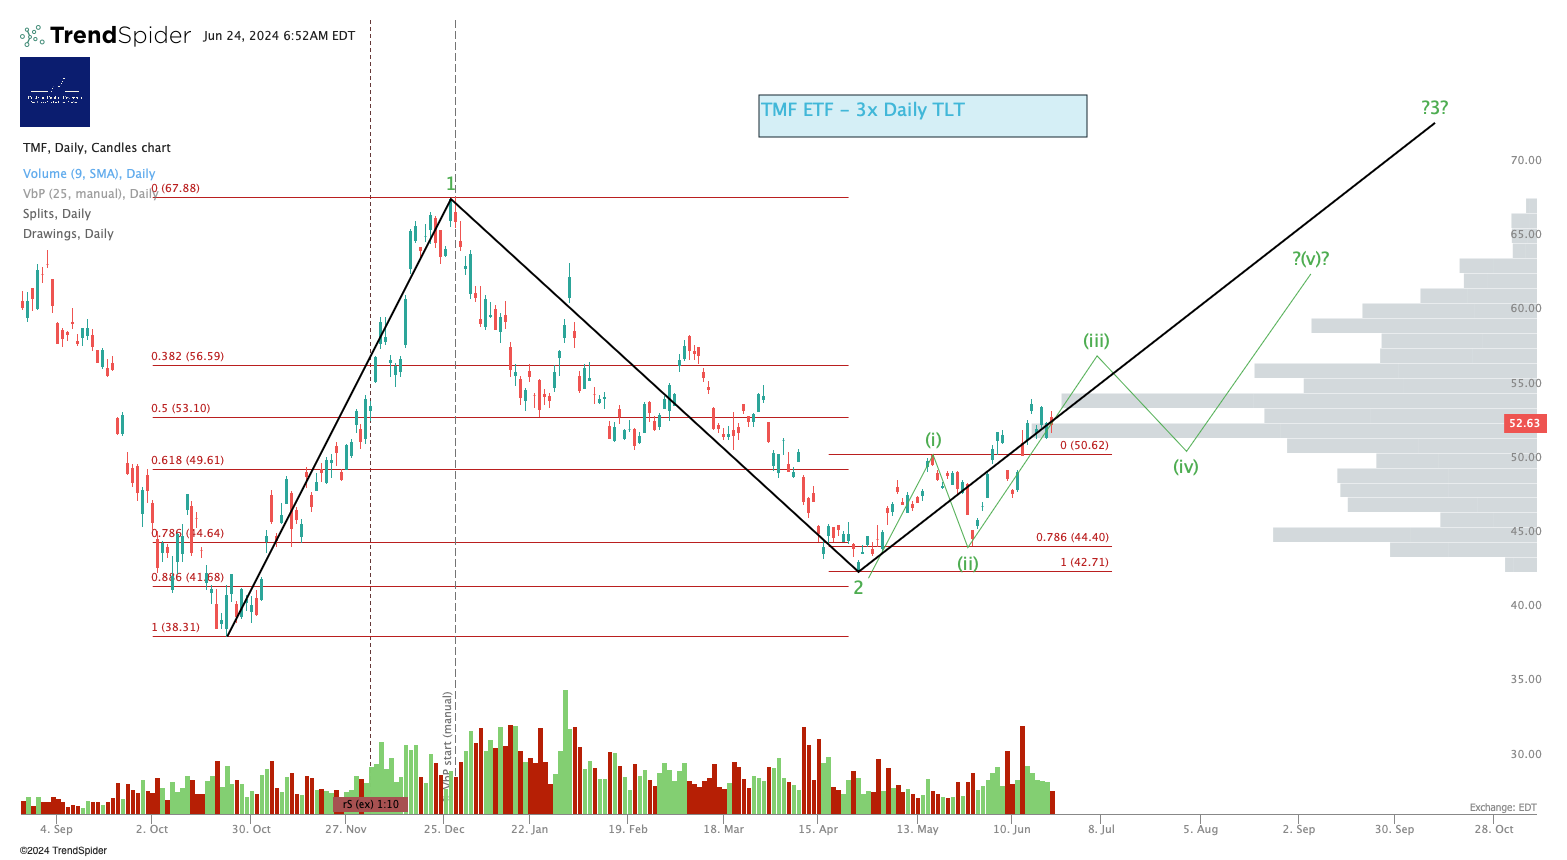
Disclosure: I am unhedged long TMF.
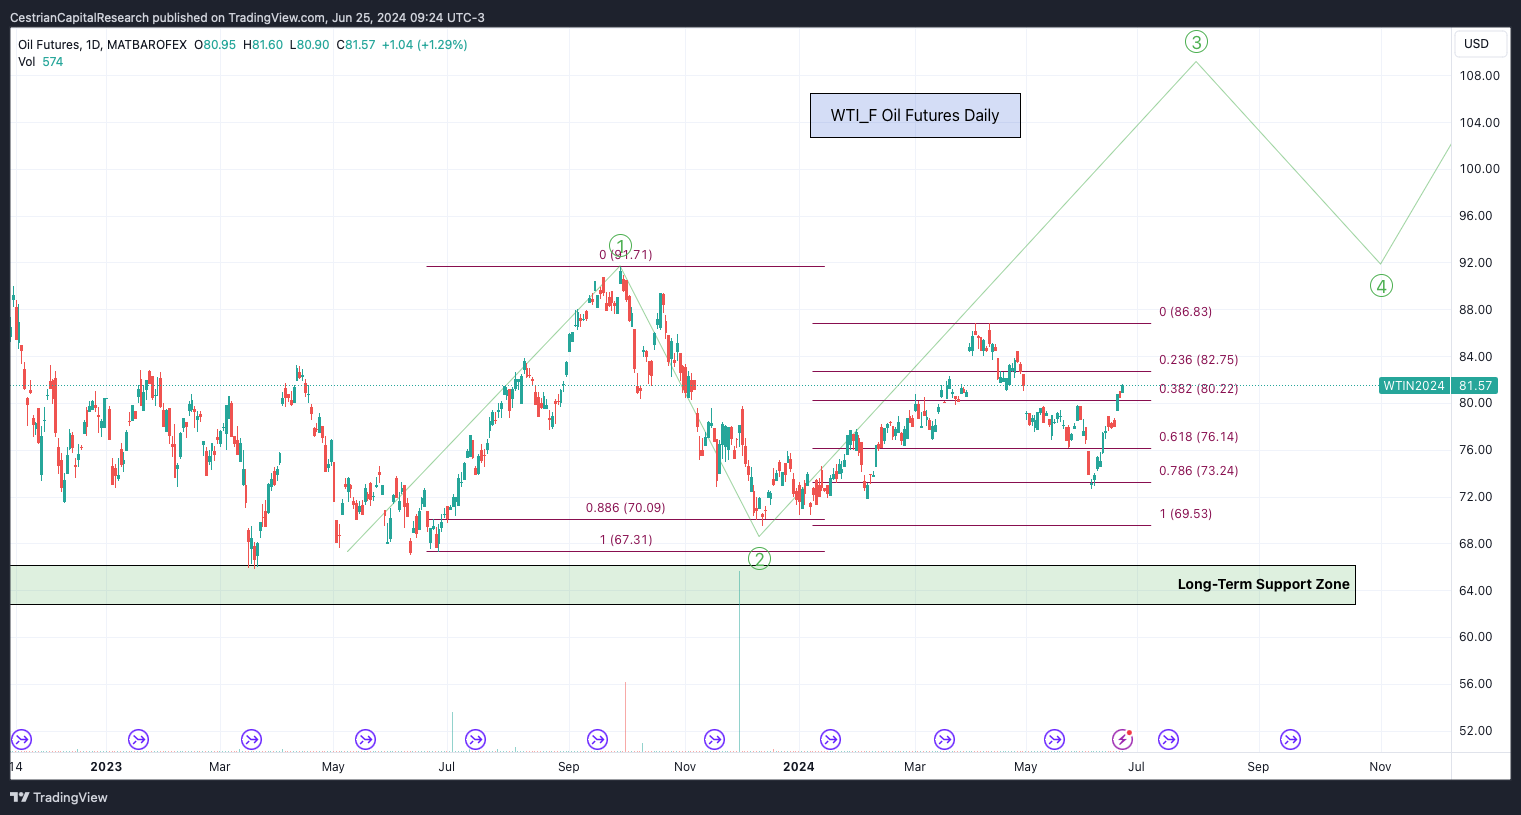
Oil (USO / WTI / UCO)
Be sure to check our new Energy Sector Model Portfolio - here.
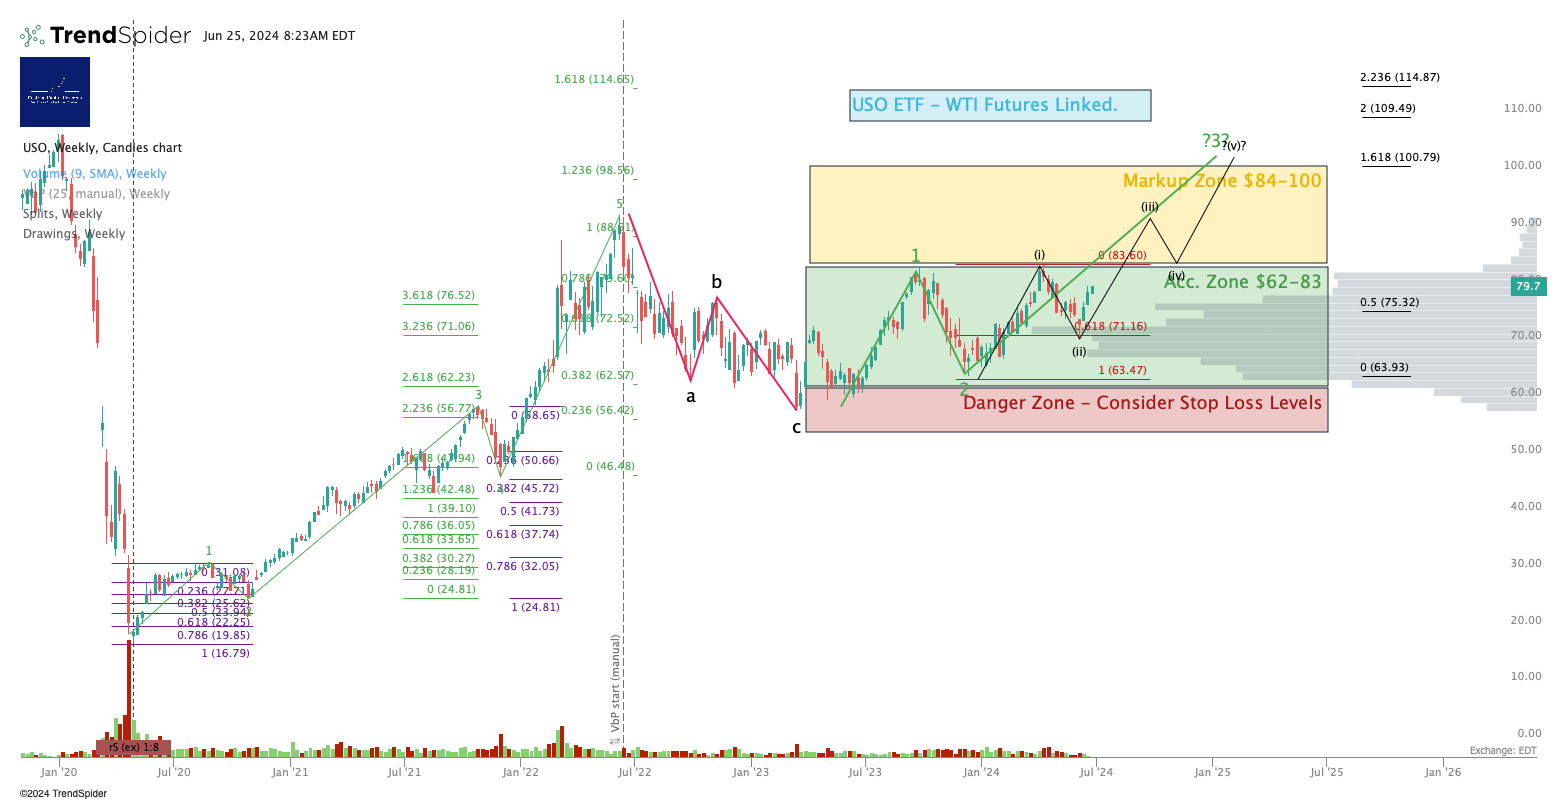
Looking for a break up and over $86 to confirm a Wave 3 in progress. If WTI fails to do so it can signal a drop in the oil complex generally. We include stop-loss levels in that Energy Portfolio as a result.
In the same vein, a break up and over $37-38 would confirm a Wave 3 in progress.
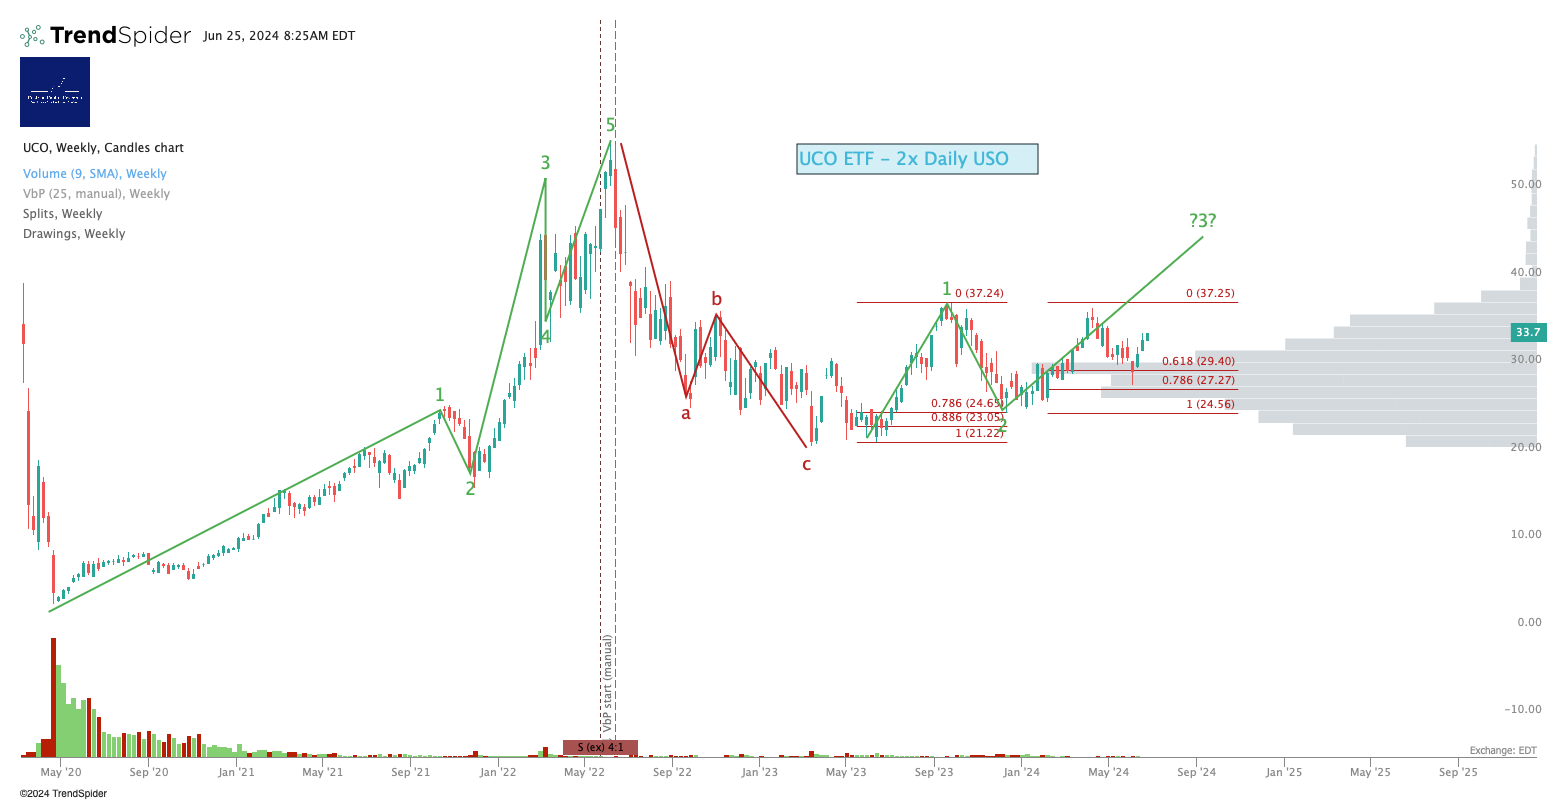
Disclosure: I am unhedged long UCO.
S&P500 / SPY / ES / UPRO
To repeat - if SPY clears $588 and holds it as support I think we can retire this base case scenario. But for now, we’re still smack bang in the middle of a potential termination zone, so it pays to be very vigilant in this price range. Currently $544.
This is a chart of ES S&P500 futures, adjusted to iron out contract change price distortions. You can look at this story 10 different ways but bottom line, if the S&P and its related securities drop below the highs struck on 12 and 13 June, and can’t break back up above them, then we have a Wave 4 selloff on our hands. Likely a correction, not doom. Hasn’t happened yet - just something to watch closely in my view.
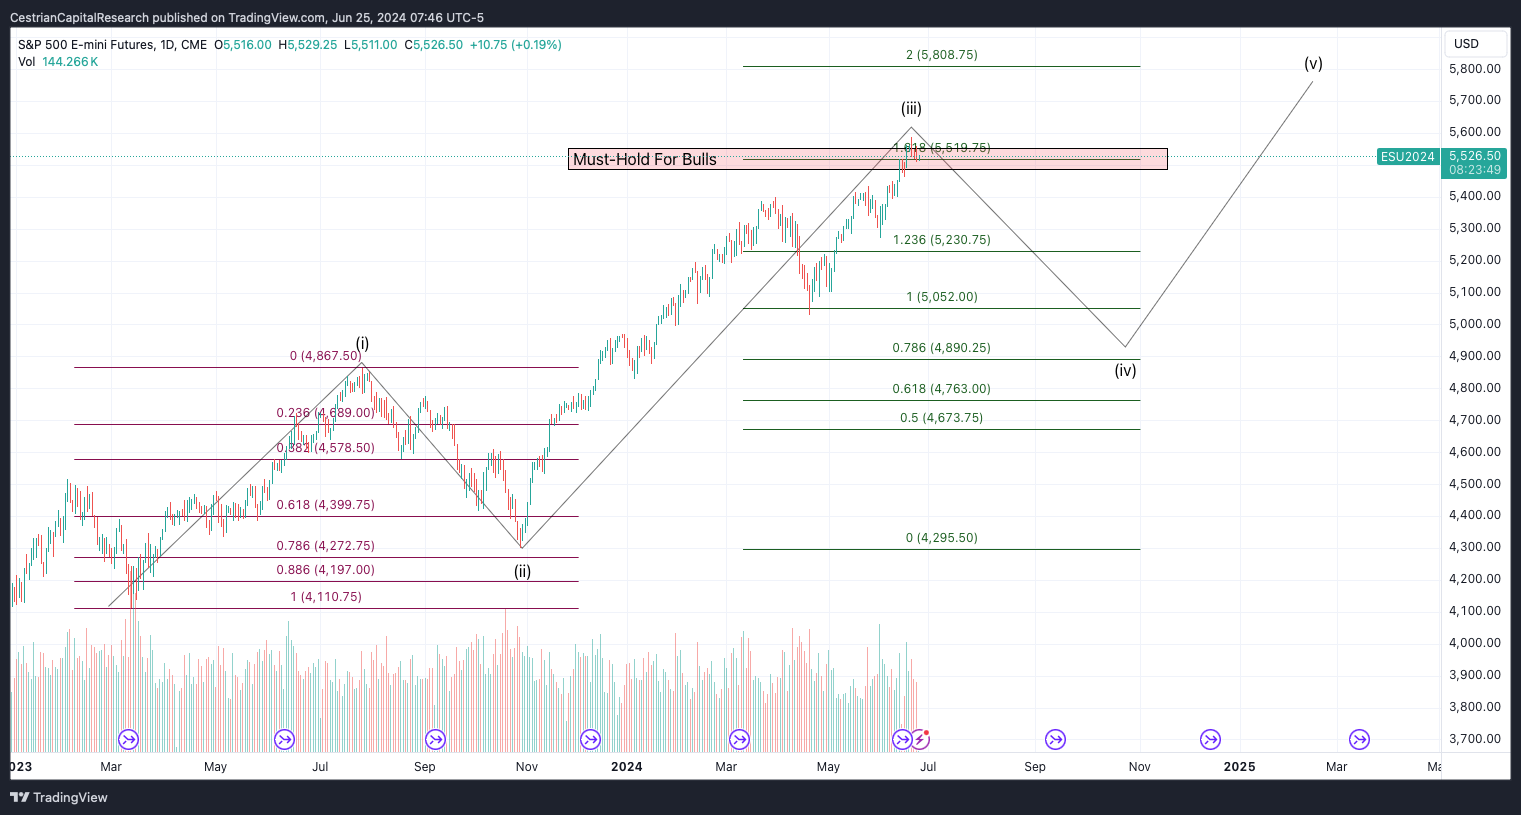
So far, this market has surprised to the upside. Let’s see if that continues.
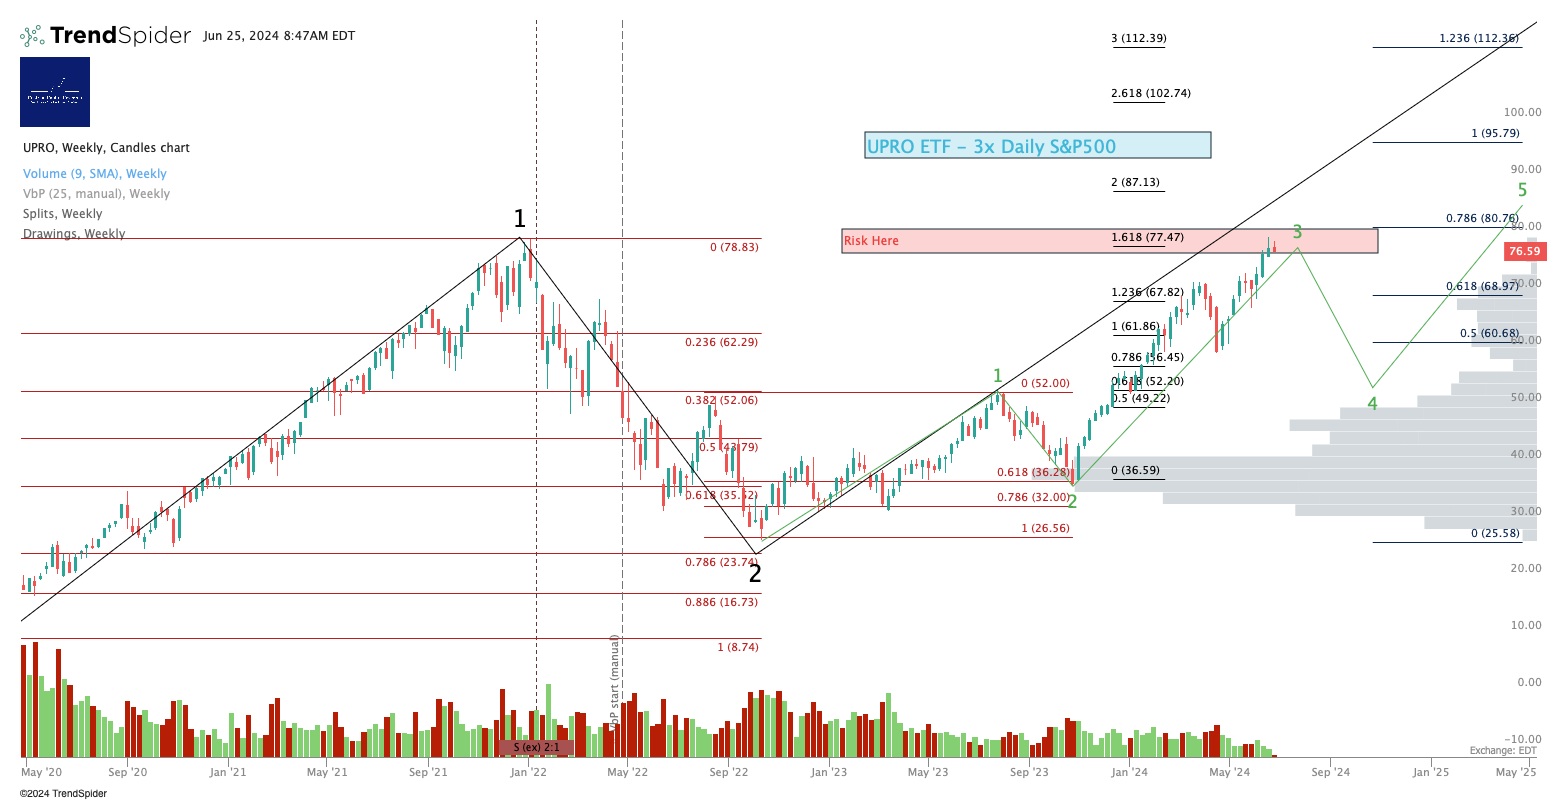
Disclosure: I am unhedged long UPRO and $3USL (an EU UCITS equivalent to UPRO).
Nasdaq-100 / QQQ / NQ / TQQQ
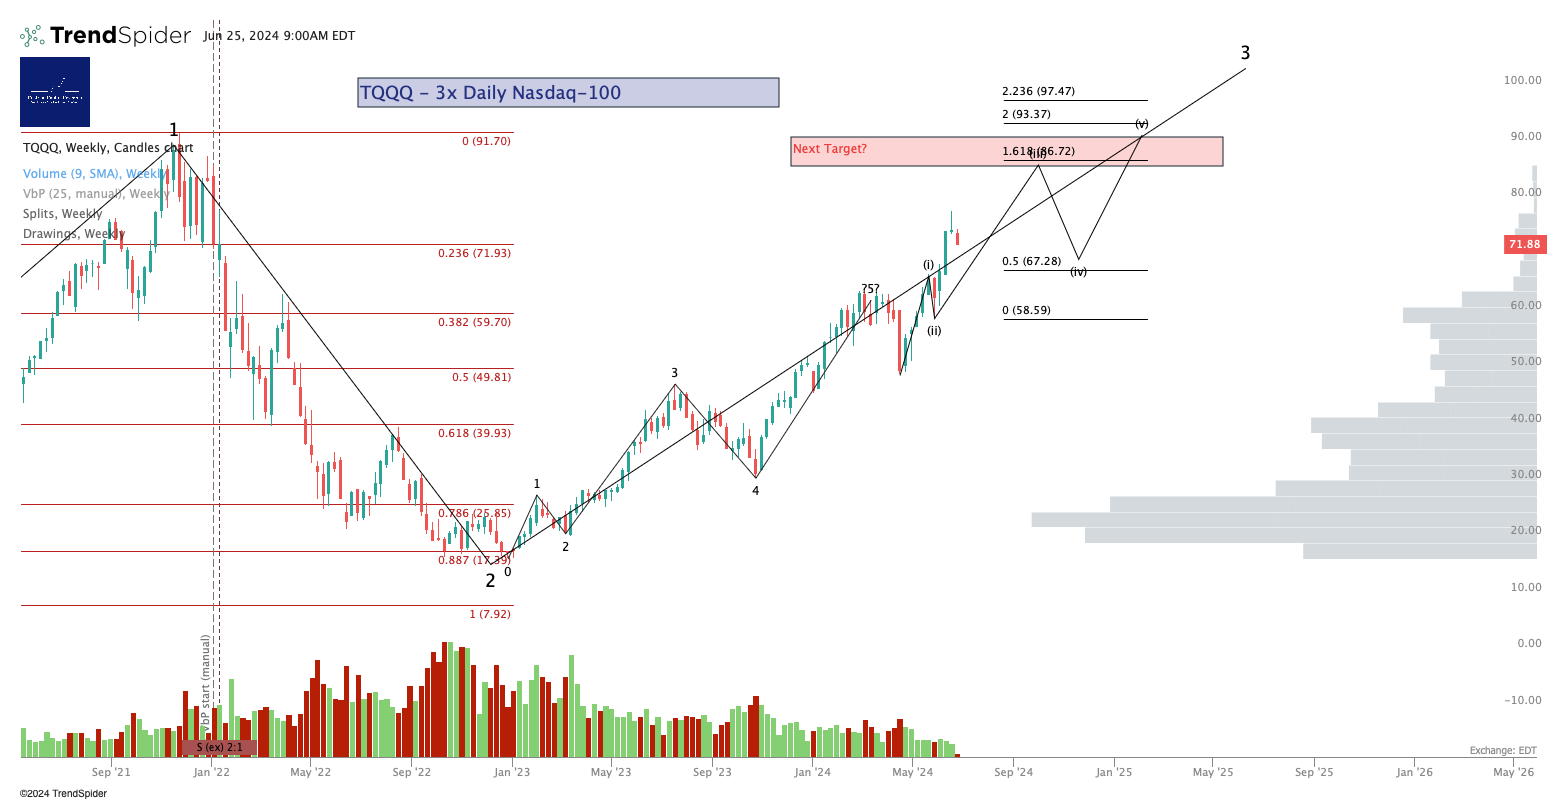
Base vs Bull Case - Larger degree:
Continues to look bullish on this timeframe.
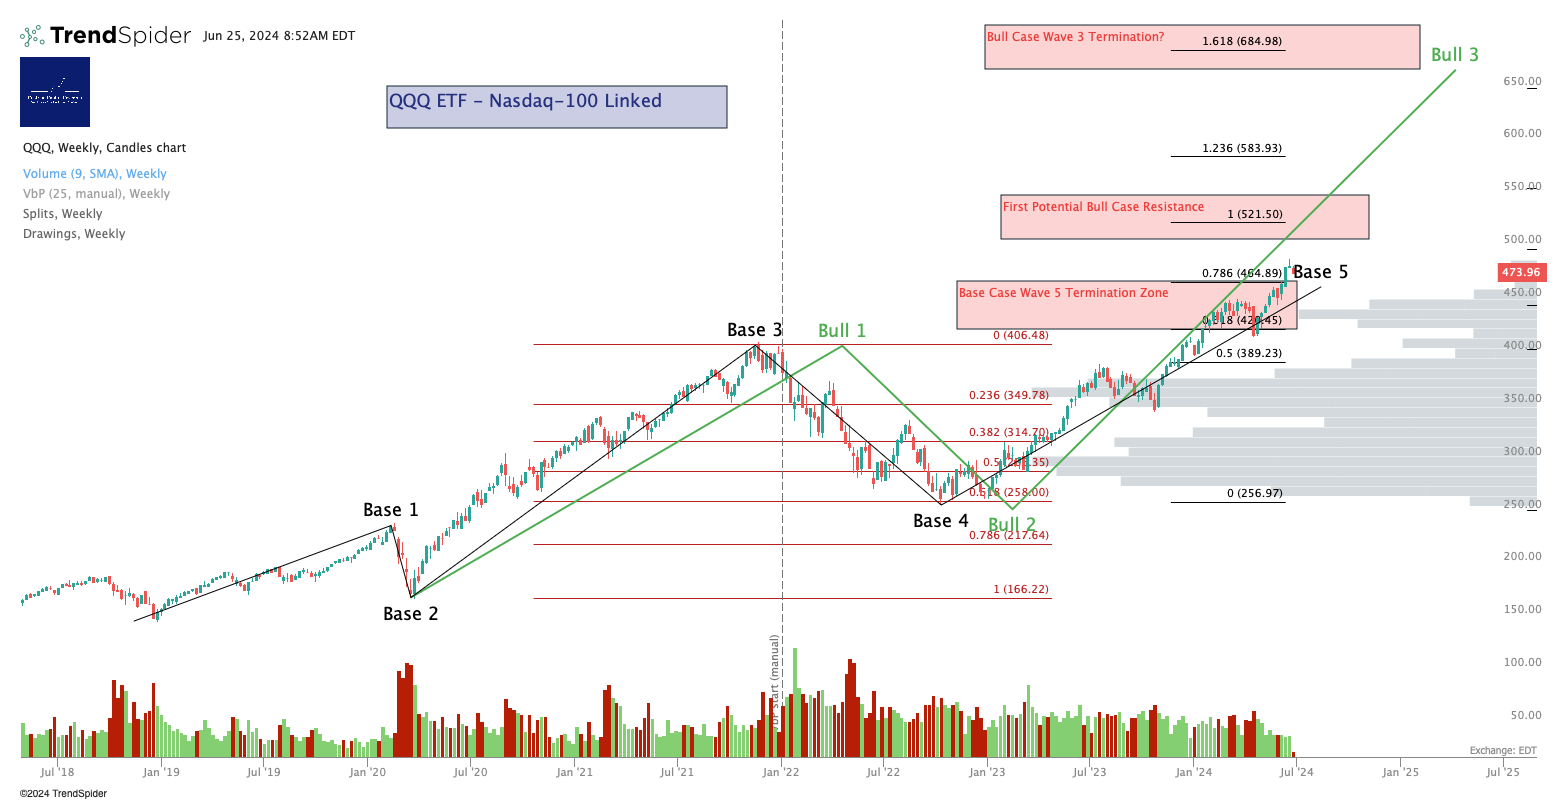
The problem with stocks, of course, is that they can go up, or down. Below is a schematic modest a-b-c correction which we may be in the middle of in the Nasdaq. If the current move up can’t break over the 20 June high and turn that into support, then it’s likely a b-wave, which means a c-wave (down) probably follows. A typical correction is marked by A=C ie. the share price change in the C leg is equal to that in the A-leg; a more aggressive drop would be C=1.618A.
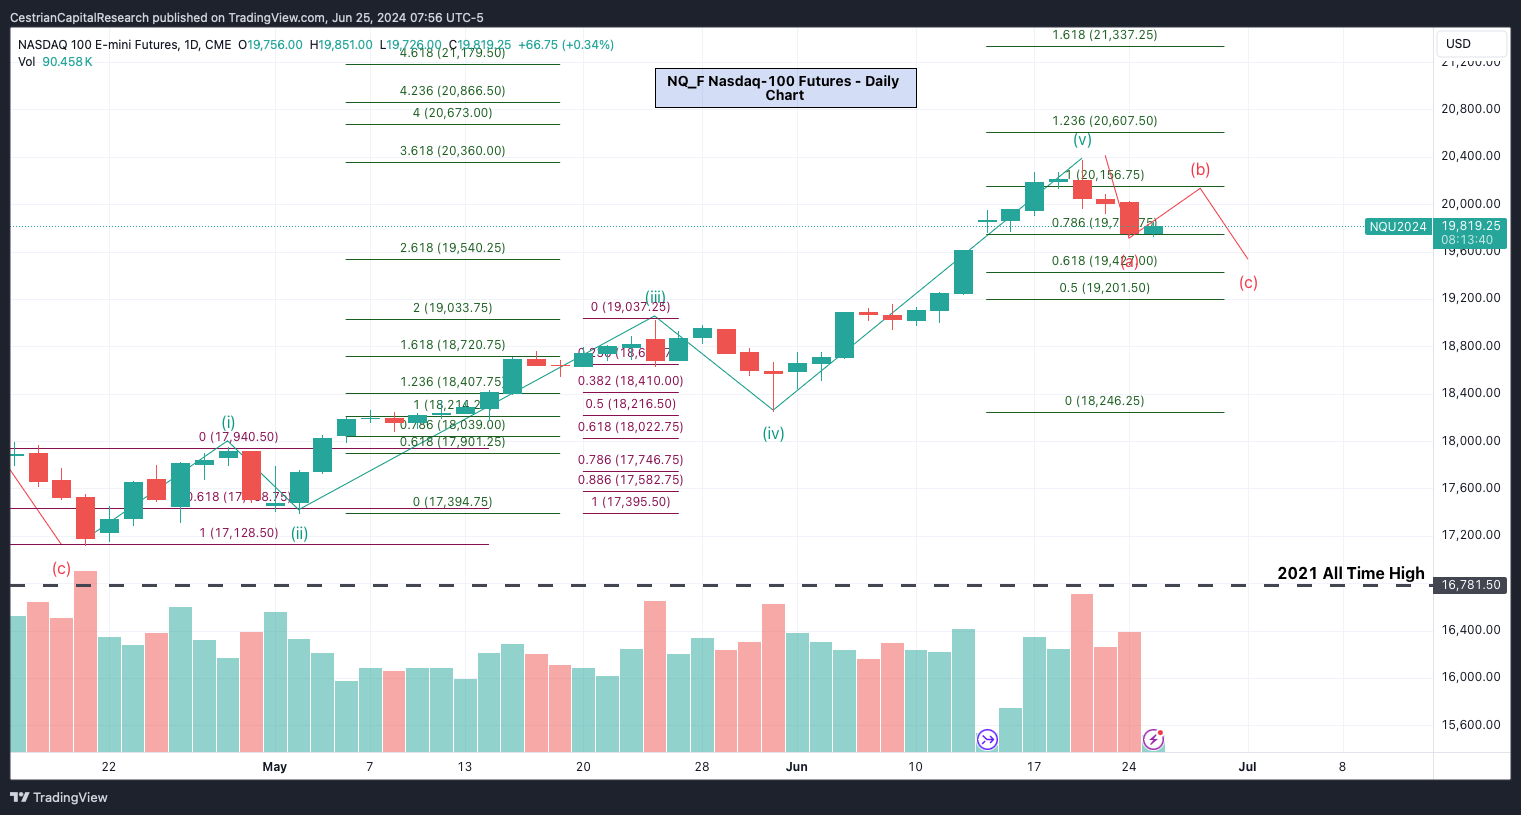
Regardless of any short-term correction - if it’s a correction not a dump!! - I think $TQQQ can hit $87.
Disclosure: I am unhedged long TQQQ and QQQ3 (an EU UCITS equivalent to TQQQ).
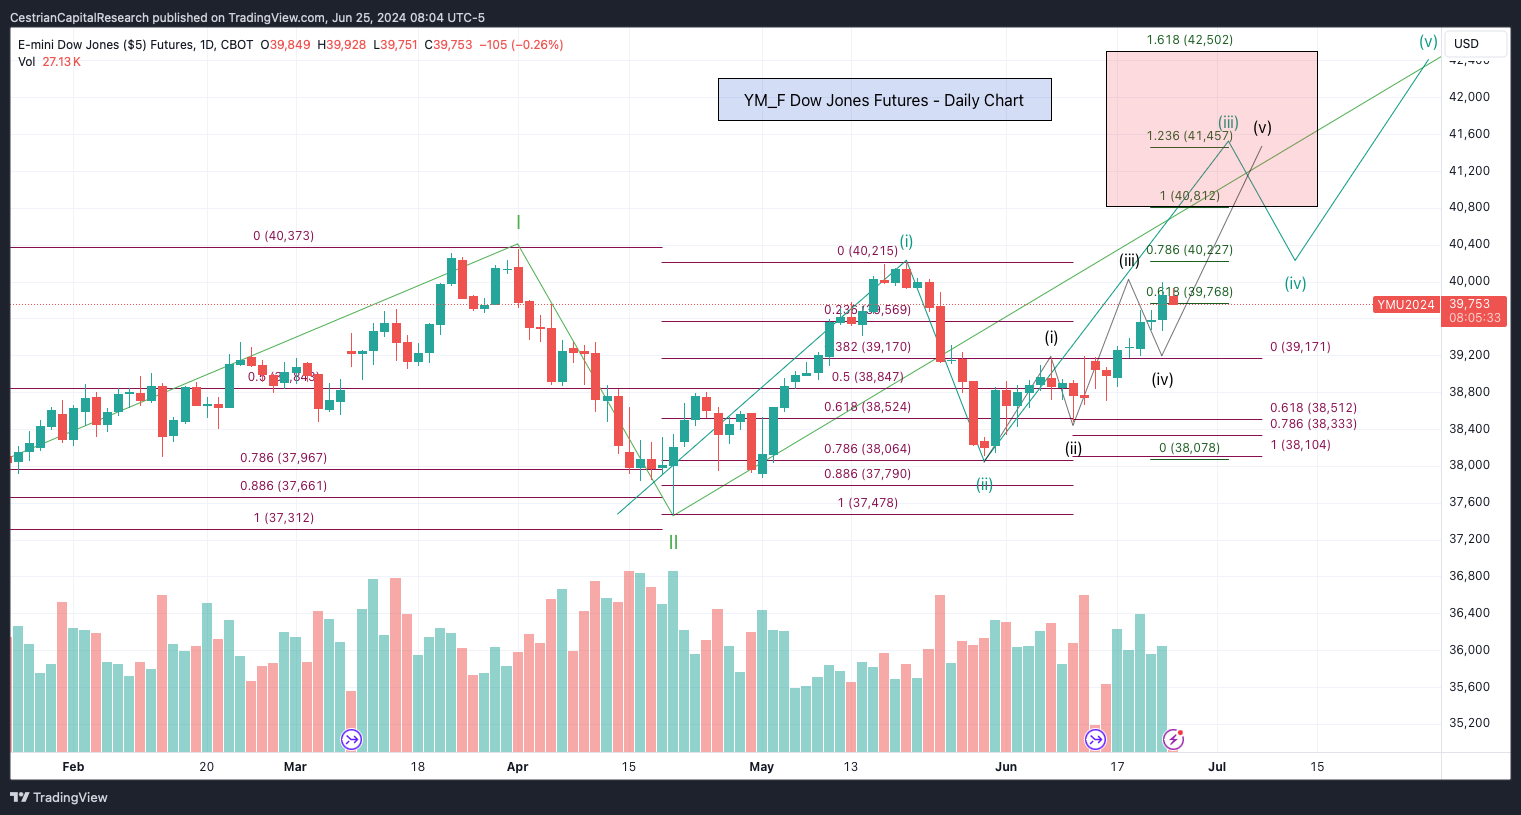
Dow Jones / DIA / YM / UDOW
Base vs. Bull Case - Larger Degree
No change. Note resistance right at the lower part of the Base Case W5 Termination Zone. To repeat - I think this can go higher but - that’s just my opinion.
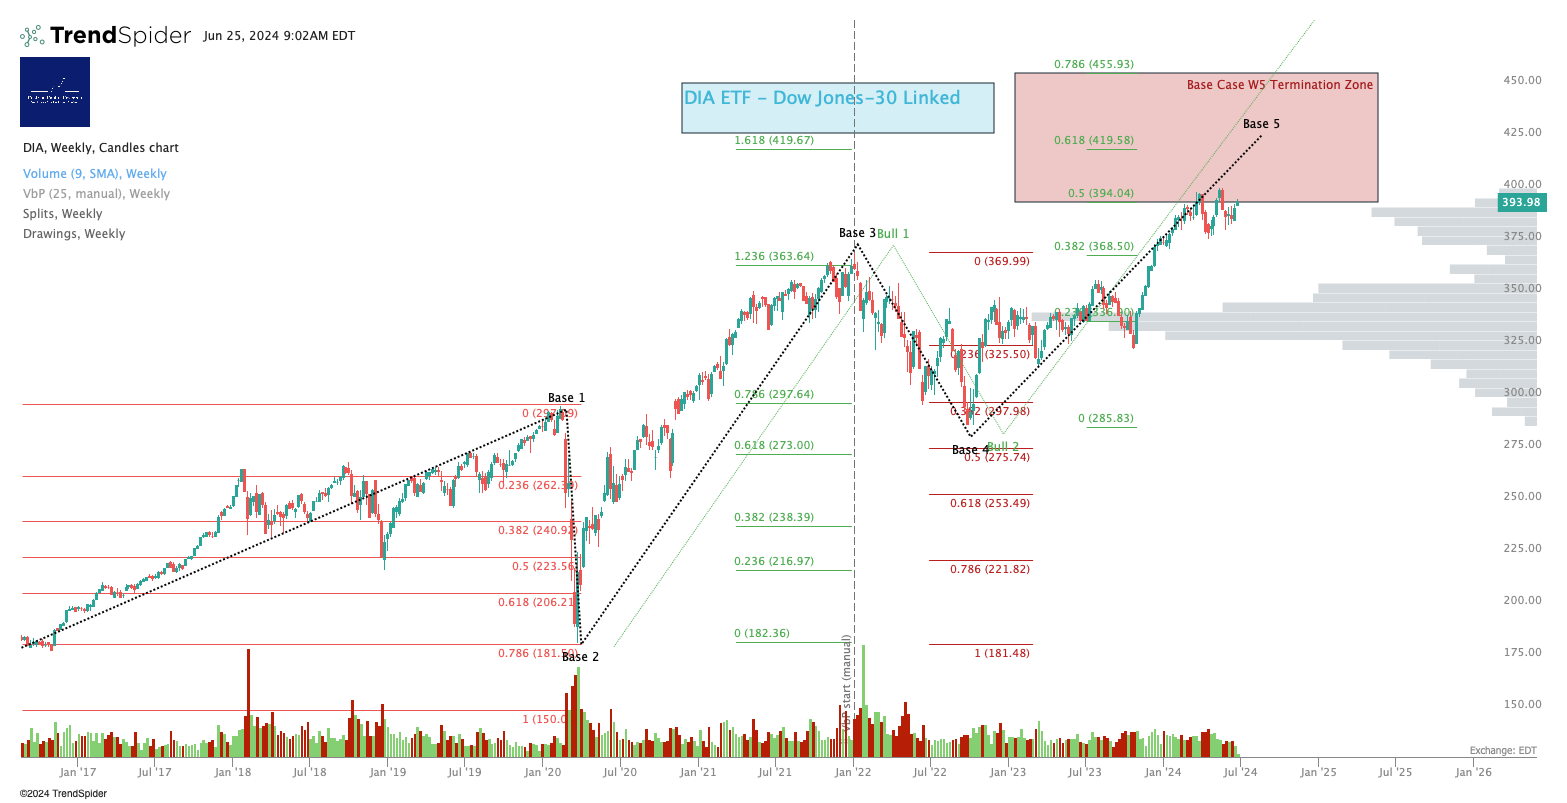
Still looks bullish to me.
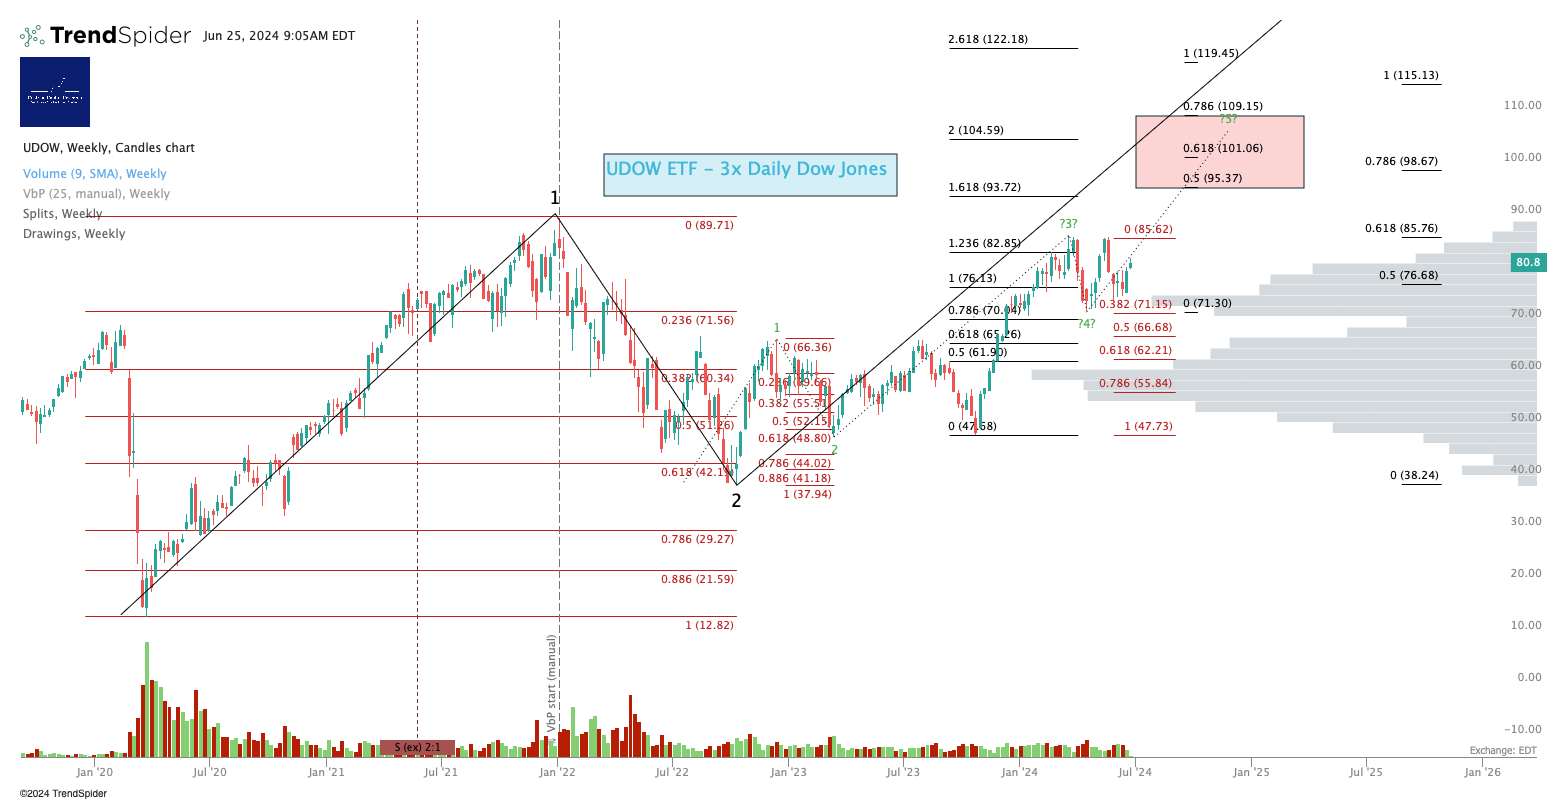
Personal Trading Plan Disclosure: I am unhedged long UDOW.
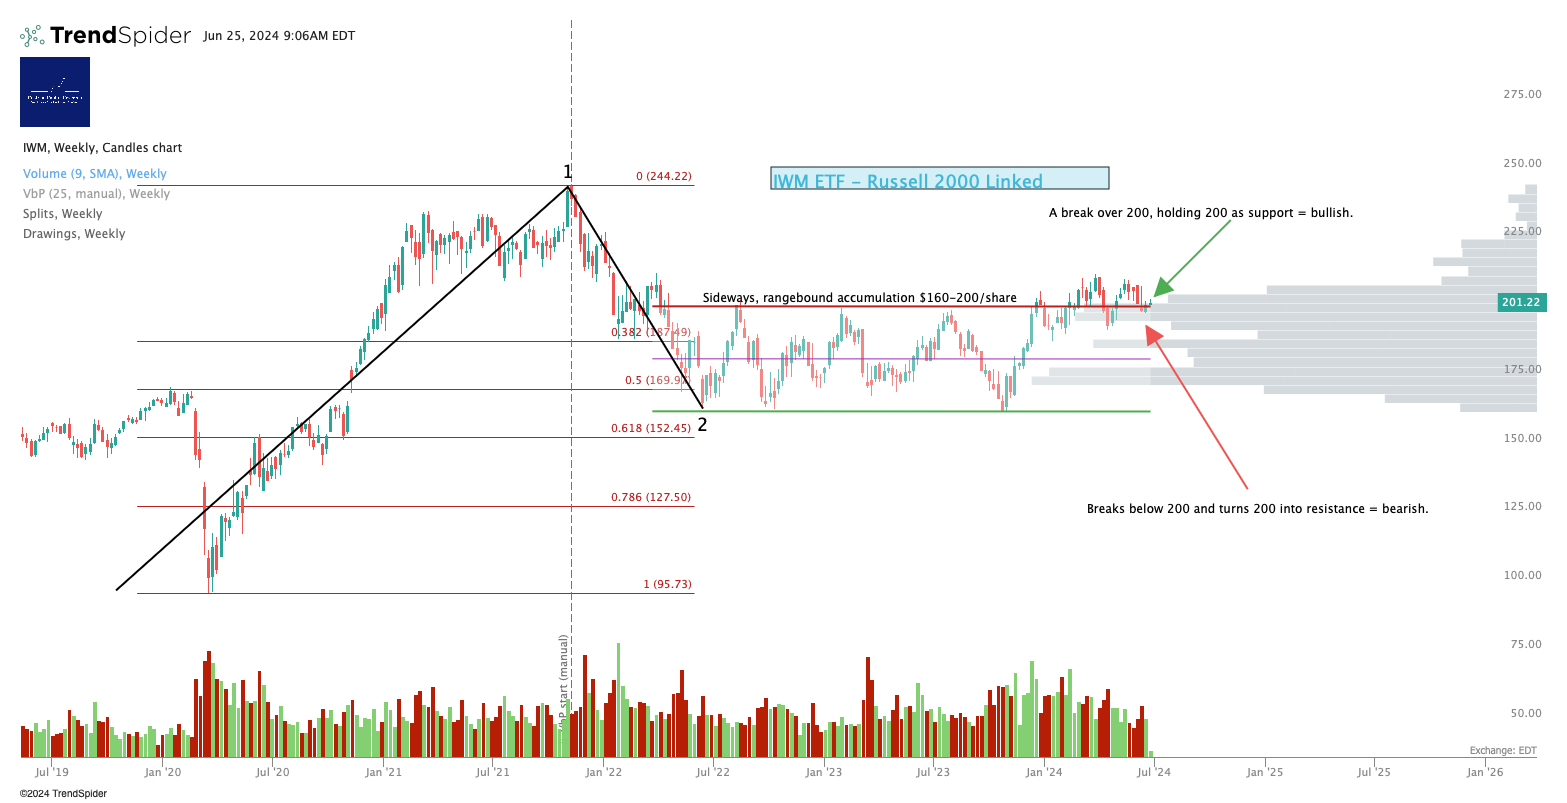
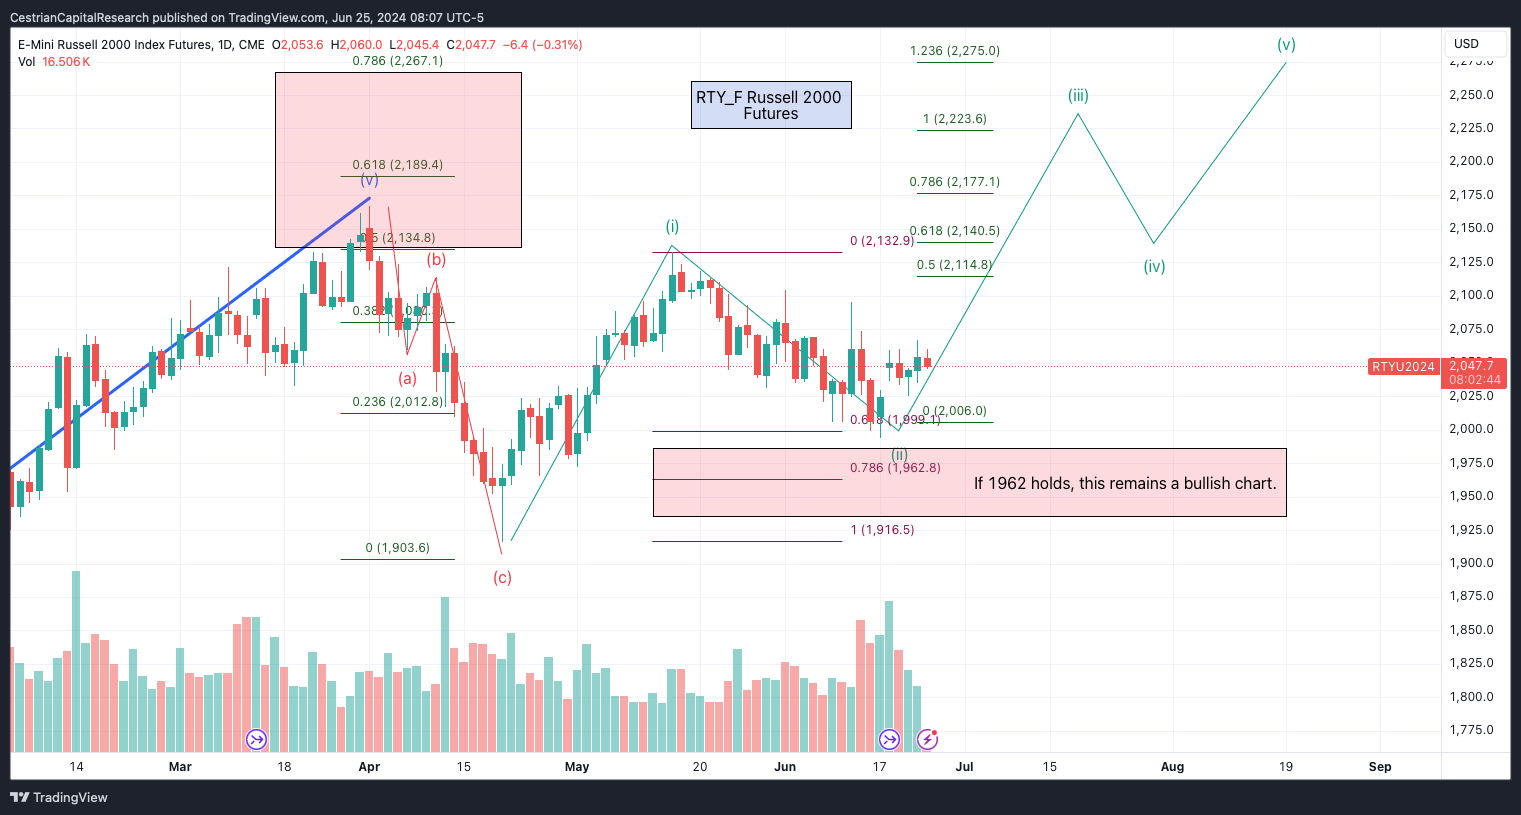
Russell 2000 / IWM / RTY / TNA
No change. Has to break up and over $200 to put in a bullish move. I note more volume up here in the low 200s (starting the count recently ie. all volume up there is 2023/4) than I might have expected - I think that is probably bullish. Personally I have started building a position in TNA accordingly.
TNA >40-43 would be a breakout confirmation in my view. There is hardly any volume up and over those levels, so it’s possible that IF the Russell breaks out, it can move up quickly. I personally am not getting excited about it. It’s just a ticker comprised of some lower quality issuers. And if it moons it probably means the bull is getting long in the tooth.
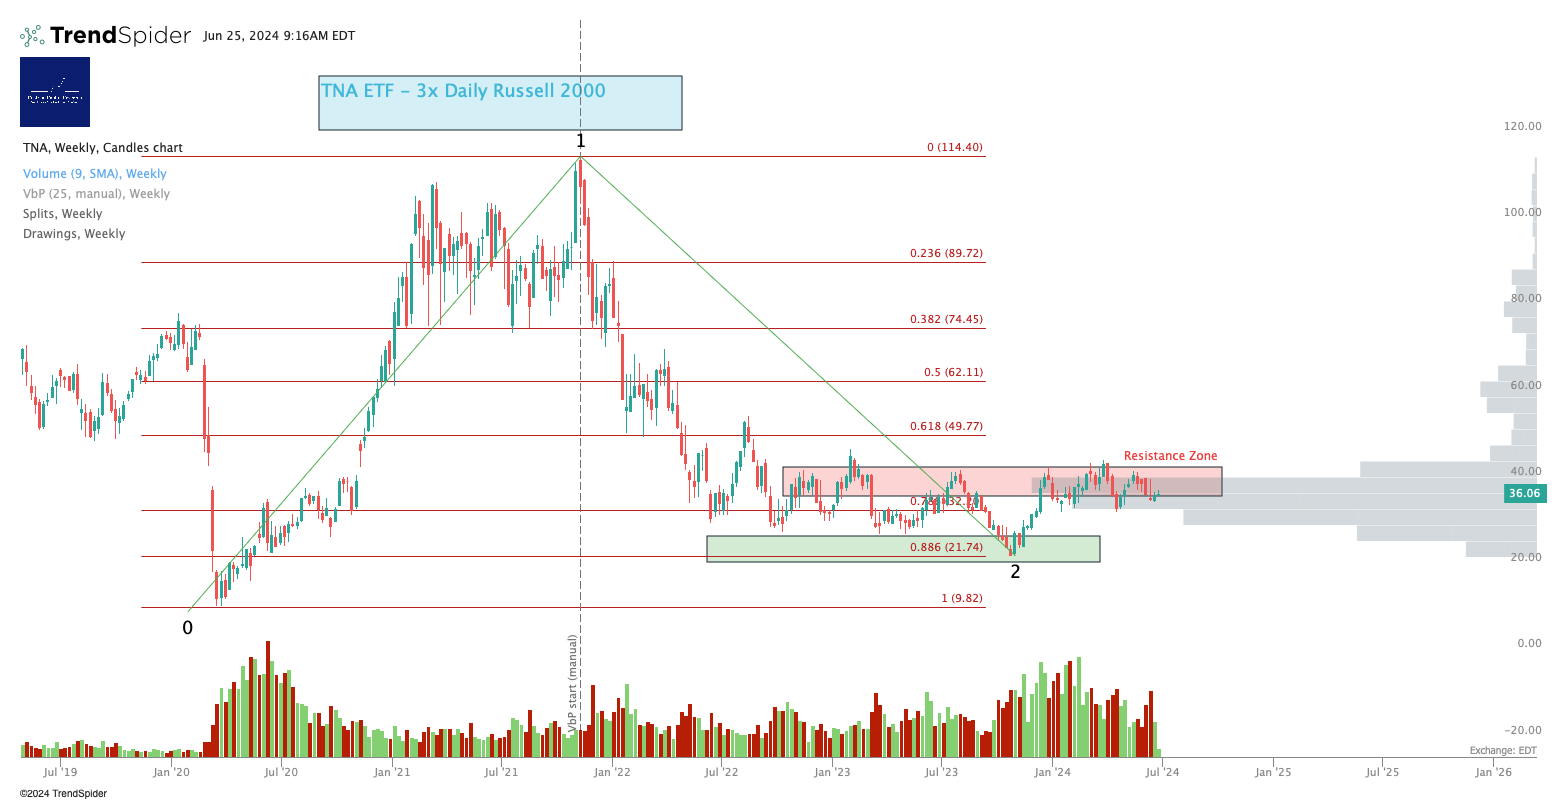
Personal Trading Plan Disclosure: I am unhedged long TNA.
Sector ETFs
3x Levered Long XLK (Tech) - TECL
I don’t think this is done yet - and if this isn’t done, SPY isn’t done.
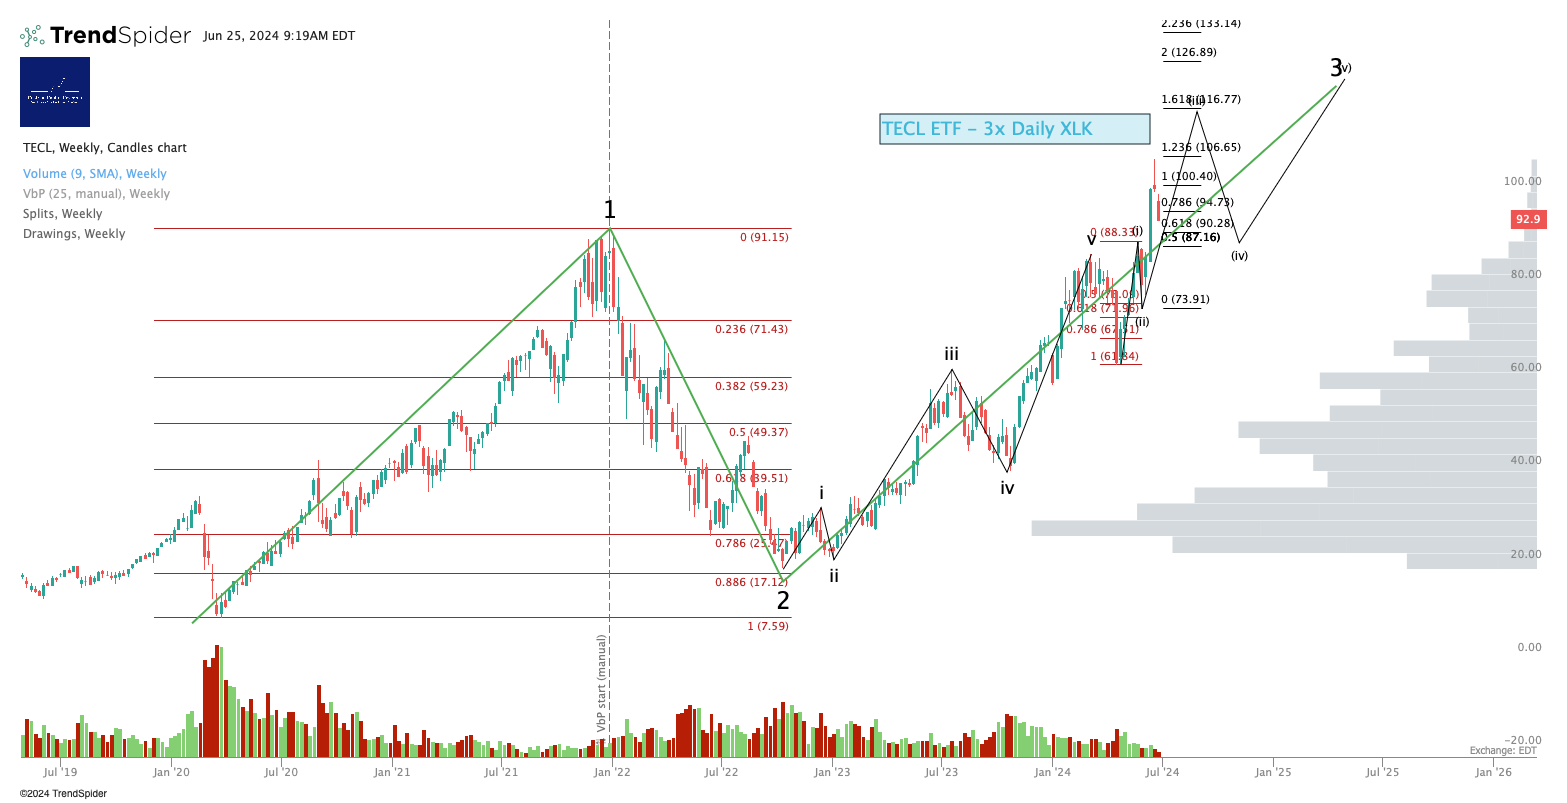
Personal Trading Plan Disclosure: No position in TECL or TECS.
SOXX (Semiconductor Sector ETF)
We talked a lot about this one in yesterday’s note - that’s important stuff to consider if you’re long semiconductor names - you can read it here.
3x Levered Long SOXX (Semiconductor) - SOXL
As we have said for some days now - short term this is now in the ‘potential Wave 5 termination zone’ box. Care needed here in case of reversal. SOXS can act as a hedge. SOXL is up in premarket but it’s the closing prices that matter more.
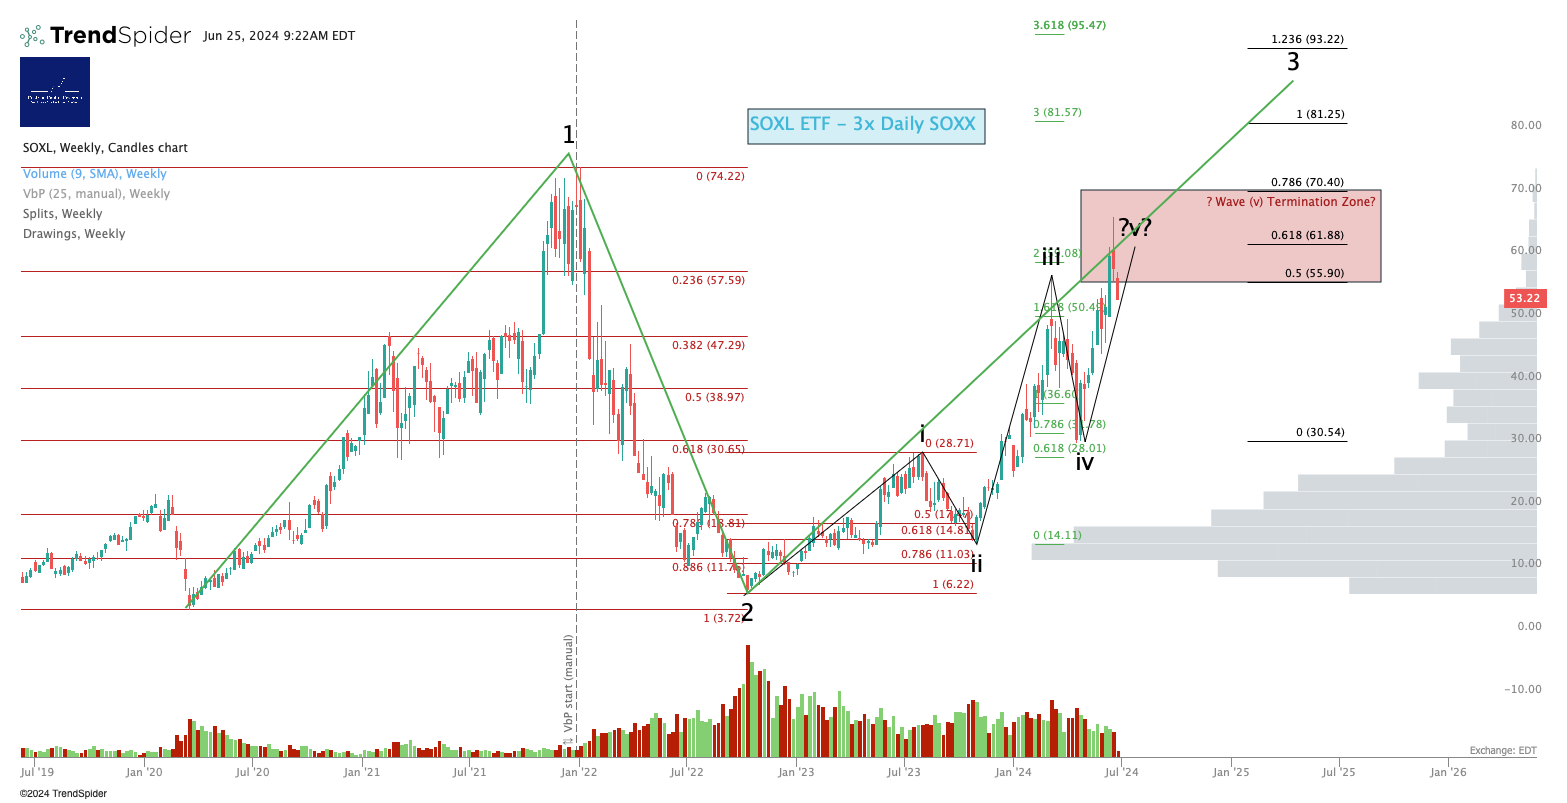
Personal Trading Plan Disclosure: I am unhedged long SOXL.
3x Levered Long Megacaps - FNGU
Yesterday I said - "To repeat - FNGU is thinking about rolling over up here - look at how it is stalled just above that 1.618 extension. Care needed if long - remember FNGD can act as a hedge.”. Well, it’s now at $407. Has to get up and over $443 to continue upwards.
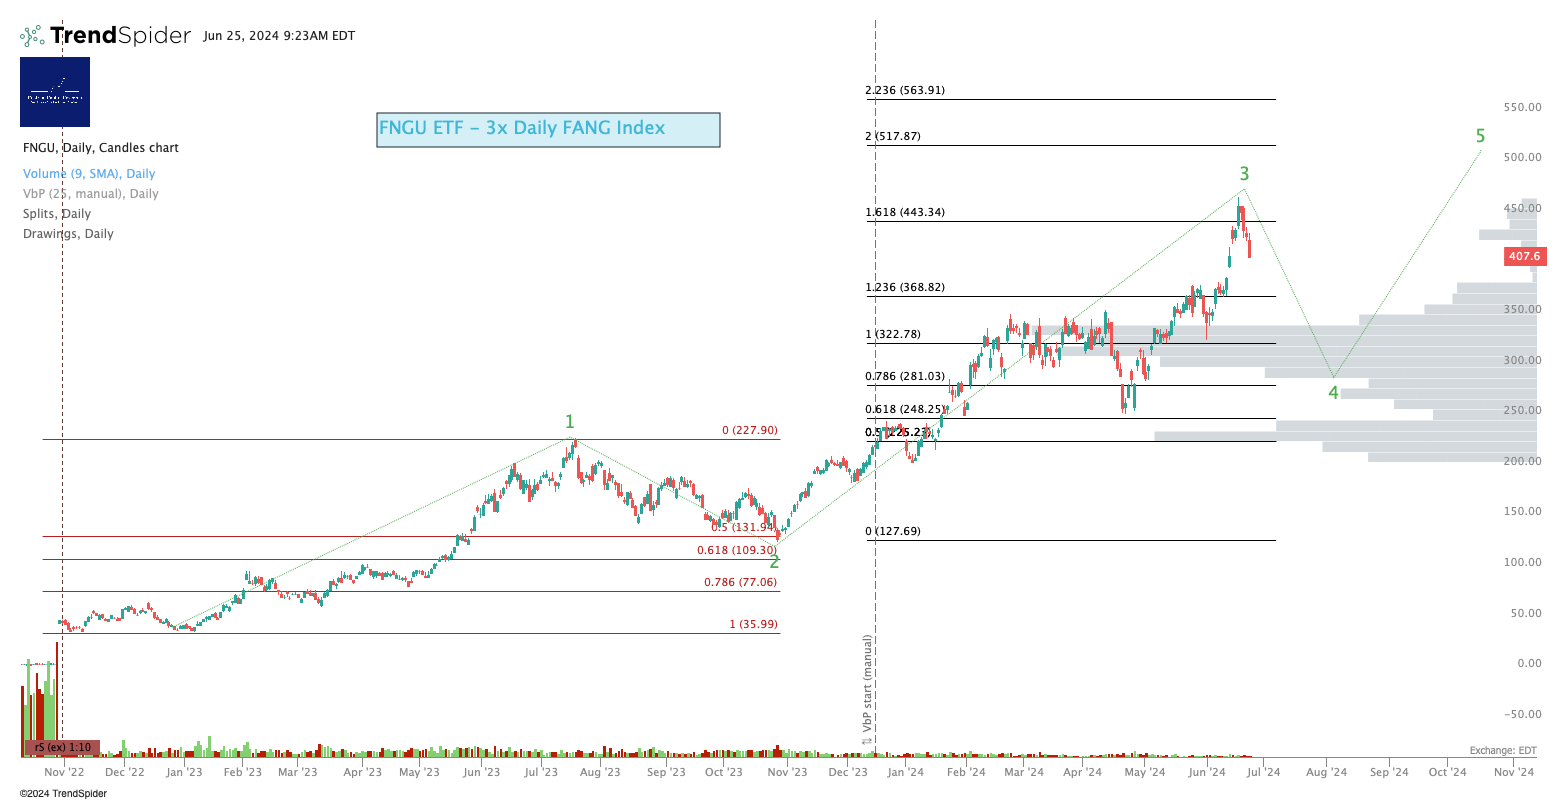
Personal Trading Plan Disclosure: No position in FNGU or FNGD.
Alex King, Cestrian Capital Research, Inc - 25 June 2024. DISCLOSURE - Cestrian Capital Research, Inc staff personal accounts hold long positions in, inter alia, TQQQ, UPRO, UDOW, TMF, TNA, UCO, SOXL, NVDA, plus 3USL and QQQ3 (EU UCITS equivalent to UPRO and TQQQ respectively).