
Veeva Systems (VEEV) Q2 FY1/2025 Earnings Review

Summary
- Veeva continues to deliver strong performance despite several headwinds.
- TTM revenue growth and EBITDA margins have both improved.
- Stock appears to be under accumulation at current levels.
- Read on for detailed financial and technical analysis, as well as ratings.
DISCLAIMER: This note is intended for US recipients only and, in particular, is not directed at, nor intended to be relied upon by any UK recipients. Any information or analysis in this note is not an offer to sell or the solicitation of an offer to buy any securities. Nothing in this note is intended to be investment advice and nor should it be relied upon to make investment decisions. Cestrian Capital Research, Inc., its employees, agents or affiliates, including the author of this note, or related persons, may have a position in any stocks, security, or financial instrument referenced in this note. Any opinions, analyses, or probabilities expressed in this note are those of the author as of the note's date of publication and are subject to change without notice. Companies referenced in this note or their employees or affiliates may be customers of Cestrian Capital Research, Inc. Cestrian Capital Research, Inc. values both its independence and transparency and does not believe that this presents a material potential conflict of interest or impacts the content of its research or publications.
Braving the Macro Headwinds
By Abhishek Singh
Veeva posted another strong quarter.
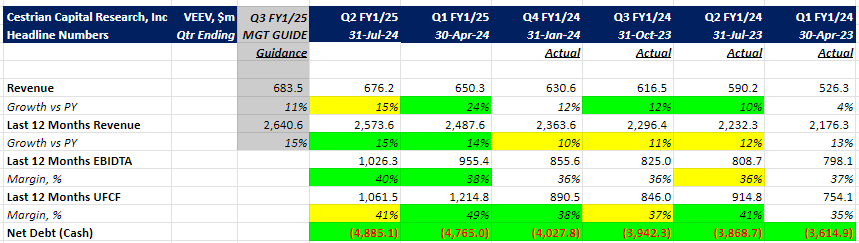
- Revenue Growth for Q2 FY1/2025 vs the previous year’s quarter is 15%. Revenue Growth for Q1 FY1/2025 vs previous year’s quarter was 24%.
- TTM (Trailing Twelve Months) revenue growth increased by 100 basis point to 15%.
- TTM EBITDA margins increased to 40%; however, TTM Cash Flow margins showed 8% decline.
- The balance sheet remains strong with $4.9 billion in cash.
Note: the decline in Q2 vs Q1 numbers for percentage revenue growth and FCF margin may appear drastic. We explain further in the Fundamental Analysis section why that is not the case.
Subscription revenue in Q2 increased by 19% year-over-year, whereas the professional services revenue declined by 4% year-over-year.
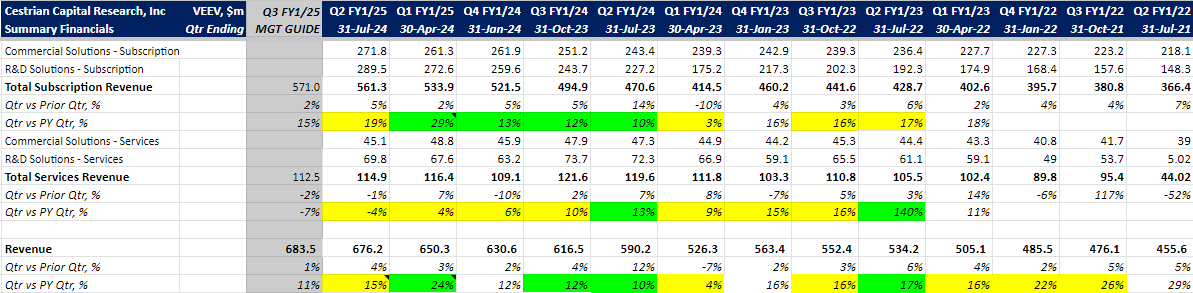
We previously discussed Veeva’s revenue streams in detail (read here). As a reminder, subscriptions revenue is the fees collected from customers accessing cloud-based software solutions and data solutions, while professional services revenue comes from fees related to implementing these solutions, along with training and business consulting services. Professional services revenue is expected to continue to face headwinds (macroeconomic factors, global conflicts, and a generally depressed Pharma/Biotech sector), as evident from lowered forecast for this revenue stream next quarter.
Pharma/Biotech stocks may see a temporary boost due to impending interest rate cuts. However, to really know what is going on beneath the surface in this sector, one should also consider recent layoffs (click here to read more) and the significant impact of the Inflation Reduction Act. For instance, the release of new prices for the first 10 drugs selected for the Medicare drug price negotiation program reveals a substantial reduction in list prices, ranging from 38% to 79% (click here to read more). Veeva’s performance in face of these headwinds is impressive. Its strong execution in the subscription segment continues to offset the decline in professional services revenue.
Read on for the financial detail, valuation, our stock chart and rating! Any paid subscription here gets you the full note.