The End Of The World Is Officially Over - Market On Open, Monday 29 July

DISCLAIMER: This note is intended for US recipients only and, in particular, is not directed at, nor intended to be relied upon by any UK recipients. Any information or analysis in this note is not an offer to sell or the solicitation of an offer to buy any securities. Nothing in this note is intended to be investment advice and nor should it be relied upon to make investment decisions. Cestrian Capital Research, Inc., its employees, agents or affiliates, including the author of this note, or related persons, may have a position in any stocks, security, or financial instrument referenced in this note. Any opinions, analyses, or probabilities expressed in this note are those of the author as of the note's date of publication and are subject to change without notice. Companies referenced in this note or their employees or affiliates may be customers of Cestrian Capital Research, Inc. Cestrian Capital Research, Inc. values both its independence and transparency and does not believe that this presents a material potential conflict of interest or impacts the content of its research or publications.
Reset and Re-Imagine. For A Little While.
by Alex King
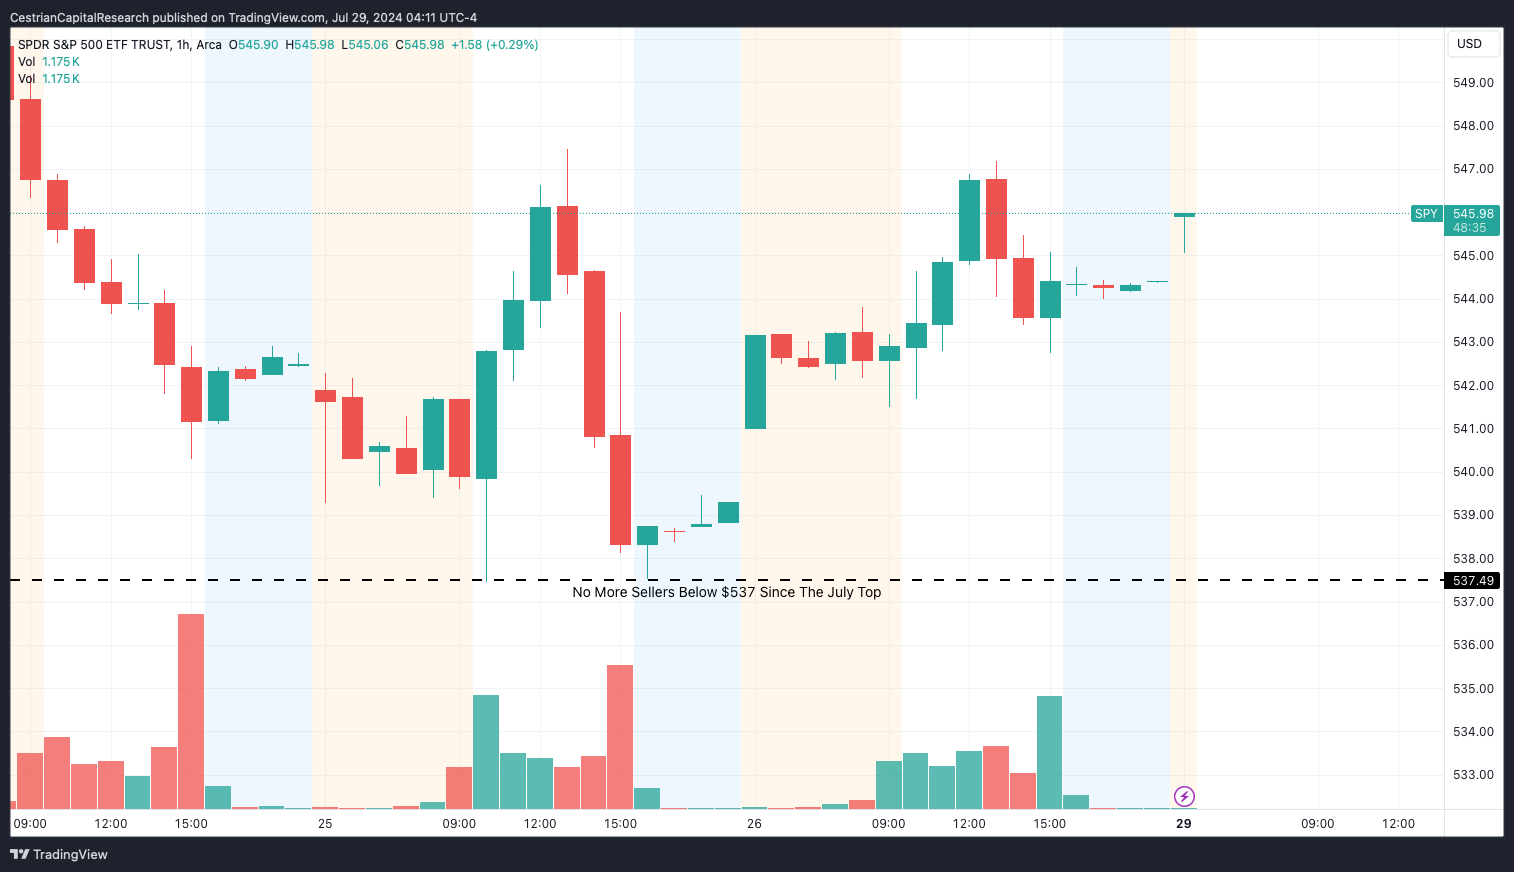
The main-market July selloff commenced with the Nasdaq’s all time high on July 11; the S&P peaked a little later on the 16th. The low came in on Thursday which saw a very clean early- and late-day double-bottom in the S&P500. Here’s an hourly chart of $SPY covering that period.

Thursday's close saw a very interesting (to me at least!) phenomenon whereby the riskier the asset, the more it moved up late in the day. $LABU > $SOXL > $QQQ > $SPY is how Thursday closed. This portended well for Friday.
Futures in Asia trading hours coming into Monday morning Eastern have been up, across all indices, and equity index ETFs have followed suit in pre-market trading.
The question is, can we call an end to the correction? My own view is that we are in a B-wave up. This is a fancy way of saying that I think the first stage of a seasonal Q3 correction is probably done, and now we’re in a relief rally. I suspect that before Q3 is done we’ll see indices lower than they are today, but not before a move up first. This is a tricky time in markets in my view. In April this year we saw a correction which “should” have seen a B-wave up from the 19th April lows and then another C-wave to lower lows, below that 19 April level. Didn’t happen. The market kept on rising. So if one was positioned according to what “should” have happened, you either lost money or incurred opportunity cost.
Personally I had banked all short gains by the time that Thursday closed out (Inner Circle subscribers get these alerts before trades are placed) and was long-only on Friday, which (phew!!) proved correct. I have wound on further long positions today but I remain on watch for this being a relief rally. If the market is straight up from here I will be under-exposed at present and will want to add longs on the way up, but I’m happy to do that stepwise rather than going all in right away. My personal plan remains, watch for a B-wave top and when it arrives, wind on the short hedges once more.
If you’d like to learn in real time how to invest and trade this way, you have three days left to join our Inner Circle service at the current low prices. On Thursday this week the price for new joiners rises from $2499/yr to $2999/yr, or $299/mo to $399/mo. You can sign up right here to lock in today’s price for as long as you remain a subscriber.
So Let’s Get To Work
As always in our market notes, we deal with long- and short-term charts covering the main US equity indices - that’s the S&P500, Nasdaq-100, Dow Jones-30, and the Russell 2000 - plus bonds, volatility, oil, and key sector ETFs. You can use these daily notes to help you navigate long-term investments, and/or to help you action short-term trading. Any paid-tier subscription here gets you these notes every trading day.
