
Should Fed's 50bp Cut Spark Recessionary Concerns? (No Pay Wall)

From Powell's "Confident" Press Conference to a Comparison With 2007 - By Yimin Xu
DISCLAIMER: This note is intended for US recipients only and, in particular, is not directed at, nor intended to be relied upon by any UK recipients. Any information or analysis in this note is not an offer to sell or the solicitation of an offer to buy any securities. Nothing in this note is intended to be investment advice and nor should it be relied upon to make investment decisions. Cestrian Capital Research, Inc., its employees, agents or affiliates, including the author of this note, or related persons, may have a position in any stocks, security, or financial instrument referenced in this note. Any opinions, analyses, or probabilities expressed in this note are those of the author as of the note's date of publication and are subject to change without notice. Companies referenced in this note or their employees or affiliates may be customers of Cestrian Capital Research, Inc. Cestrian Capital Research, Inc. values both its independence and transparency and does not believe that this presents a material potential conflict of interest or impacts the content of its research or publications.
Today, we are dissecting what happened in last week's FOMC, and why the decision of a 50bp cut is a sign of the Fed panicking and not suggesting confidence.
We look back to the last two times that the Fed started the rate cut cycle with 50bp, namely in 2007 and 2001. I mapped out the economic conditions at the time and how both the market and macro data evolved in the days after. It could offer us plenty of guidance for how the current market may develop in the next 12 months.
My private channel at Cestrian to provide winning trade ideas in 3 key areas:
- Income Producing Instruments – including US Treasury ETFs and Business Development Companies (BDCs)
- Mega-cap Equities - including Mag-7, Financials, Exchanges, Payments
- Bitcoin, Ethereum, Gold, and Silver - how to win in today's rate cut cycle
You can claim your 7-day free all-access via my Launch Pass page now!

1. Powell Dodged Key Questions In The Press Conference
Going into last week's FOMC, the market widely debated whether the Fed would (not should) cut by 25bp or 50bp.
Nearly all of the Economists surveyed by Bloomberg and CNBC believed 25bp was appropriate. The trading desks at the big banks (Citi most notably) called for 50bp, after a WSJ article put 25bp in doubt just 3 trading days before the FOMC.
As a rule of thumb, Trading > Economists. This is because the gigantic rates market bets trillions of dollars every day on how the Fed decides. The rates market is often a couple of steps ahead of the Fed or non-risk-taking economists, and if not the case, they can just bully the Fed by throwing a tantrum anyway. This will be a useful guide as we navigate the rest of the rate cut cycle.

The fresh dot plot suggests a median projection of 100bp cut for 2024, which is 4 times the 25bp cut projected in June. For 2025, the Fed sees another 100bp cut, before finishing the cycle in June at the 2.75-3% range. Coincidentally, the 2024 projection was pretty much what the rates market priced going into the meeting. It’s probably safe to ignore the Dot Plot plot at this point, as the FOMC members change their minds faster than the British weather.
When asked “ what changed that made the Committee go 50”, Powell could not provide a direct answer. Powell simply went along the lines of we looked at the data and “we thought about what to do, and we concluded that this was the right thing for the economy, for the people that we serve, and that's how we made our decision.”
Moreover, Powell decided to double down on the decision by suggesting that “We made a good, strong start to this and that's really, frankly, a sign of our confidence…we don't think we're behind, we think this is timely, but I think you can take this as a sign of our commitment not to get behind.”
2. Fed Is Not Actually “Confident”.
The truth is that the 50bp cut is an Emergency Cut. the Fed is very concerned about the US economy’s outlook, including but not exclusively the labour market. This is despite Powell’s insistence the labour market is strong.

The Fed’s September Economic Projections gives these concerns away. The Fed projected to cut rates from 5.25-5.50% to 2.75-3% within 2 years, but the change in real GDP remains flat at 2% between now and 2027. Meanwhile, Unemployment rate in 2027 will be at the same level as we saw earlier this month.
All else equal, cutting the base rate by 250bp should have a large positive impact on economic growth and the labour market. However, the Fed thinks they need to cut rates by 250bp just to keep the economy at the same place.
This means the Fed implicitly expect very strong economic headwinds touching both the labour market and the GDP (which are intrinsically linked), and they have to cut big to steer the economy clear of a recession.
3. We Check Back 2007 and 2001.
Another big coincidence is that the last time the Fed started the rate cut cycle with a 50bp cut, it was on the exact same date in 2007, September 18.
The equities market showed striking similarities leading up to the event.
SPY 2024 (top) vs 2007 (bottom) (https://www.tradingview.com/x/biJk0qRB/)

SPY in both years endured big dips in Spring and July-August, before recovering the ATHs.
In 2007, the market celebrated the rate cut as SPY shot up 2.9% on the day, while this year, we had SPY closing +1.7% on T+1. According to the CNN, the decision between 25bp and 50bp was also a coin toss in 2007, as “Some investors had thought that Fed chair Ben Bernanke would take a more cautious approach and not cut rates by such a large margin, because a half-point cut could signal the Fed was acting out of desperation to save the economy.”
Sounds familiar? Is it just a coincidence? How can we tell if we are in a similar recession to the Great Financial Crisis?
I dug through some key market and macro data from 2007 that we can use to compare from today.
The 2007 Rate Cut Cycle
Things initially appeared within control, until they weren’t.

The horizontal x-axis is the “number of days since the first cut”.
SPY (RHS scale) initially shot up as the Fed delivered a jumbo rate cut of 50bp, with investors expressing relief that the Fed could save the economy from a recession. However, as time wore on, the stock market collapsed by over 40% after 18 months, as the Fed slashed the Fed Funds rate by more than 500bp to 0%.
There was a period of a stock market rebound between 120 days and 220 days, but that proved to be shortlived.

The 2007 rate cut began with the Unemployment Rate at 4.6% (today’s UR is 4.2%). Nonfarm Payrolls in September (for August) was -25k, but it quickly delivered an average of 100k new jobs in the next four readings. However, things were downhill from there, as Unemployment Rate climbed to 5% after 4 months, then nearly 7% by the time of the final cut.

CPI and PCE actually shot up from below the Fed’s 2% target to over 4%. Oil prices rose too, before peaking in early 2008. It would seem that inflationary concerns were back.
The 10Y bond yield stayed flat in the first month, but fell steeply from 4.5% to 3.5% by the 6th month.

Finally, VIX started benign, creeping up slowly after the first month. It spiked only after August 2008.
CCC & lower Corporate Bond spread (i.e. Junk grade) was only 7-8% at the start of the cycle (today it’s at 8.5%). The spread climbed to above 20% in the summer of 2008 and spiked above 30% in Q4 2008.
The 2001 Rate Cut Cycle
The 2001 marked the Dotcom bubble burst. From a narrative perspective, it feels much closer to today’s AI hype than the 2007-08 Subprime Crisis.
SPY 2024 (top) vs 2001 (bottom) (https://www.tradingview.com/x/E6R00Zfd/)

The Fed just finished its rate hike cycle in May 2000, keeping the Fed Funds rate at 6.5% through to the year-end. However, unlike today, the stock market had already peaked before the final hike and drew down 20% by December.

On January 03, 2001, the Fed kicked off the new year with an emergency 50bp cut, followed by another 50bp on January 31. The Fed delivered five 50bp cuts, then two 25bp cuts, and another string of 50bp and 25bp cuts until the base rate fell to 1% in June 2003.
Equities fell by 20% (after having already fallen 20% from peak before the first cut) after the Fed delivered 400bp of cuts.

Unemployment Rate increased from below 4% (tighter than today!) to above 5.5% after a year. Nonfarm Payrolls printed 165k net new jobs in January, but nosedived to negative territory in March.

CPI and PCE were above the Fed’s target levels, but quickly fell below the 2% target as economic demand vanished. Oil prices followed a similar pattern (it was less than $30 USD back then).
The 10Y yield actually stayed quite elevated by today’s standard, only falling by less than 100bp in the year, although it had already come down from 6.6% to 5% in 2000.

Finally, VIX and CCC-grade corporate bond spread were fairly range bound in that cycle.
4. Today’s Yield Curve
Today, we have a quarterly GDP growth of 3%, and Unemployment Rate of 4.2%, and the latest Nonfarm Payrolls of 142k new jobs added. CPI is at 2.6% and PCE is at 2.5%, both slightly above the Fed’s target but they have been trending down. VIX is at 15, while CCC-grade bond spread is at 8.7%.
Nothing screams a recession on the surface, except for the Sahm Rule and Yield Curve inversion now starting to revert. The Fed openly disputes the claim that a recession is coming.
But looking back 2001 and 2007, things could and would turn rapidly, not to mention again that the Fed delivered a seemingly emergency 50bp rate cut without really explaining why.
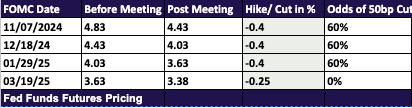
The market is now pricing in more than even odds for a 50bp cut in each of the next three FOMCs. In contrast, the Fed's dot plot (with completely no credibility at this point) suggests just 25bp cuts in November and December. I expect the Fed to continuing following the market pricing now their concerns have shifted towards "not being behind the curve" and "supporting the labour market".
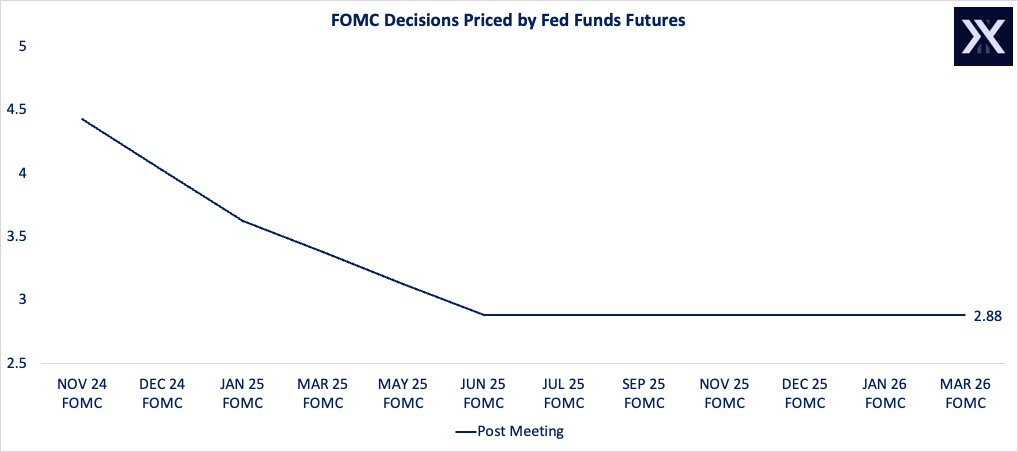
TLT Hourly (https://www.tradingview.com/x/Aa65HEC2/)
Why has TLT, with a seemingly dovish outlook, continued to slide after the FOMC? This is thanks to the yield curve steepening, as the previously inverted yield curve is starting to normalise. Yield curve steepening occurs when the longer end yields rise faster or falls slowlier than the shorter end yields.
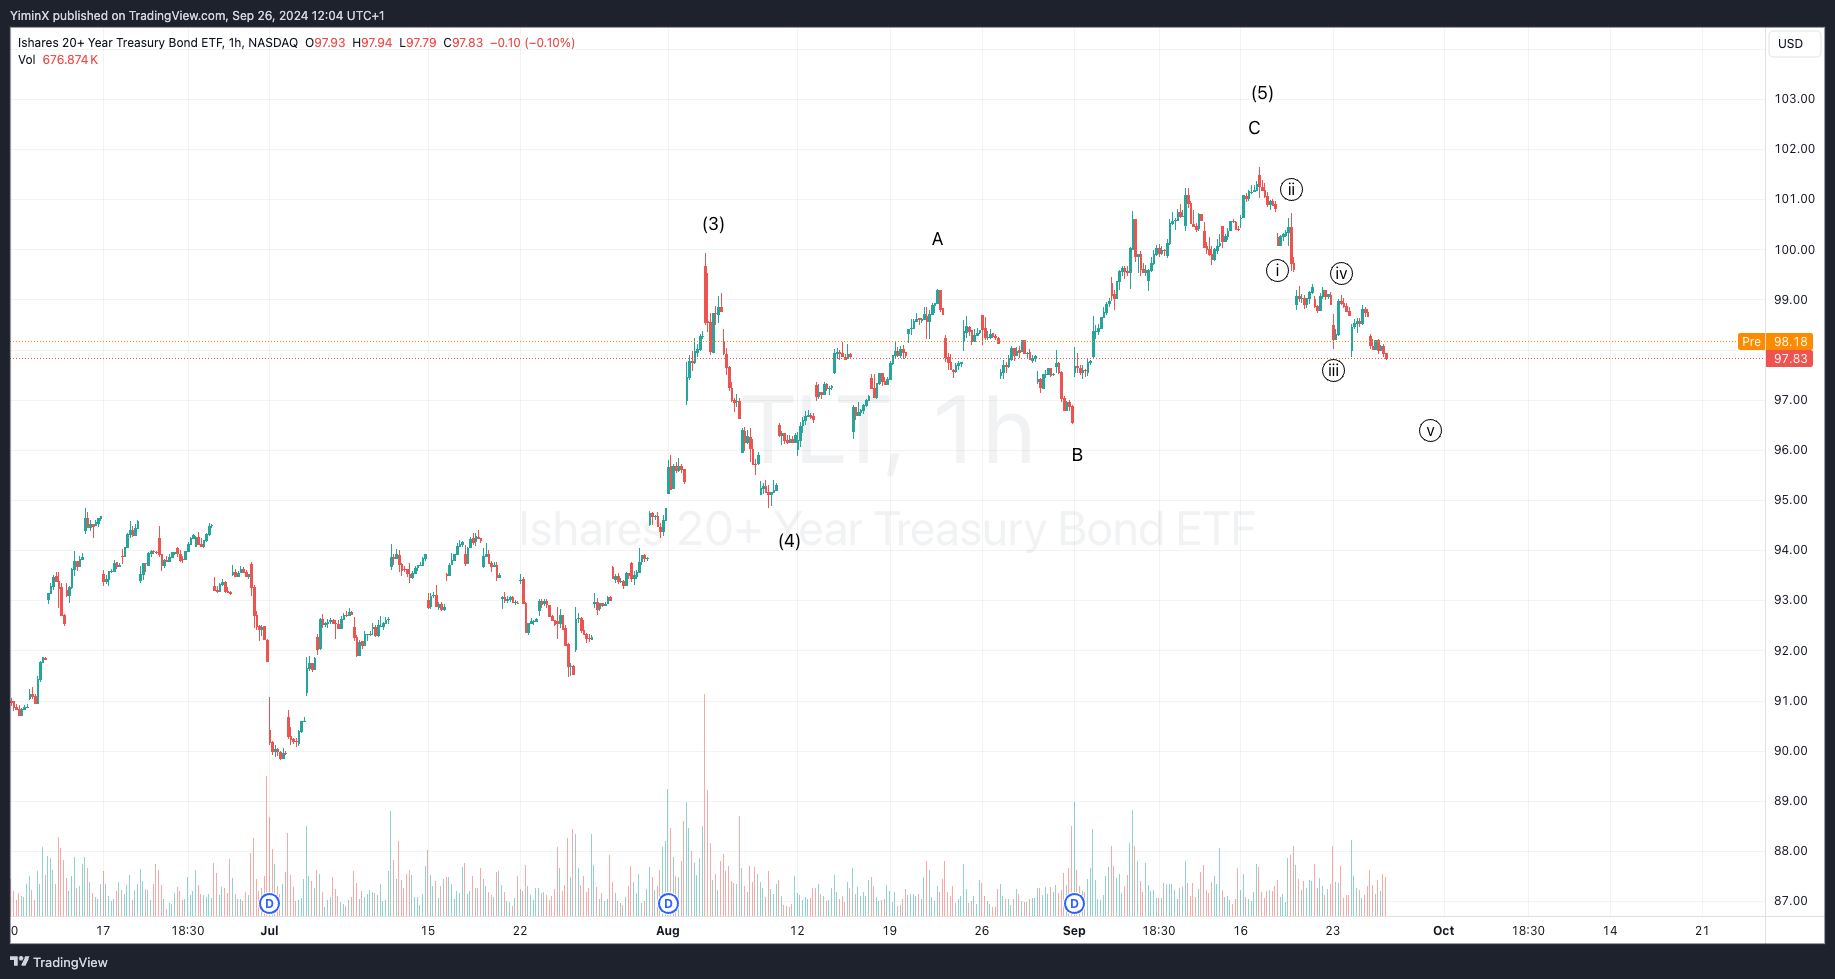
US10Y - US02Y spread (https://www.tradingview.com/x/3iv05Kti/)
The US2Y vs US10Y spread has been on an upward swing, climbing by 20bp since the FOMC.
The mechanics of this spread is that the US2Y yield actually fell post FOMC, pricing in slightly more dovishness in the short term, but the US10Y yield rose aggressively (as well as all the tenors from 5Y+).
What the market is telling us is that 1) they believe, for now, the FOMC's aggressive cuts should avert a deep recession by bringing the nominal rate below 3%, and 2) there is a risk of inflation resurgence down the line still, in which case the neutral rate of interest will higher than today.
If point 1 isn't true (i.e. the cuts are not enough to avert a recession), then the market should expect 400-500bp cuts instead, as the Fed did in 2001 and 2007. This is not currently priced in yet.
TLT Weekly (https://www.tradingview.com/x/vyIUnWew/)
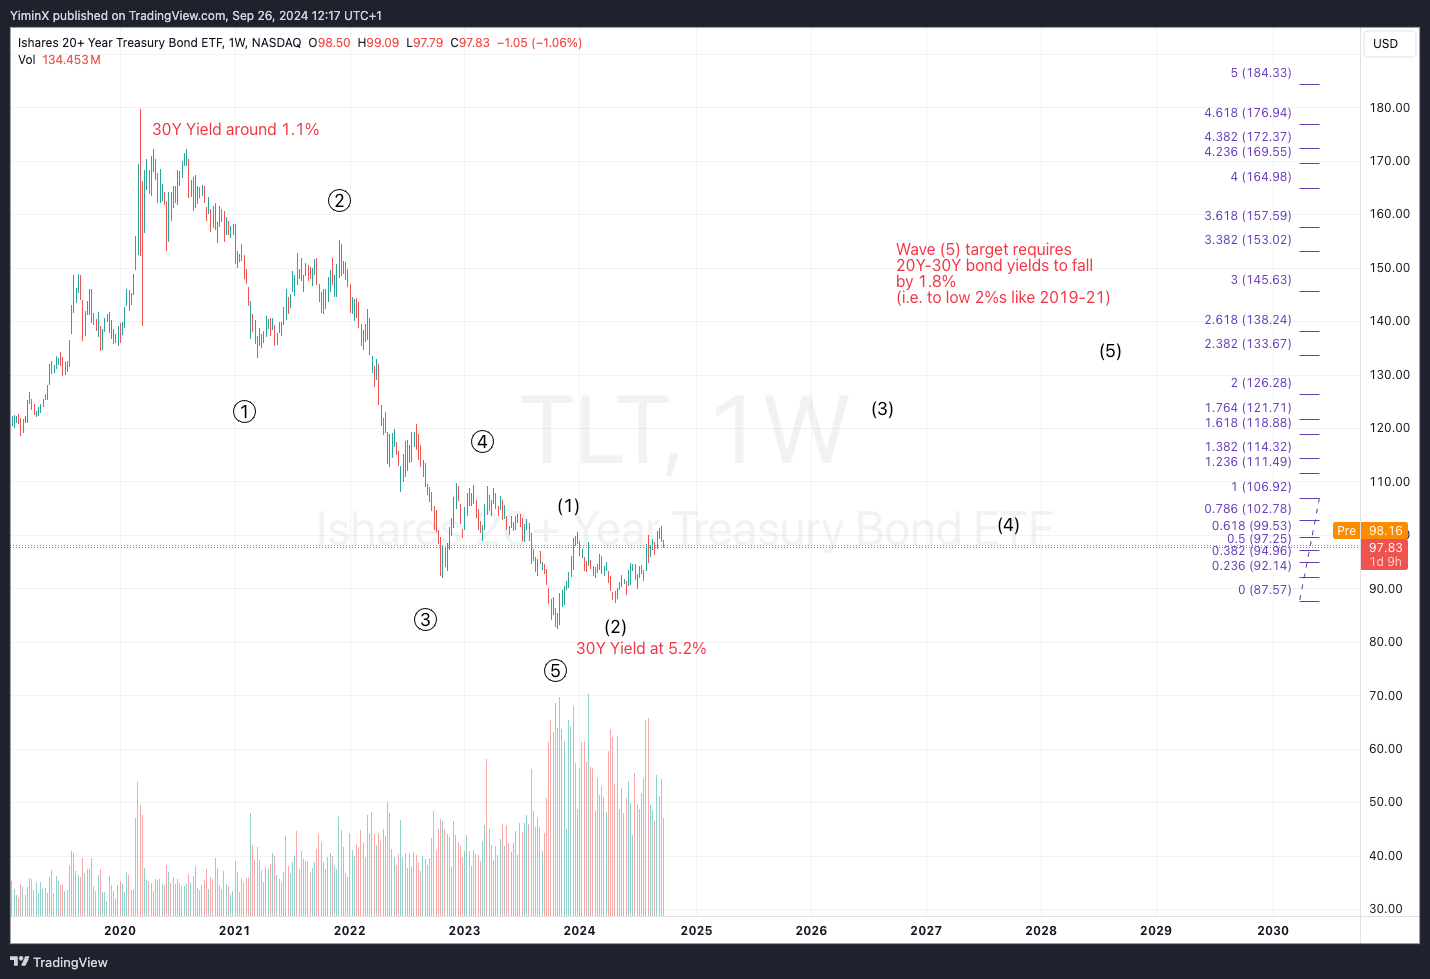
I think there is every chance we may get a much steeper market pricing for rate cuts in this cycle. Perhaps not tomorrow, or next month, but early or mid-2025. The longer end yield can get all the way down to low 2% like it did in 2019. This would be bullish for TLT, which can get all the way up to $130 in the medium term.
Beyond that, we are also faced with the US debt deficit risk, which can complicate the pricing of long-term bonds. But that's a topic for later.
Yimin
September 26, 2024, Premarket.