
Our Latest Tech Stock Recovery Idea

DISCLAIMER: This note is intended for US recipients only and, in particular, is not directed at, nor intended to be relied upon by any UK recipients. Any information or analysis in this note is not an offer to sell or the solicitation of an offer to buy any securities. Nothing in this note is intended to be investment advice and nor should it be relied upon to make investment decisions. Cestrian Capital Research, Inc., its employees, agents or affiliates, including the author of this note, or related persons, may have a position in any stocks, security, or financial instrument referenced in this note. Any opinions, analyses, or probabilities expressed in this note are those of the author as of the note’s date of publication and are subject to change without notice. Companies referenced in this note or their employees or affiliates may be customers of Cestrian Capital Research, Inc. Cestrian Capital Research, Inc. values both its independence and transparency and does not believe that this presents a material potential conflict of interest or impacts the content of its research or publications.
Hint- This Is Our Top Cybersecurity Pick
By Abhishek Singh
A little over two weeks ago we published “Two Tech Stock Recovery Ideas”. You can read all about it here. Here is another long idea you could factor into your own work.
We believe our latest, “Accumulate” rated long-term idea has the potential to provide material gains. We can be right or wrong, of course. By way of disclosure, we own this name in staff personal accounts.
Yet to sign-up for a Cestrian Capital Research subscription? You can choose one of the following:
Market Insight: our entry-level subscription. You get daily market analysis note, and you get earnings analysis on each of the 60+ single stock names we cover (the count is rising all the time we may add).
Inner Circle Membership: This includes everything in Market Insight plus additional premium features. You get access to a live chat environment with our analysts and a vibrant investor and trader community, weekly live webinars with an open-mic ask-us-anything format, real-time trade disclosure alerts whenever Cestrian staff personal accounts place trades in covered stocks and ETFs (including long/short hedging), model portfolios, and much more.
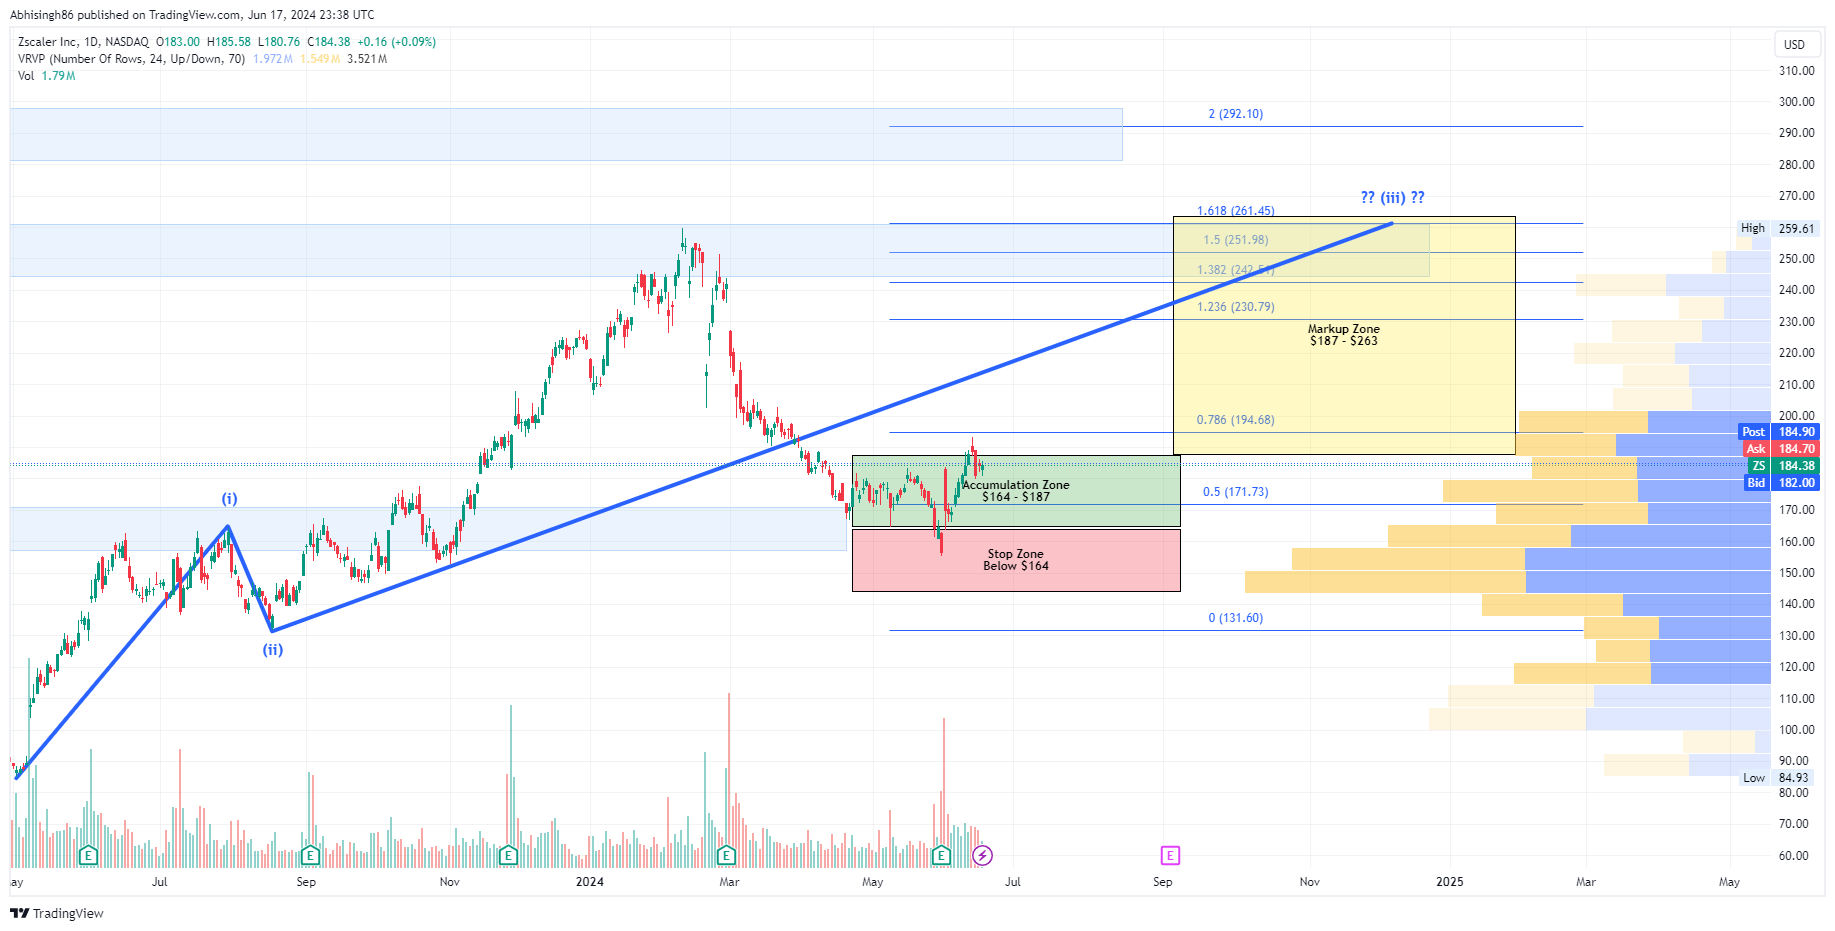
Our latest Tech Stock Recovery Idea is Zscaler ( $ZS ). It is our top cybersecurity pick based on superior technical and economic scalability, management execution skill, and fundamental financial strength. The company is maturing, as indicated by slowing revenue growth but steadily increasing margins, but we think it has plenty of growth left yet. (read more: ZScaler (ZS) Q2 FY7/24 Earnings Review).
Technical analysis:
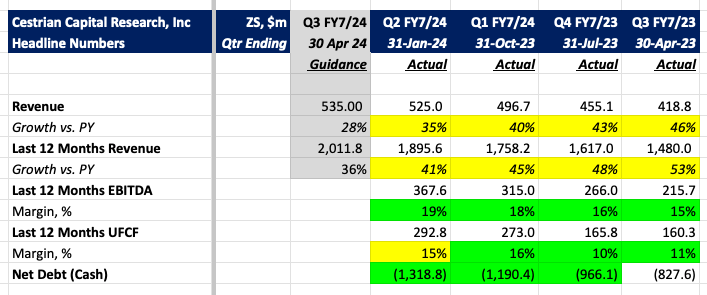
The stock put in an Elliot impulse Wave 1 from May’23 lows of $85 to highs of $164, followed by a shallow 38.2% retracement. Impulse wave 3 peaked at $258, a perfect 1.618 extension of Wave 1 placed at the Wave 2 low of $132. The following corrective Wave 4 has been a deep retracement, briefly breaching the prior Wave 1 high of $164.
According to Elliot Wave theory, in an impulse sequence, the Wave 4 low cannot overlap the peak of Wave 1. The corrective Wave 4 breaching this critical level might be due to one of the two possibilities: a.) Big Money move to take out stops placed right below the $164 level, or, b.) there is an alternate Elliot wave count. We will explore the latter in further detail.
For now, considering the last leg down was indeed a Wave 4, the next move up is an impulse Wave 5, which may terminate at 0.618-0.786 extension of the Wave 1-3 combined, placed at the Wave 4 low.
You can open the full page chart by clicking here.
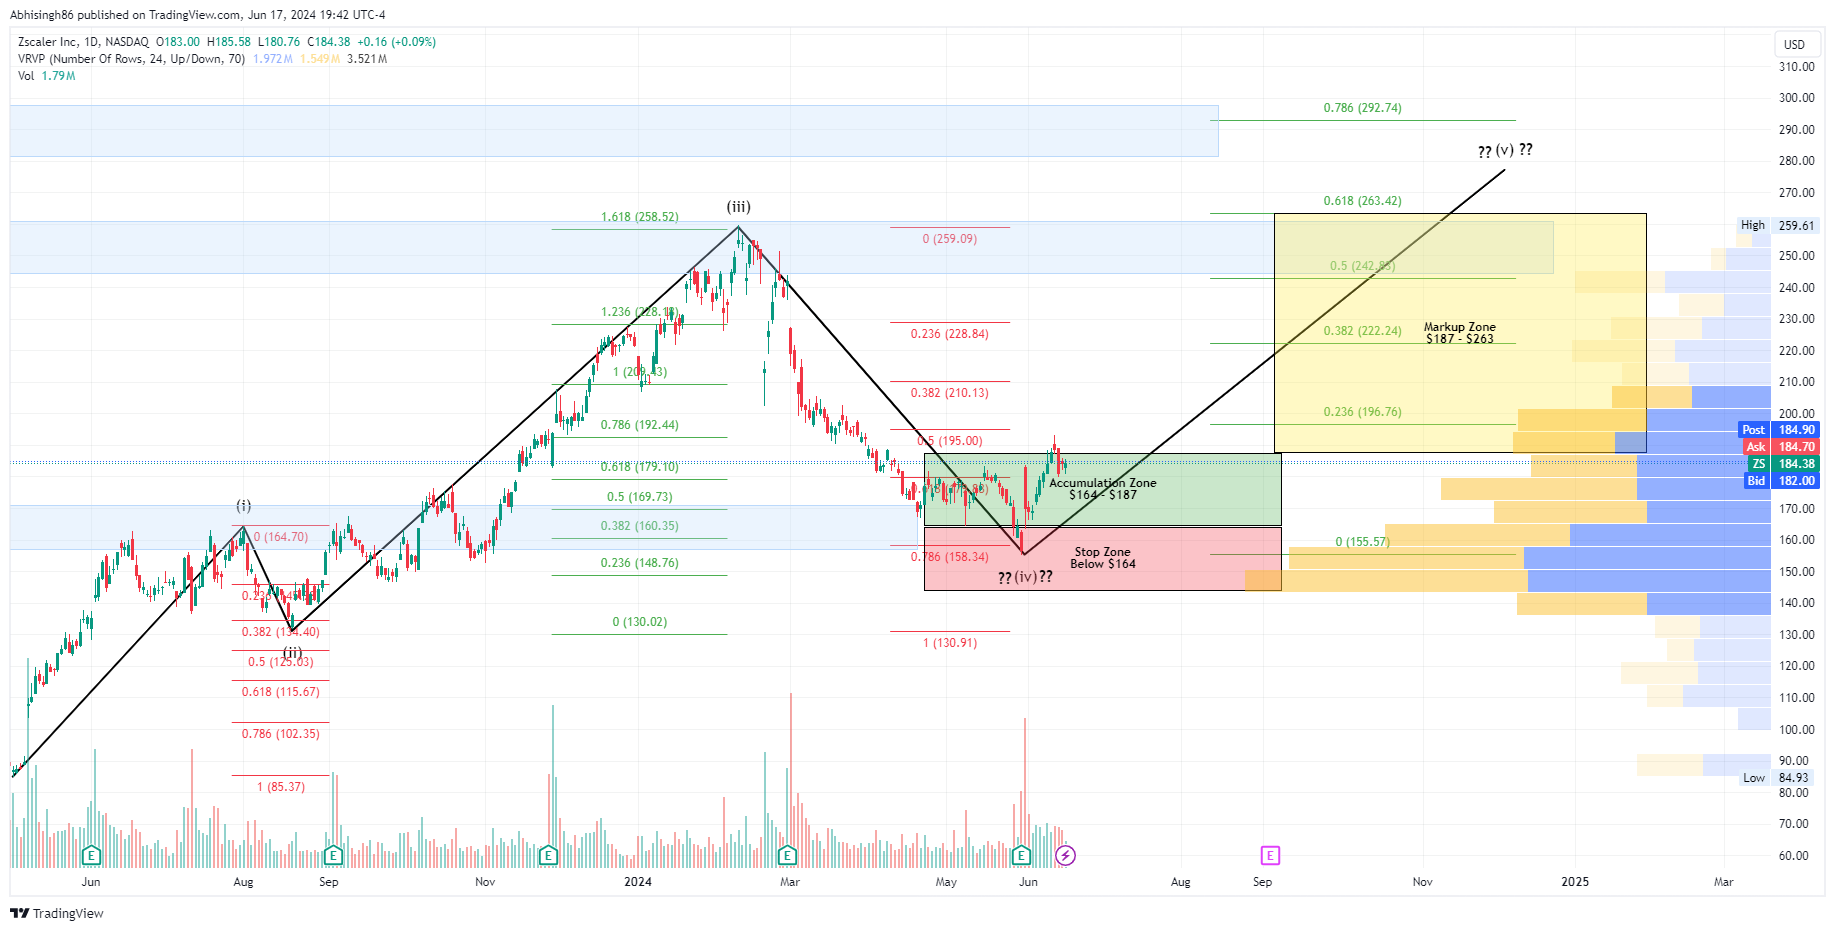
Alternate Technical analysis:
According to this chart, Zscaler stock put in an Elliot impulse Wave 1 from May’23 lows of $85 to highs of $164, followed by a shallow 38.2% retracement. The ensuing upward move is an impulse Wave 3, which may terminate at 1.618 extension of Wave 1, placed at Wave 2 low.
You can open the full page chart by clicking here.
Rating: Accumulate
· Accumulation Zone: $164- $187
· Markup Zone: $187 - $263
One may choose appropriate risk management strategies such as position sizing and/or using stops. A sensible stop-loss placement could be somewhere below the $164 mark.
A word about our charts
· The dollar limits within the Wyckoff zones serve as guidelines rather than strict rules. They aid in maintaining disciplined buying and selling decisions, removing emotional impulses from the equation. The idea is to identify where the bulk of buying (at the lows) and selling (at the highs) is taking place; this is an inexact science but it is a useful way of trying to track those Big Money breadcrumbs.
· The blue zones in the charts are the key support/resistance levels based on historical price action. We do not approach resistance and support levels as single $$ values. Instead, we view them as price action areas that need to be materially breached in either direction to confirm a trend.
· Zone boundaries may evolve over time, adjusted according to evolving price dynamics, Elliott wave analysis, Fibonacci levels, and volume-by-price data. Once the stock approaches the upper limit of the mark-up zone, we would revisit if the target price needs to be adjusted.
Resources to Learn How To Speak The Market (No Paywall)
1. How Big Money Creates Returns Out Of Thin Air
2. How To Speak Market, Episode II - Measuring Emotion
3. How To Speak Market, Episode III - Swimming With The Tide
4. How To Speak Market, Episode IV - Charts Speak Volumes
Questions?
If you have questions about any of the numbers, charts, anything, reach out in chat.
Cestrian Capital Research, Inc - 18 June 2024.
DISCLOSURE - Cestrian Capital Research, Inc staff personal accounts hold long position(s) in $ZS.