
Market When Closed, Sunday 26 January

DISCLAIMER: This note is intended for US recipients only and, in particular, is not directed at, nor intended to be relied upon by any UK recipients. Any information or analysis in this note is not an offer to sell or the solicitation of an offer to buy any securities. Nothing in this note is intended to be investment advice and nor should it be relied upon to make investment decisions. Cestrian Capital Research, Inc., its employees, agents or affiliates, including the author of this note, or related persons, may have a position in any stocks, security, or financial instrument referenced in this note. Any opinions, analyses, or probabilities expressed in this note are those of the author as of the note's date of publication and are subject to change without notice. Companies referenced in this note or their employees or affiliates may be customers of Cestrian Capital Research, Inc. Cestrian Capital Research, Inc. values both its independence and transparency and does not believe that this presents a material potential conflict of interest or impacts the content of its research or publications.
Fear Or Lack Thereof
by Alex King, CEO, Cestrian Capital Research, Inc
This is the chart I am watching most closely right now. This is the Vix index which is variously described as !!OMG THE FEAR INDEX!! (on CNBC) or a measure of demand for longer-dated S&P500 puts (Brains Trust aka. Jay Urbain - here).
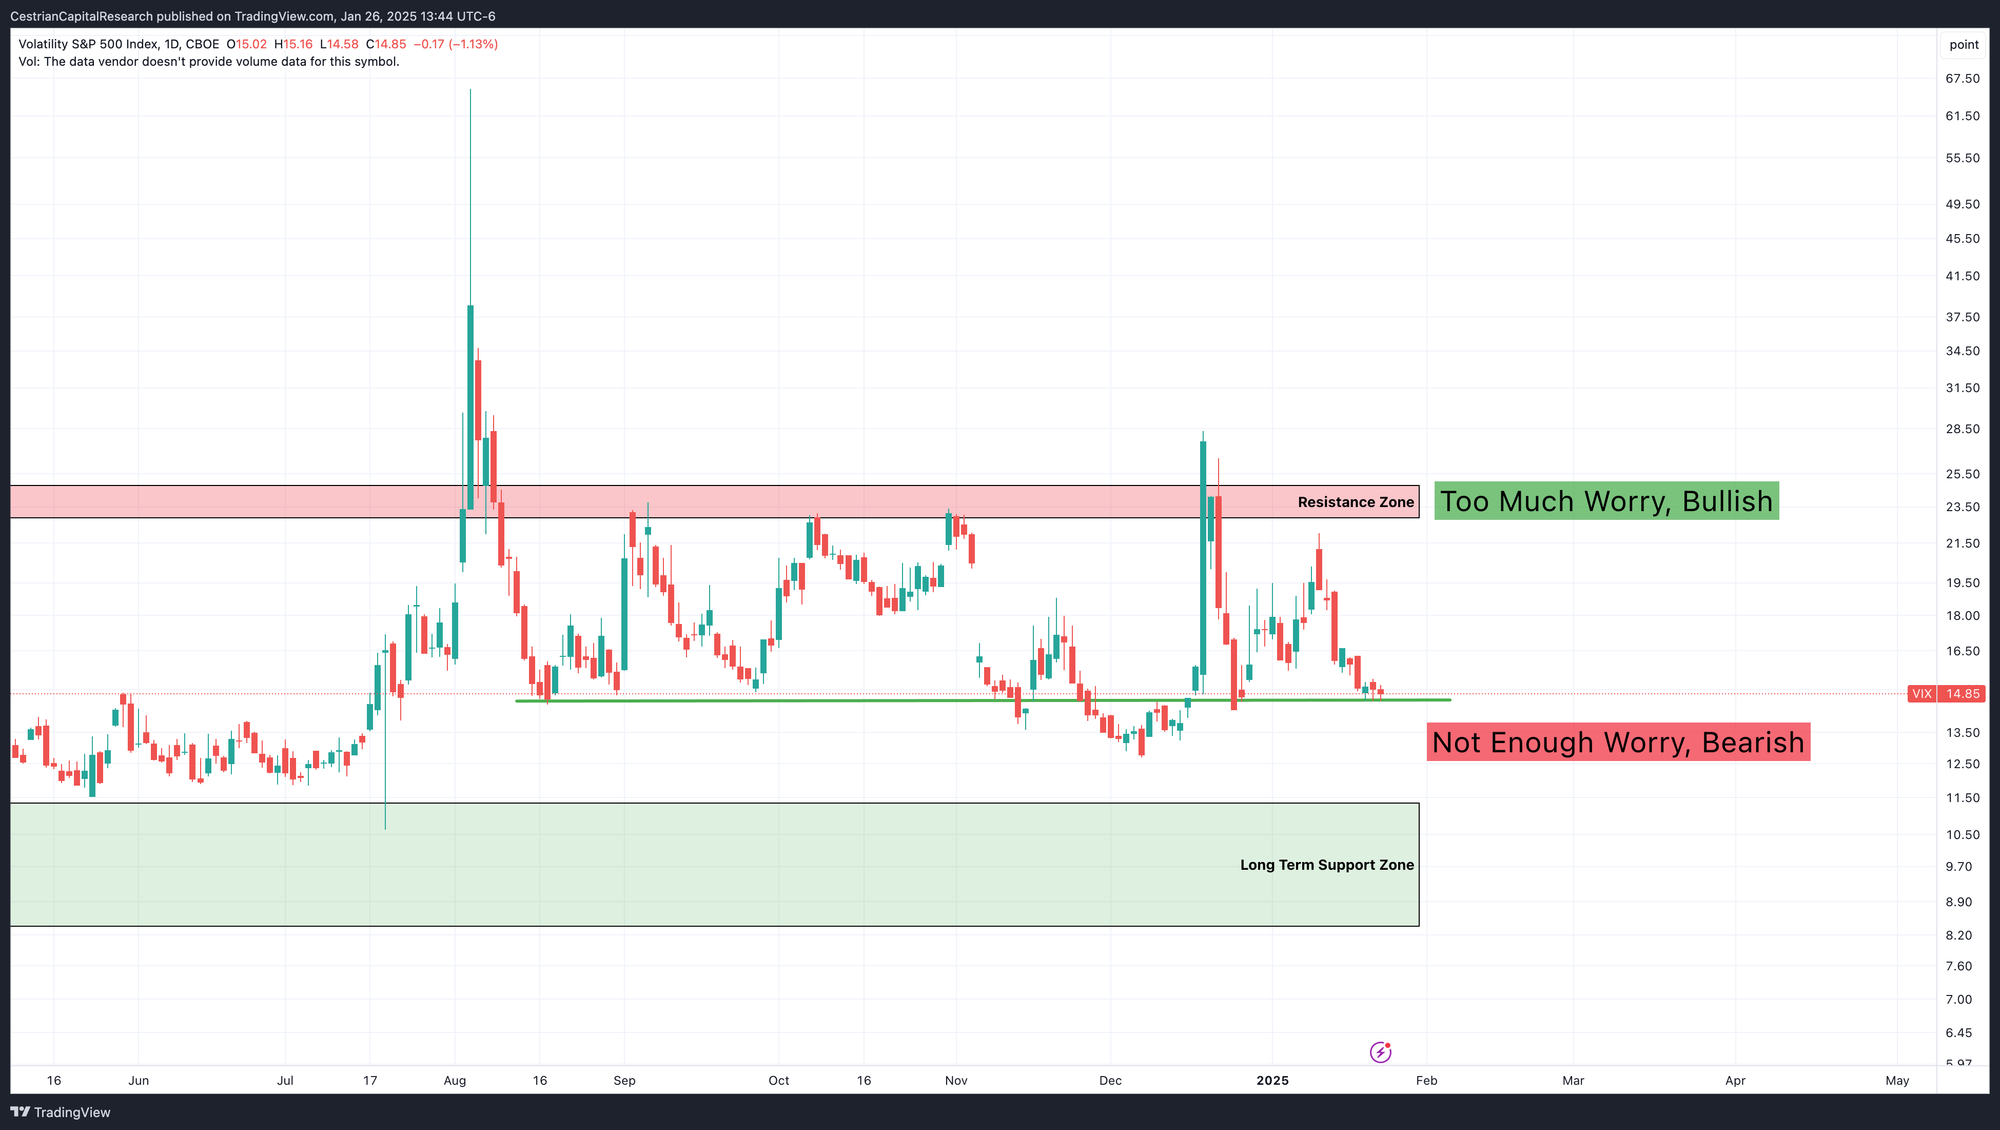
(You can open a full page version of this chart, here.)
You can trade Vix instruments themselves, and that's OK (I am presently long $UVIX and also long $UVXY calls, with modest allocations in each case), but I find a more effective way to benefit from Vix oscillations is to wait for one of those spikes - either up to that horizontal resistance zone in red, or, better, one of those Yikes Cat moments like August or December last year, make sure you are staring at charts and not listening to the vomit-y feeling that lives somewhere in your brain-liver-gut-axis, and buy something scary like $TQQQ or $SOXL or just plain ole $QQQ. Then wait for the volatility to drop, or, better, a volatility crush, and sell. Much nicer returns that way than trying to win from volatility pops which in my experience are unsatisfactory affairs.
The long-term charts in equity indices look reasonably positive to me but we are hovering below technical levels that could mark long-term reversal levels so I believe one has to watch carefully at present. Large, price-setting institutional investors have made easy money since they were accumulating the S&P, the Nasdaq and anything else that the poors had been scared away from during Q2-Q4 2022. So if things start looking shaky you can bet they won't shy away from taking some of those gains, the better to look smart with clients.
Let's get to work. But before we do, a word from Gains about, er, gains.
Bull Or Bear, Gains Doesn't Care
I invite you to take a 7-day free trial to our Trading Gains service. The eponymous Gains is a fearless analyst and trader who runs his own capital live in this service. Trading Gains is set up to target profitable swing trade opportunities in liquid ETFs and options, covering equity indices, commodities, bonds and more. His work has proven profitable in bull and bear market conditions. Each personal account trade is posted live in the service; plus which you'll see extensive trader education material and a superb community of members.
Click here to sign up for your free trial.
Well, those charts won't draw themselves (yet - when AI nails this I plan to play more golf. Or at least learn to play golf. Maybe).
Short- And Medium-Term Market Analysis
If you want this daily dose of pattern recognition, and you aren’t yet a subscriber of course, you can read about and choose from all the subscription services that include this note, here.