
Market When Closed, Sunday 20 April
DISCLAIMER: This note is intended for US recipients only and, in particular, is not directed at, nor intended to be relied upon by any UK recipients. Any information or analysis in this note is not an offer to sell or the solicitation of an offer to buy any securities. Nothing in this note is intended to be investment advice and nor should it be relied upon to make investment decisions. Cestrian Capital Research, Inc., its employees, agents or affiliates, including the author of this note, or related persons, may have a position in any stocks, security, or financial instrument referenced in this note. Any opinions, analyses, or probabilities expressed in this note are those of the author as of the note's date of publication and are subject to change without notice. Companies referenced in this note or their employees or affiliates may be customers of Cestrian Capital Research, Inc. Cestrian Capital Research, Inc. values both its independence and transparency and does not believe that this presents a material potential conflict of interest or impacts the content of its research or publications.
It Is What It Is
by Alex King, CEO, Cestrian Capital Research, Inc
Until such time as the tariff regime is settled, it’s hard to form a view on the medium-term direction of stocks, bonds or commodities. Too many unknown unknowns. Shorter term, it’s possible to trade stocks, bonds, commodities and everything else based on our old friend technical analysis.
Let’s check in and see where markets stand as we head towards the Asia monday morning opening of futures trading.
Before we do - a word from Robot Central.
Emotional Rescue
Our SignalFlow AI family of quantitative signal services are the best antidote to Microbiome Investing that I have yet found.
Here’s three testimonials we received after the current market turmoil began.
- "I am wildly thrilled with SignalFlow AI for $SPY! I have been following the signals and moved almost completely to cash with the most recent change to risk off. Absolutely incredible for me, mentally and financially. Thanks so much to the team for developing this service.” - April 2025
- “The long/short service paid for itself in one day overnight by the way! Thankyou.” - April 2025
- “Rather than a day that could have ruined the weekend, I was able to watch the market tank knowing that I had the knowledge to weather the storm and come out far ahead.” - April 2025
The latest SignalFlow service provides long/short signals for the S&P500 and Nasdaq-100. This is a very easy to use service running on a quantitative model; complex below the waterline, simple above it. This is pure machine logic driven by price alone, not by the news, not by narrative, not by fear or greed.
Please do take a moment to read about what I believe to be a truly excellent family of services - here.

Short- And Medium-Term Market Analysis
If you want this daily dose of pattern recognition, and you aren’t yet a subscriber of course, you can read about and choose from all the subscription services that include this note, here.
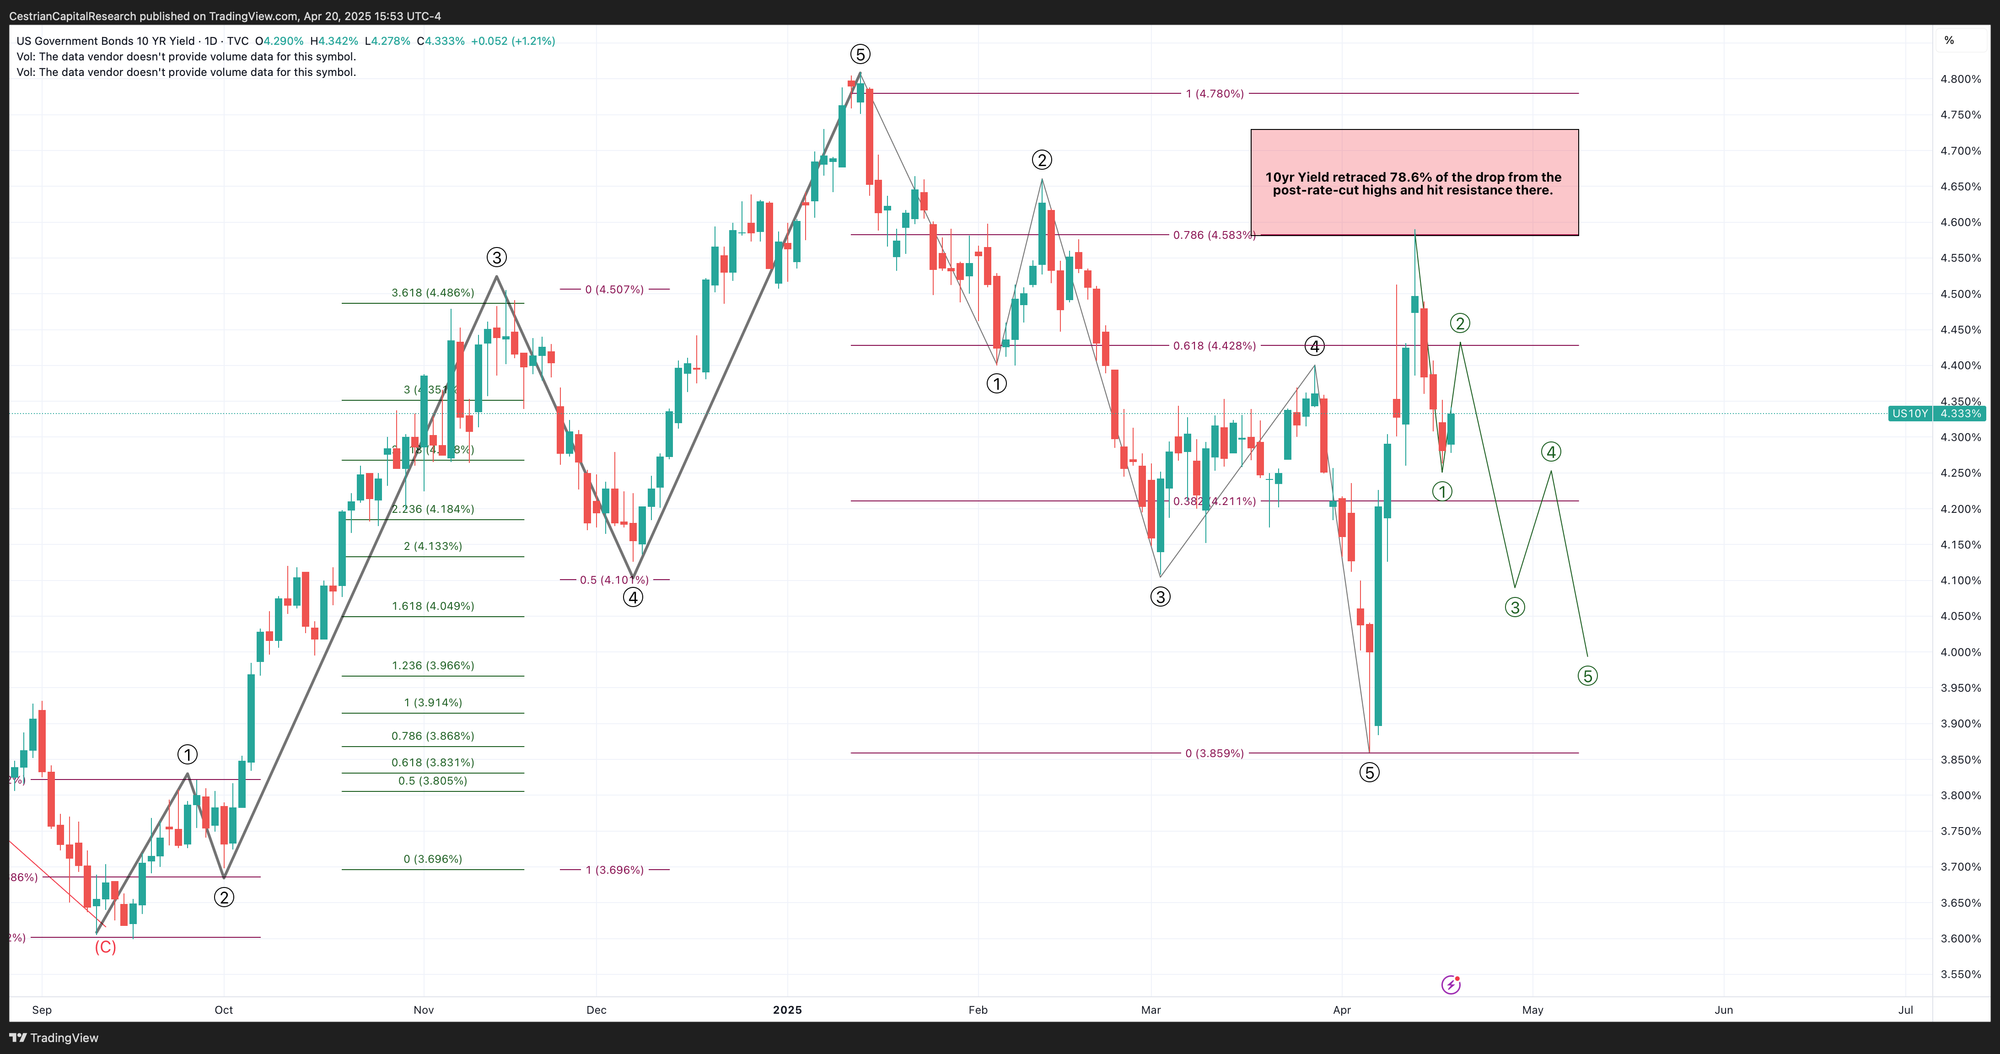
US 10-Year Yield
The bond market holds the whip hand right now. It has been bond market turbulence that has applied pressure to the Administration, not the equity market. The Fed has indicated it is in no rush to cut rates and, further, that it is concerned about resurgent inflation. Charting the course of the 10yr yield is the best way I know to get a high-level sense of what the bond market thinks about the economic outlook in the coming months.
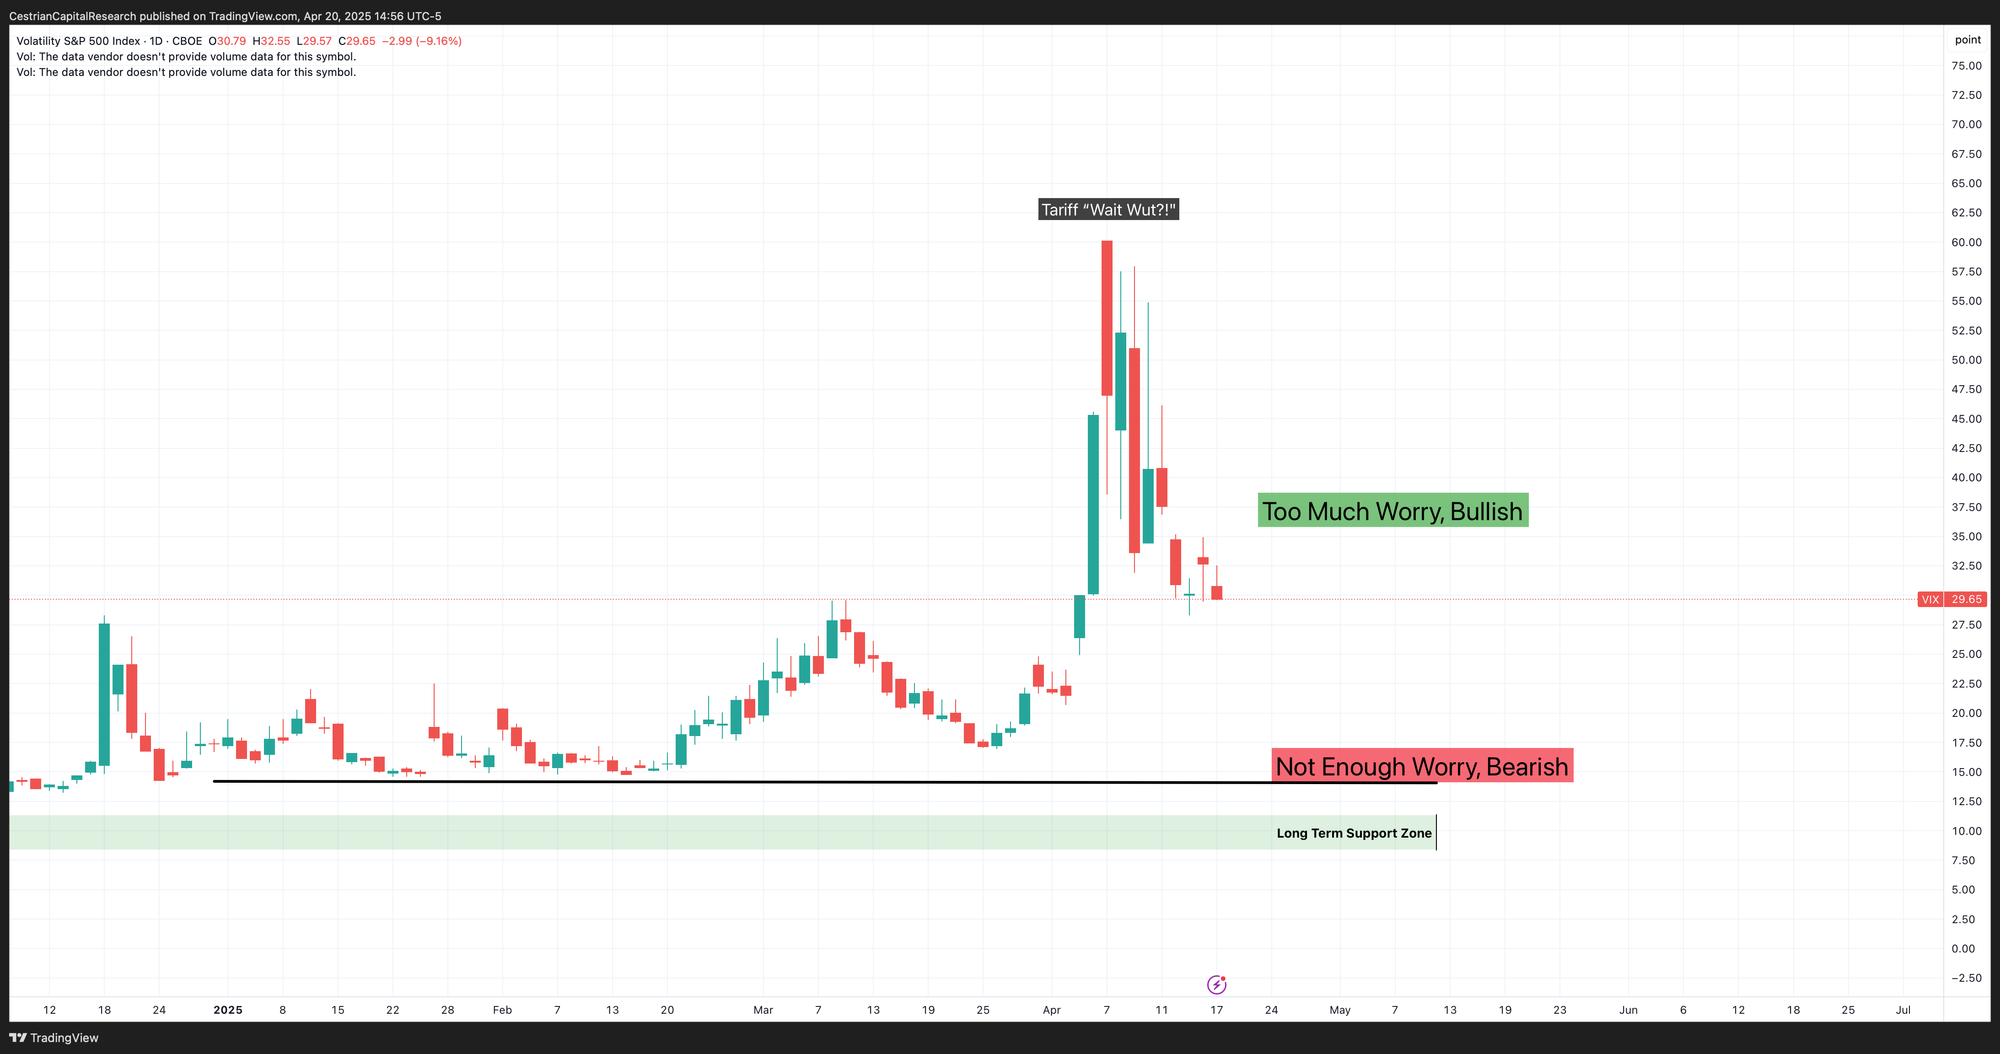
Equity Volatility
Volatility is unlikely to drop back to the pre-2025 range in my view. Elevated volatility is the new normal I believe.
Disclosure: No position in volatility-linked securities.
Now, for our paying subscribers we move on to bonds, the S&P500, the Nasdaq, the Dow, and key sectors.
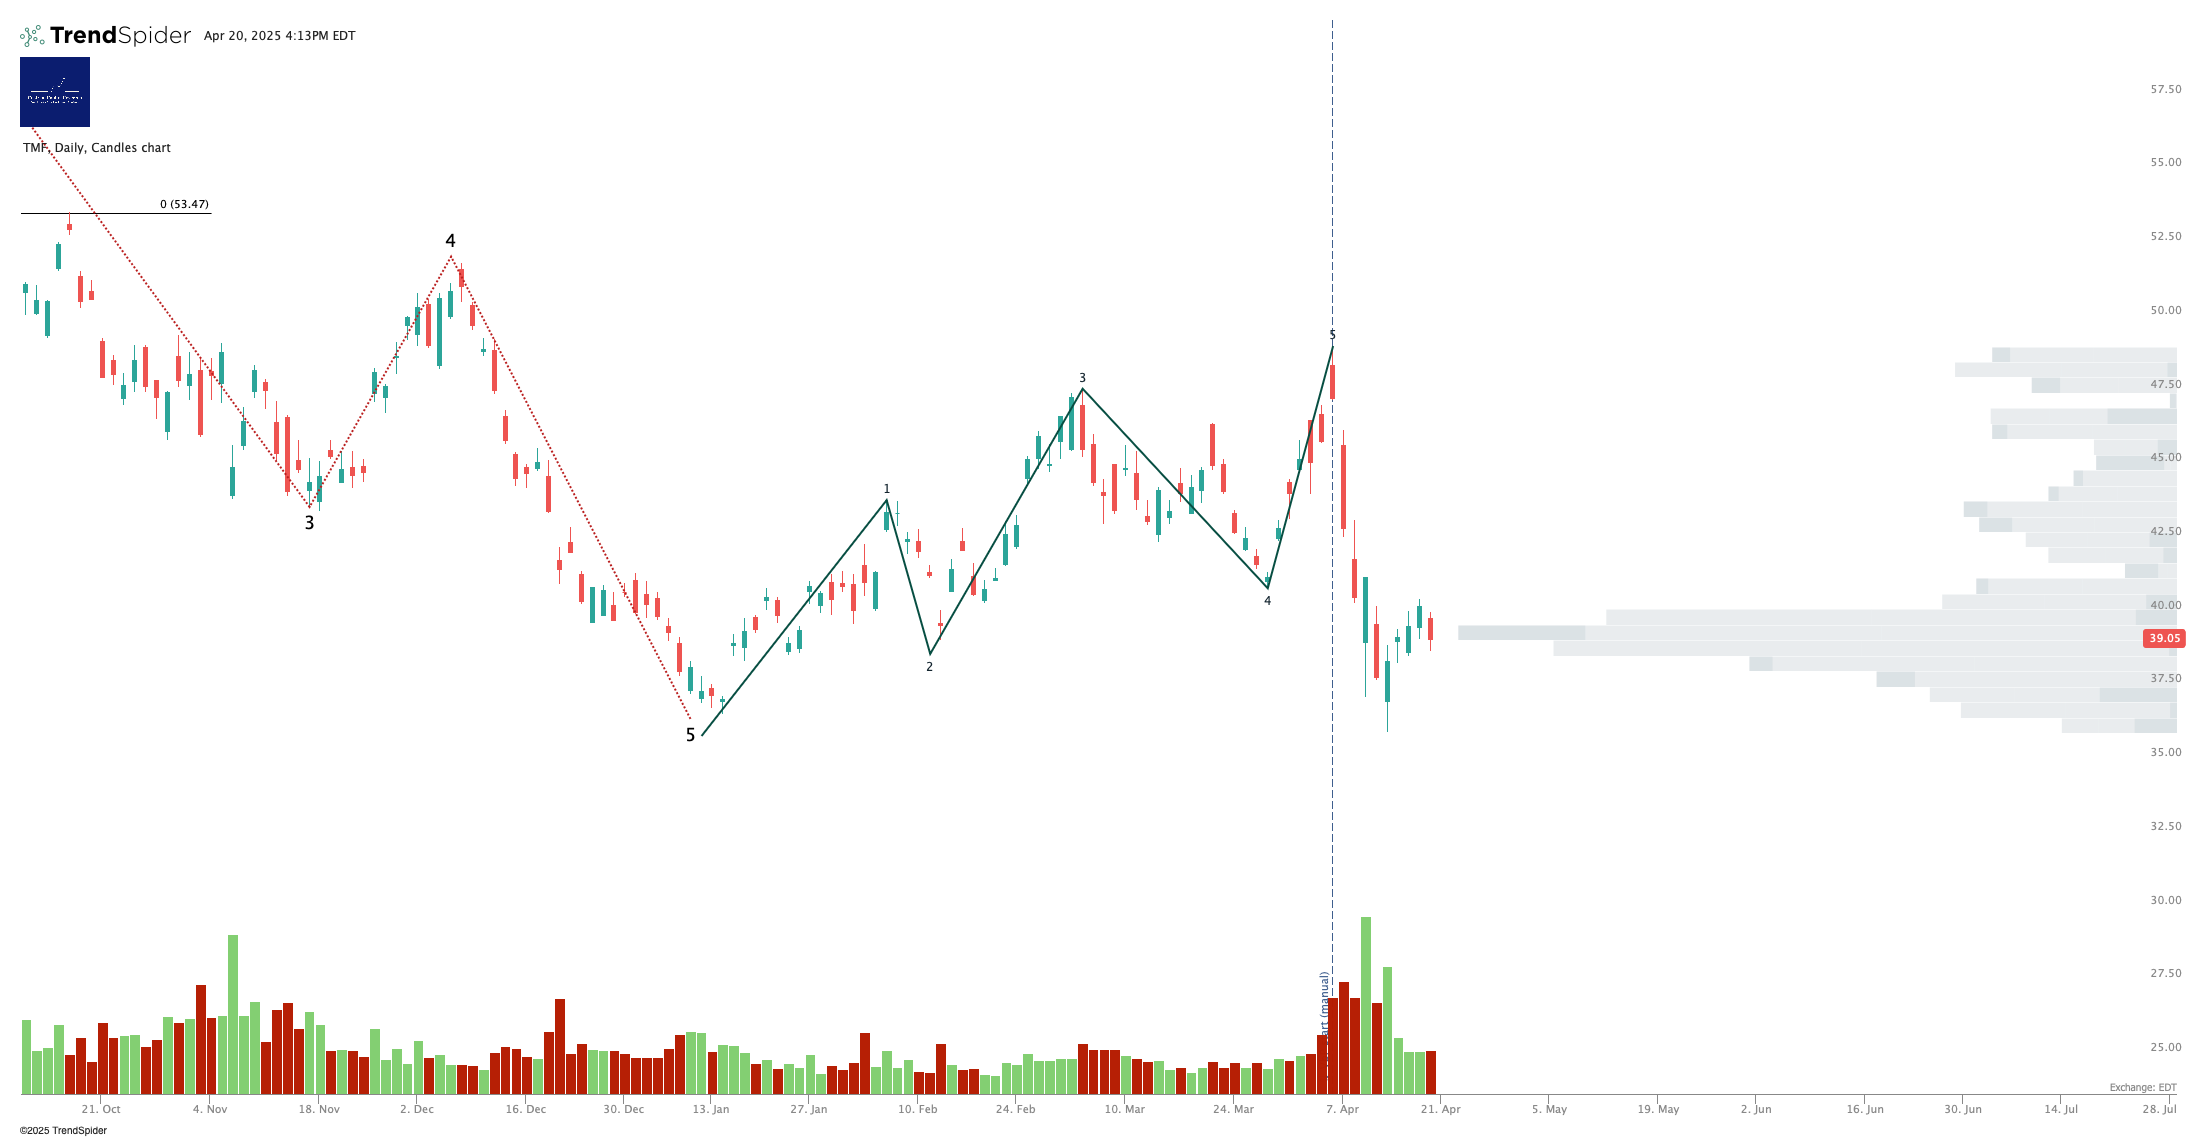
Longer-Term Treasury Bonds (TLT / TMF)
TLT continues to languish at the lows; the volume down here is considerable and until proven otherwise I believe that to have been accumulation.
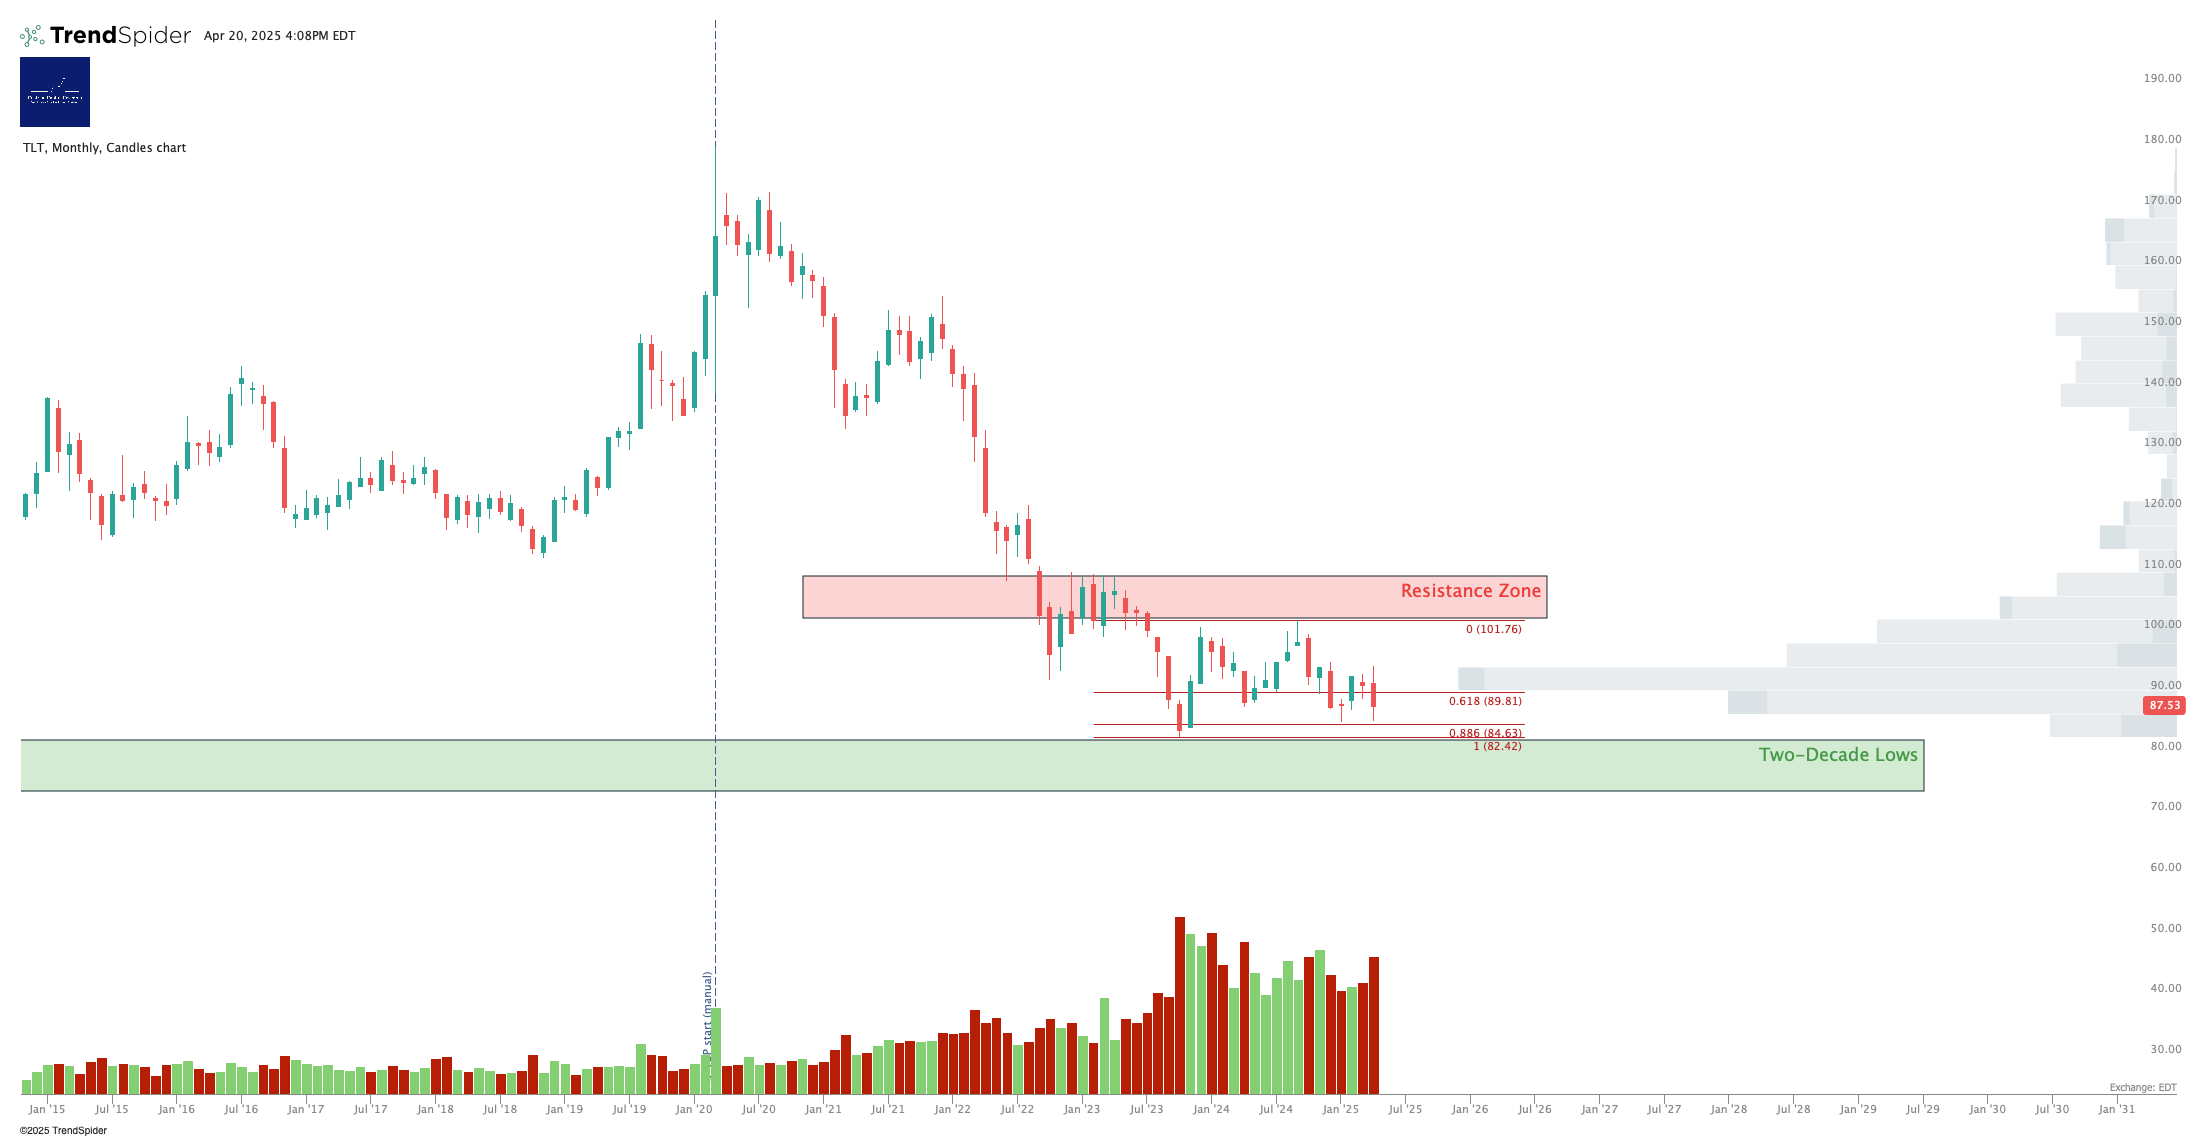
A little further yet to fall in this current Wave 2 down, I would expect.
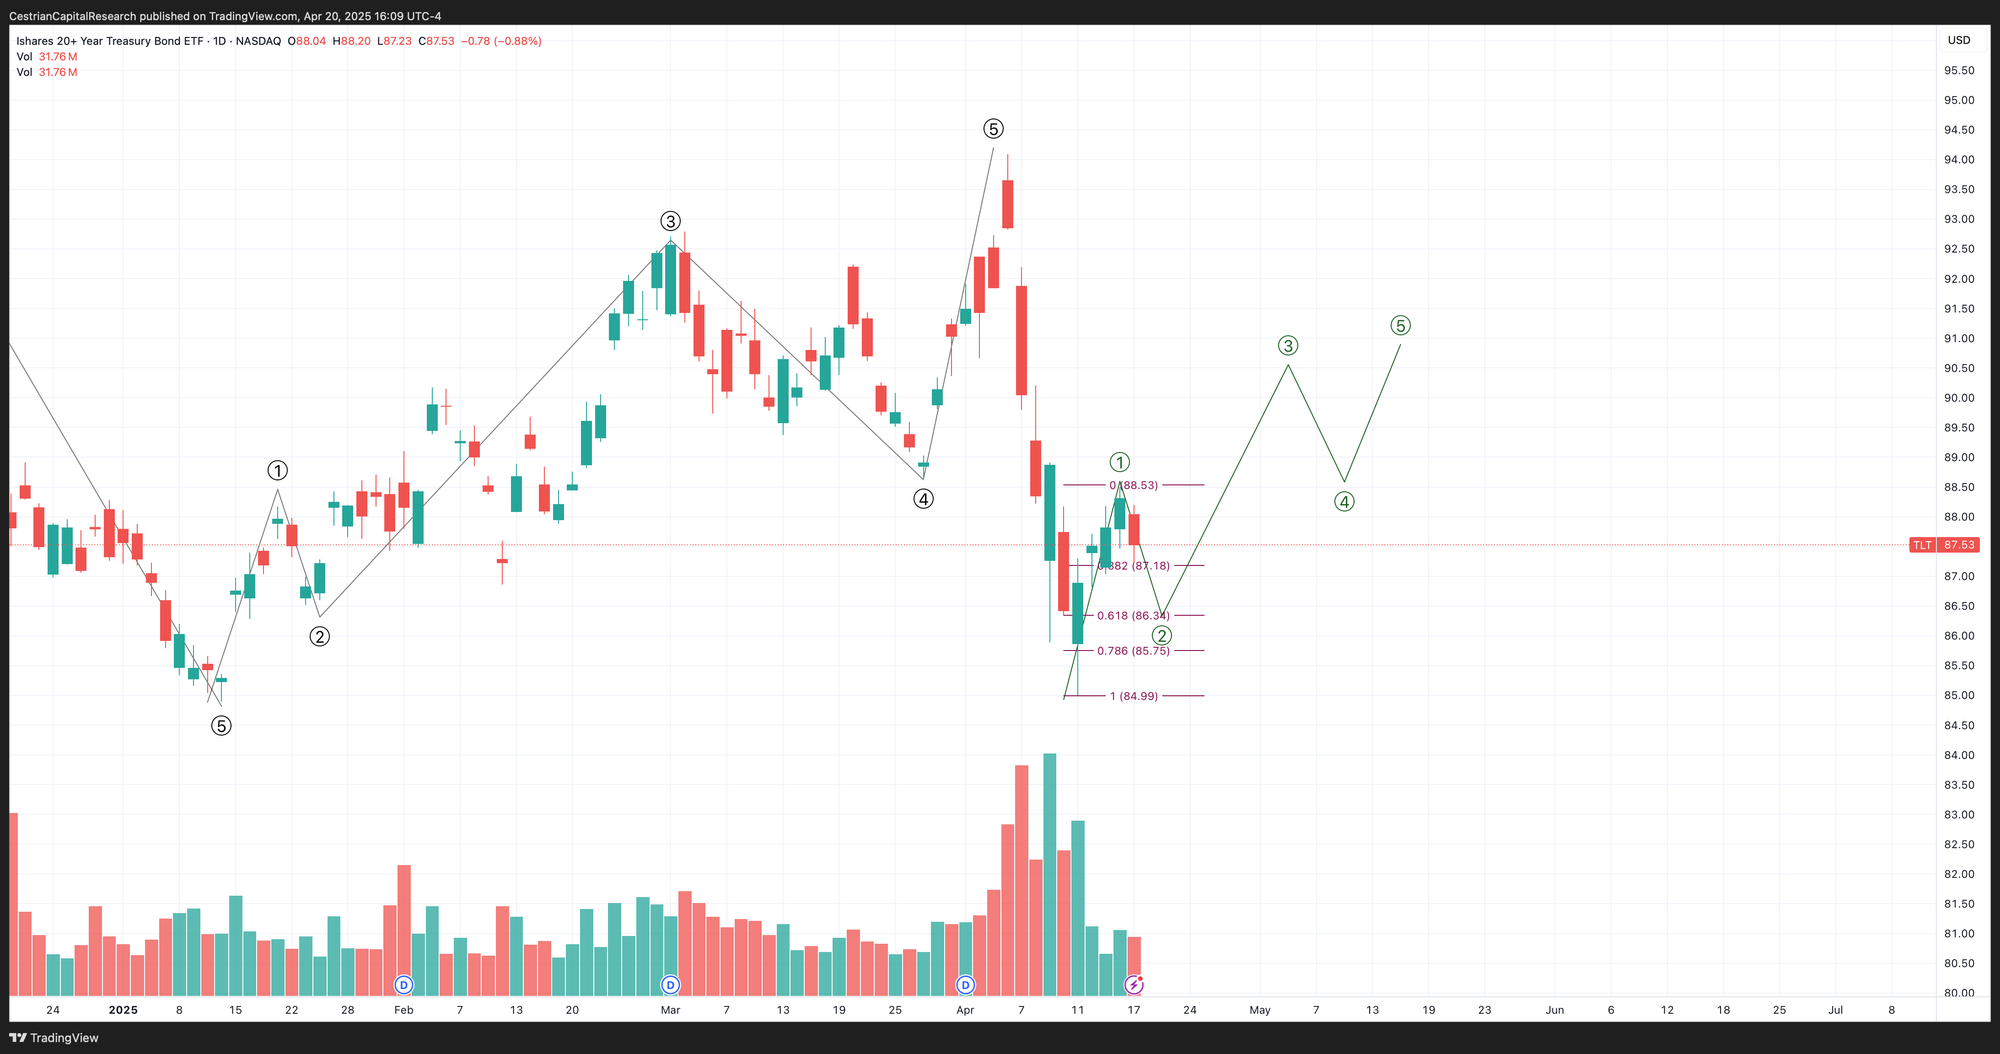
Note - Leveraged ETF. Read the fund documentation if you are considering using this instrument.
With any sensible tariff policy settlement I would expect substantial upside for TLT and therefore for TMF too.
Disclosure: I am unhedged long $TLT and similar EU UCITS ETFs.
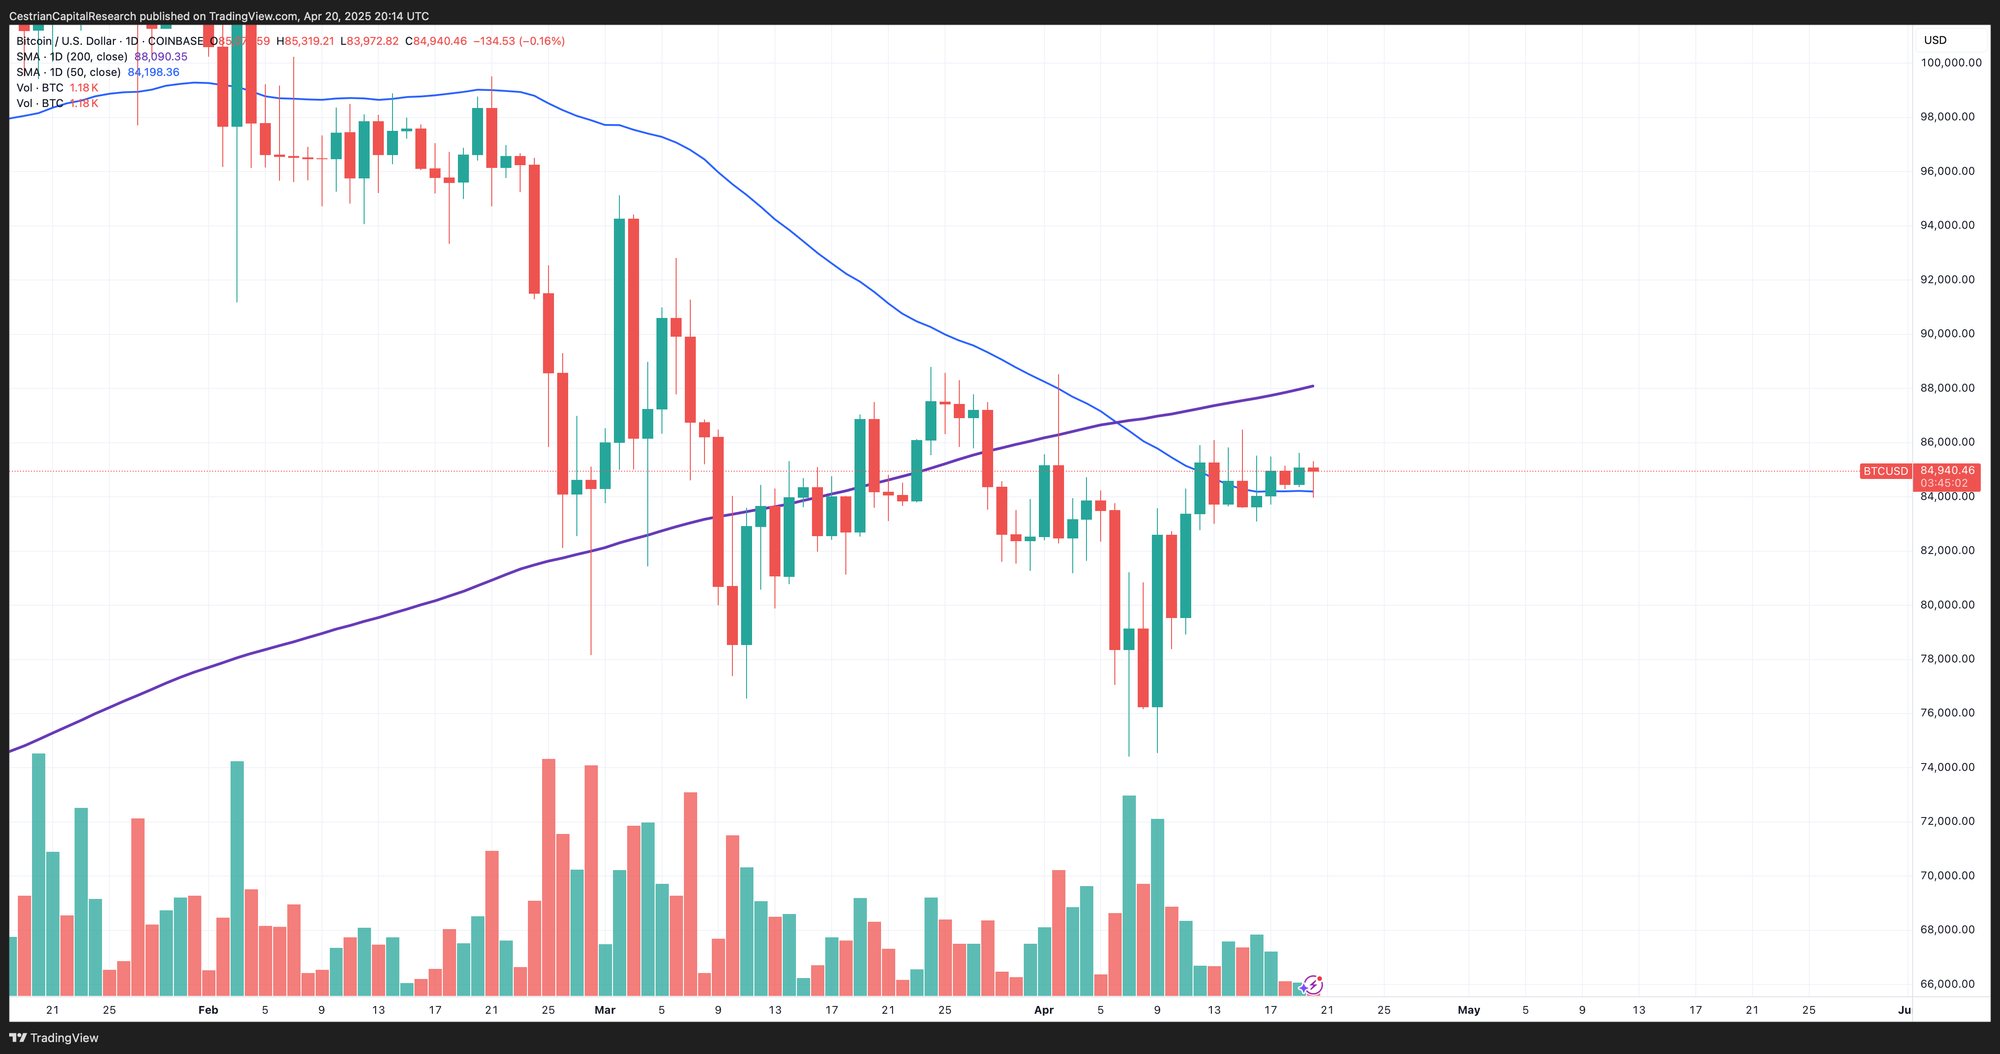
Bitcoin
This is about the most bullish chart around I think in risk assets. Bitcoin is up and over its 50-day moving average, which is an upward sloping line now. The 200-day is overhead but at least that too is upward sloping. If Bitcoin gets up and over its 200 day and turns that into support, look for other risk assets to follow it up.
Disclosure - I am long $IBIT personally.
Now read this on Bitcoin. NOTE we will be launching a Bitcoin-specific service soon - we’ll let you know when it’s live.
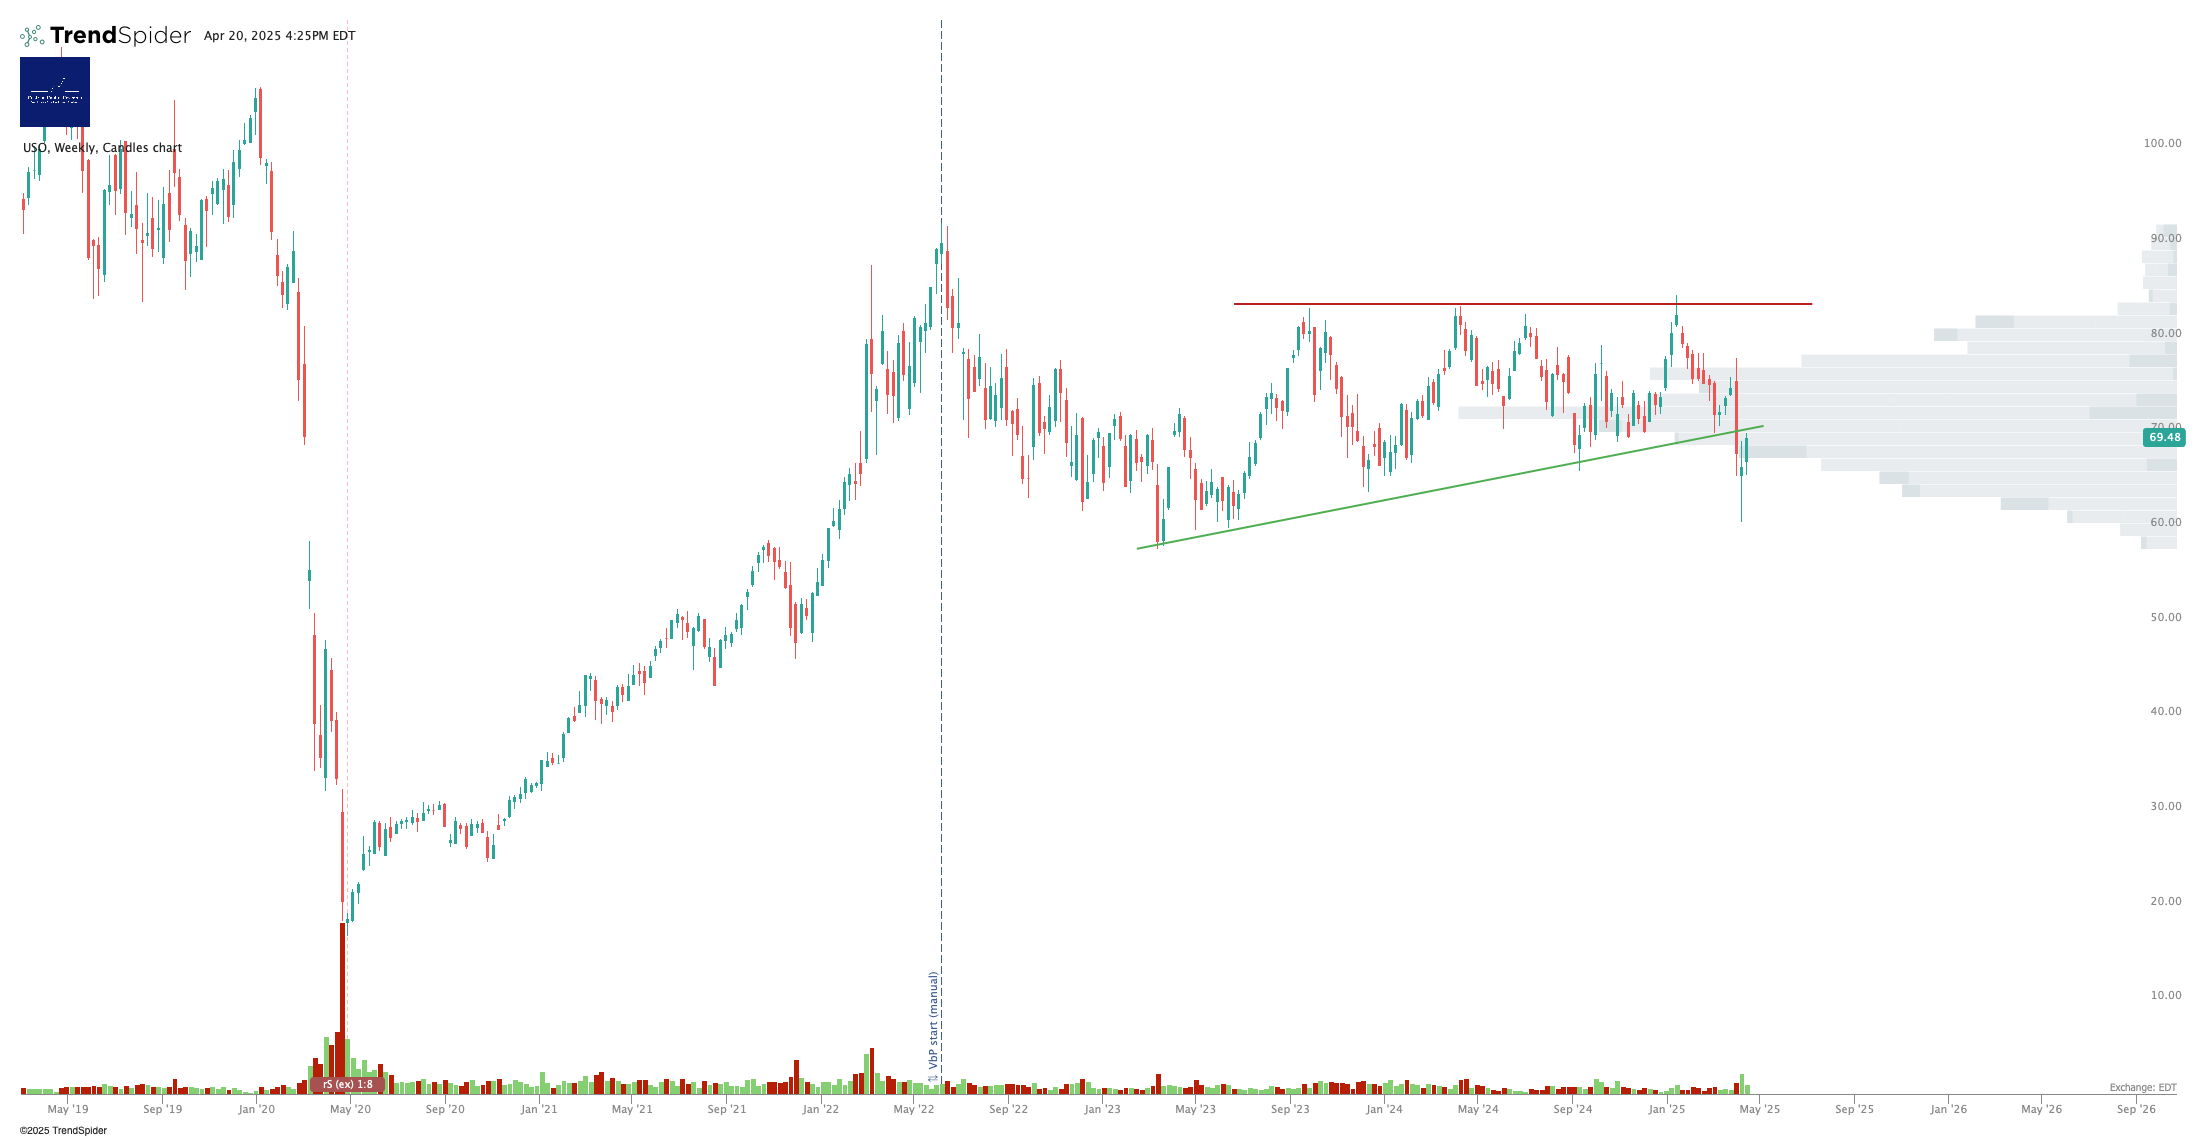
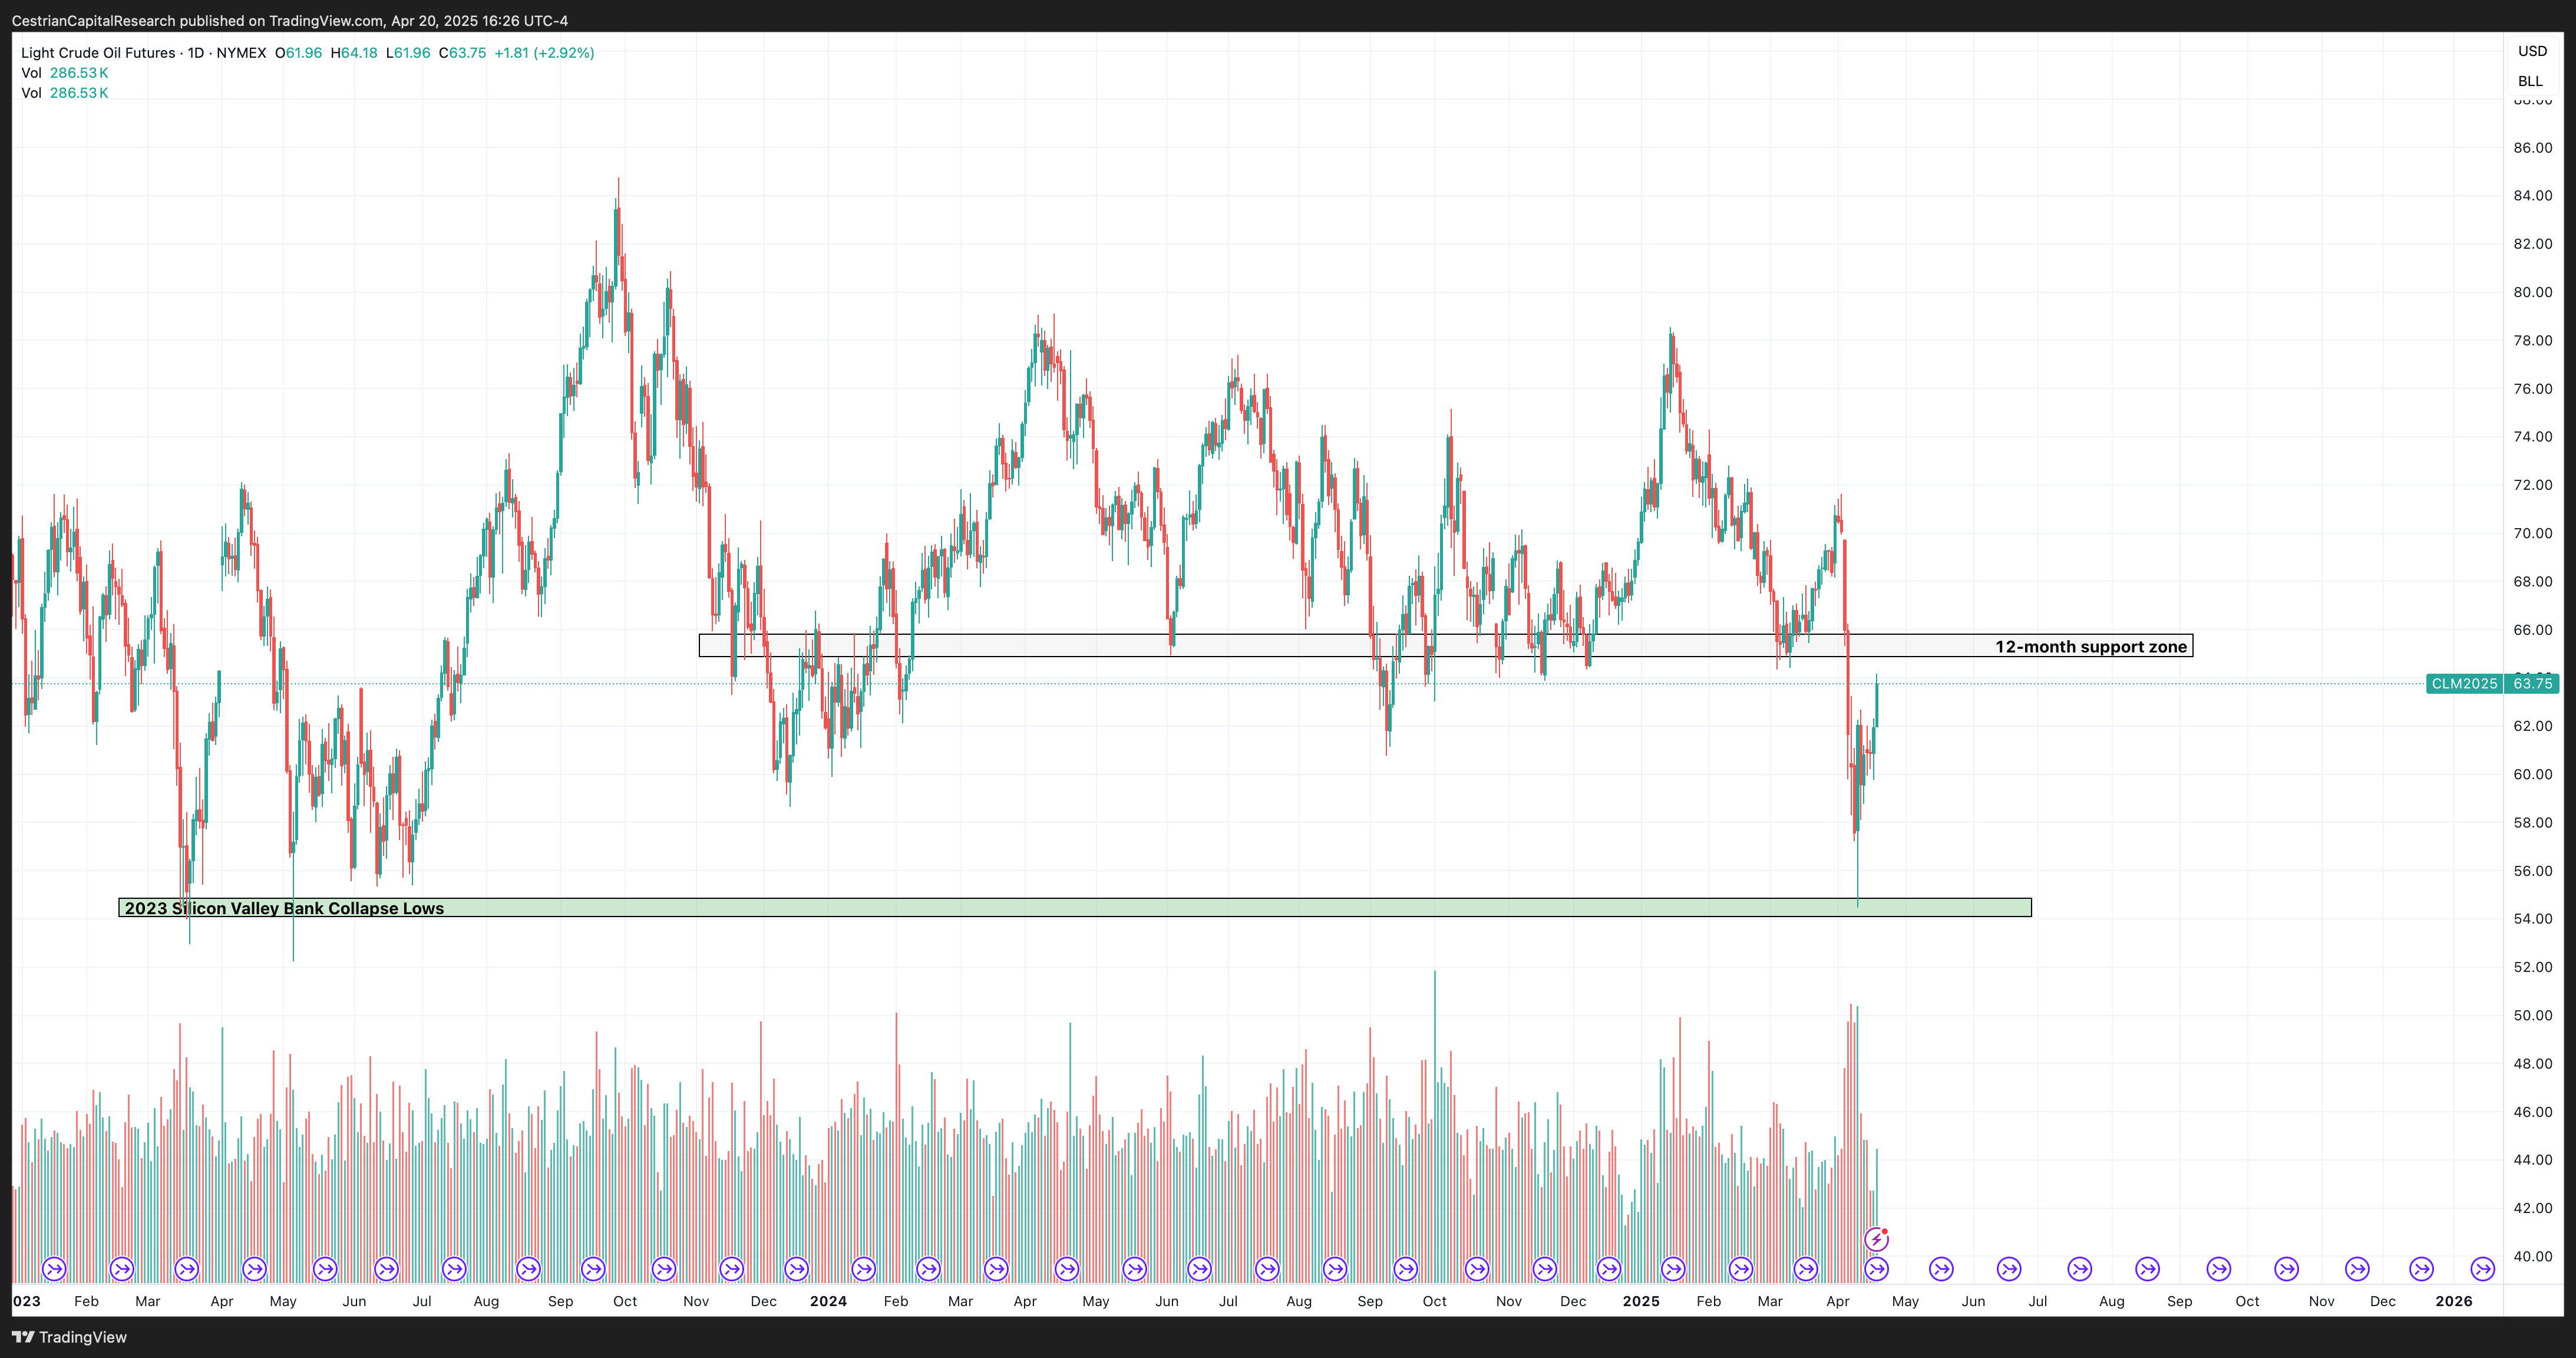
Oil (USO / WTI / UCO)
Oil prices are trying to normalize after a one-time shock in recent weeks.
A different way of viewing the same issue:
Note - Leveraged ETF. Read the fund documentation if you are considering using this instrument.
All these oil charts say the same thing - pricing trying to normalize back into the recent range.
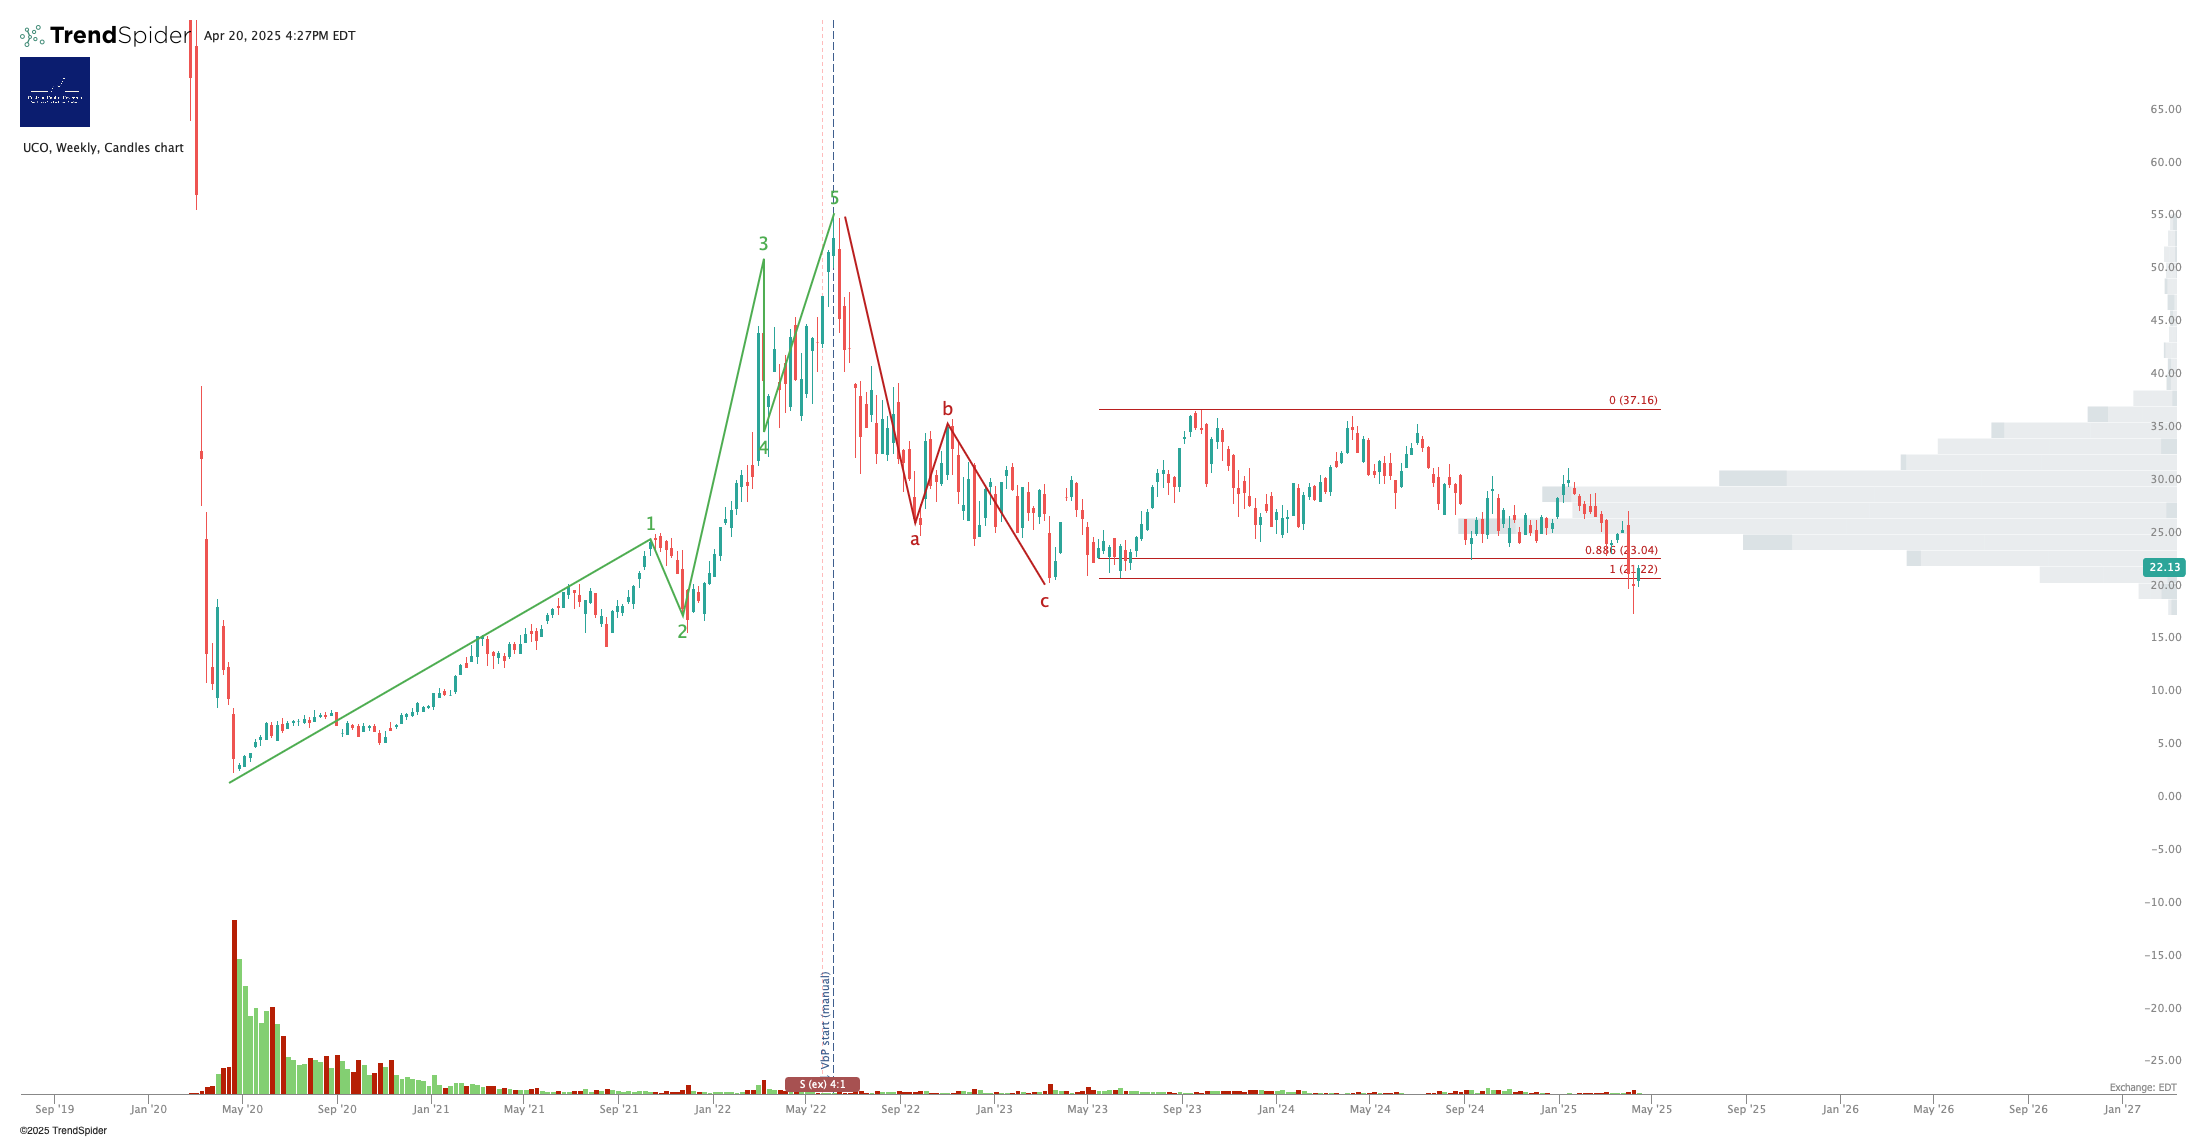
Disclosure: I am unhedged long $USO.
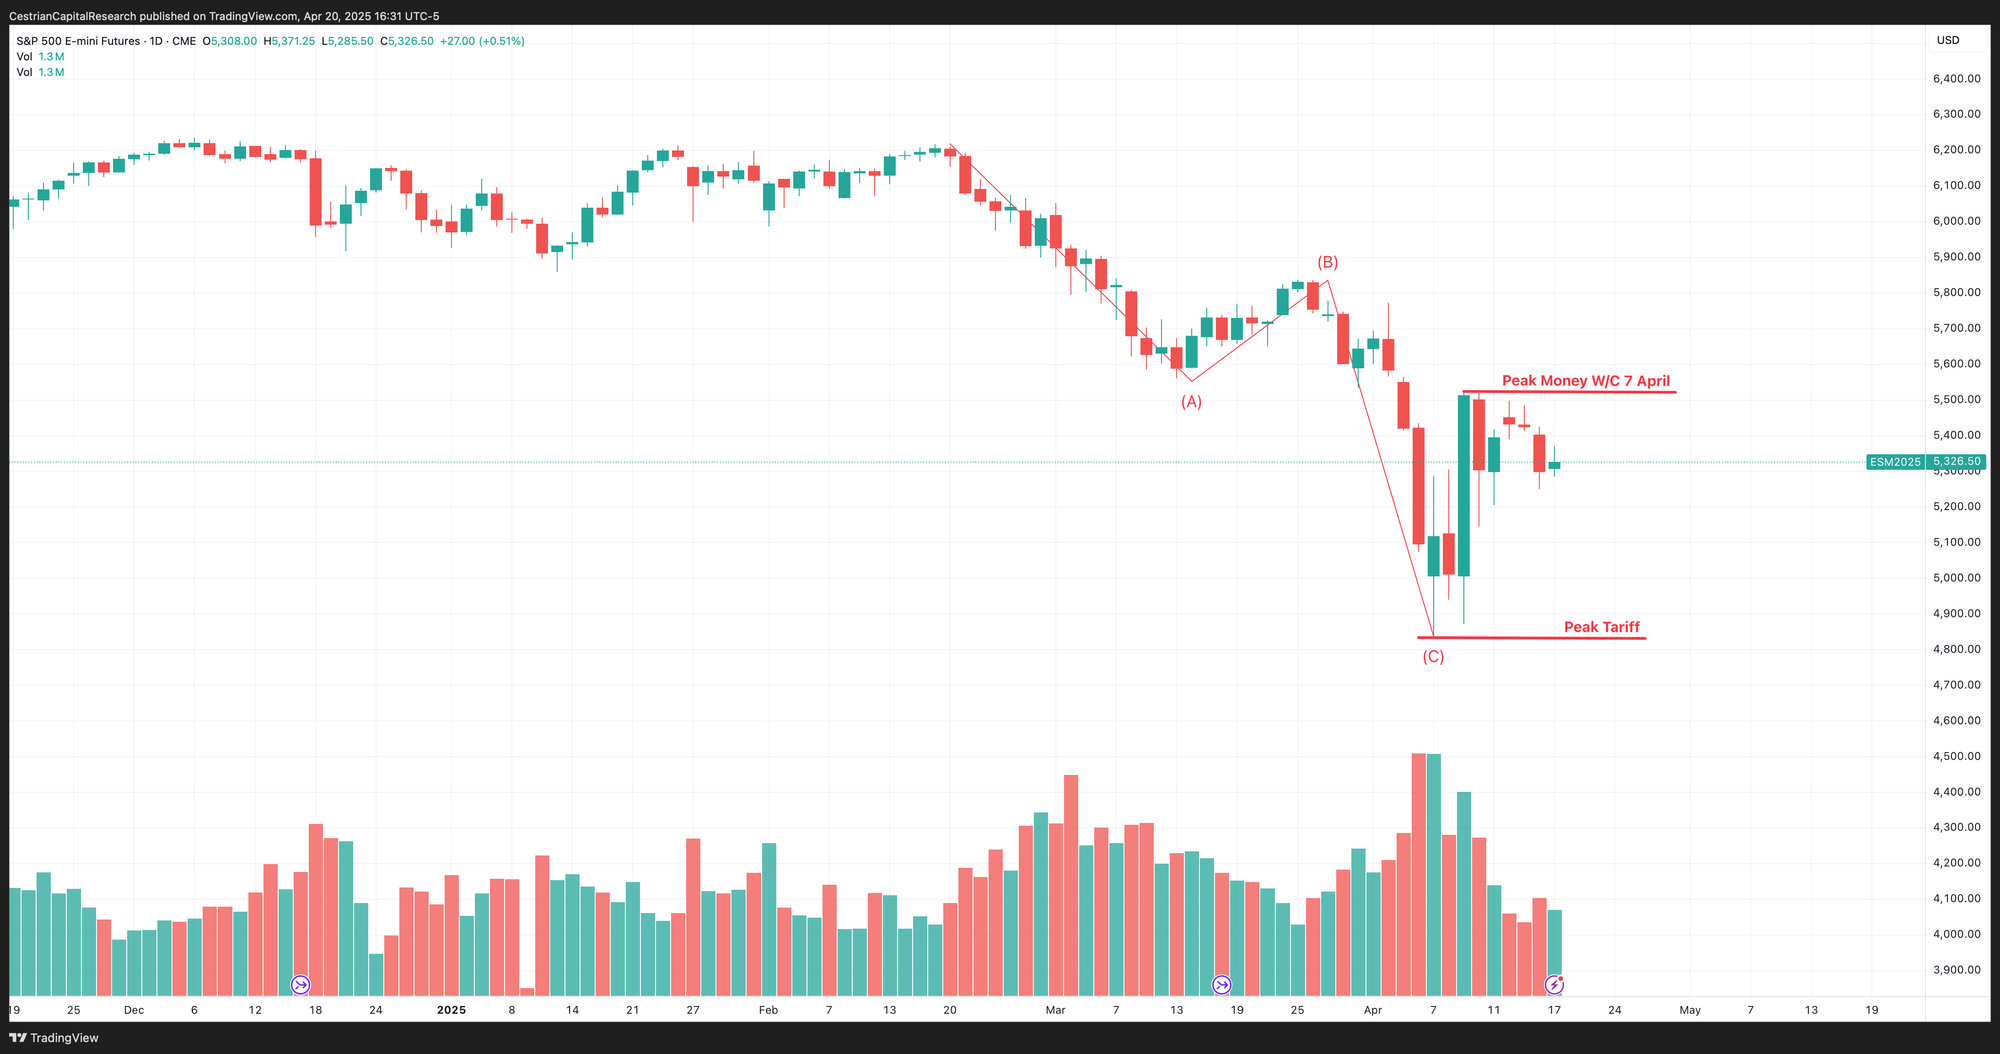
S&P500 / SPY / ES / UPRO
Even more so than usual, the short term trumps the long term for now.
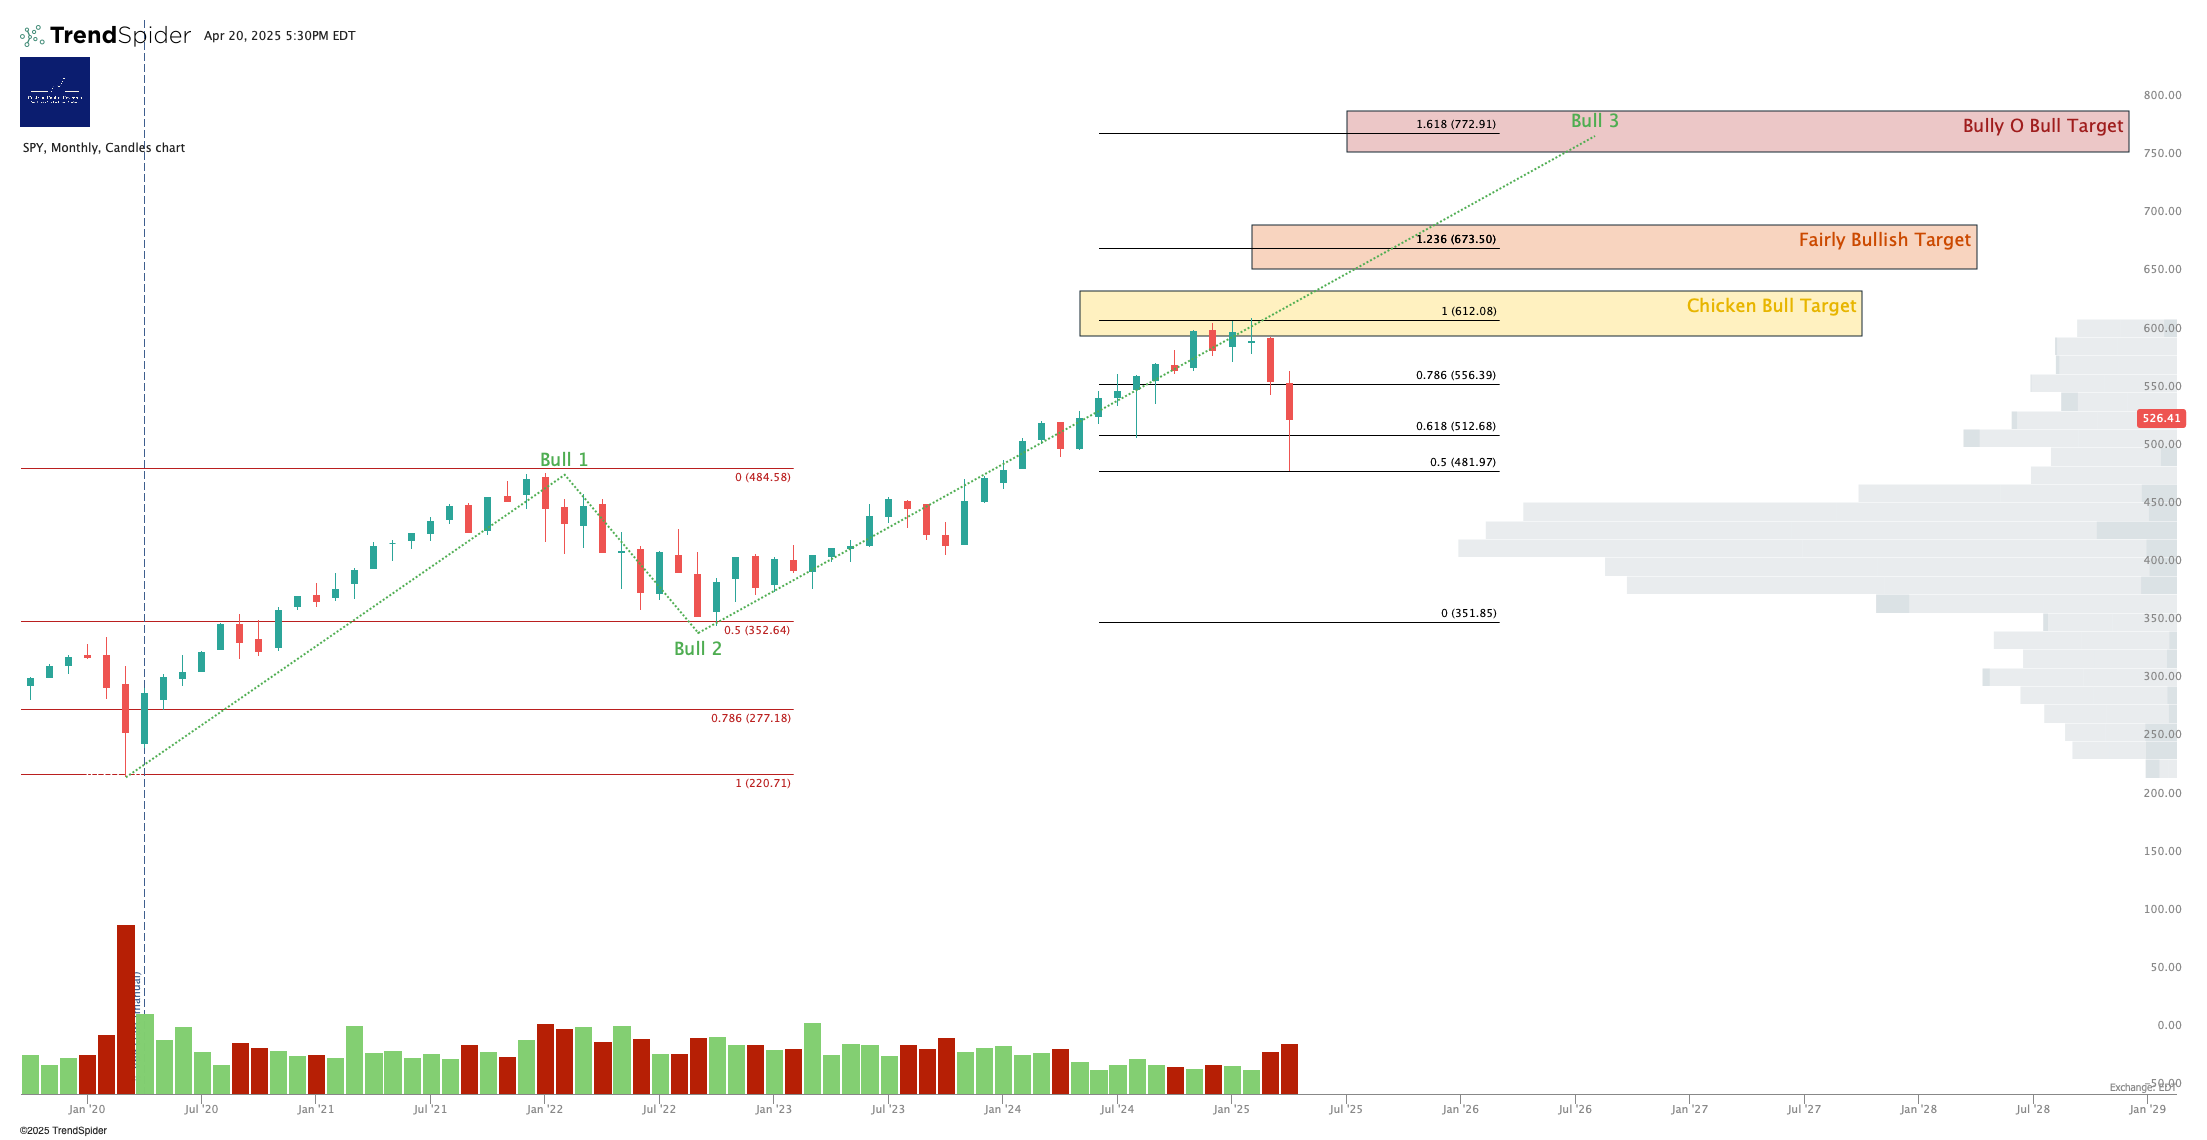
Here’s where we stand on the ideas vs. money spectrum.
Note - Leveraged ETF. Read the fund documentation if you are considering using this instrument.
Climbing the ladder, for now.
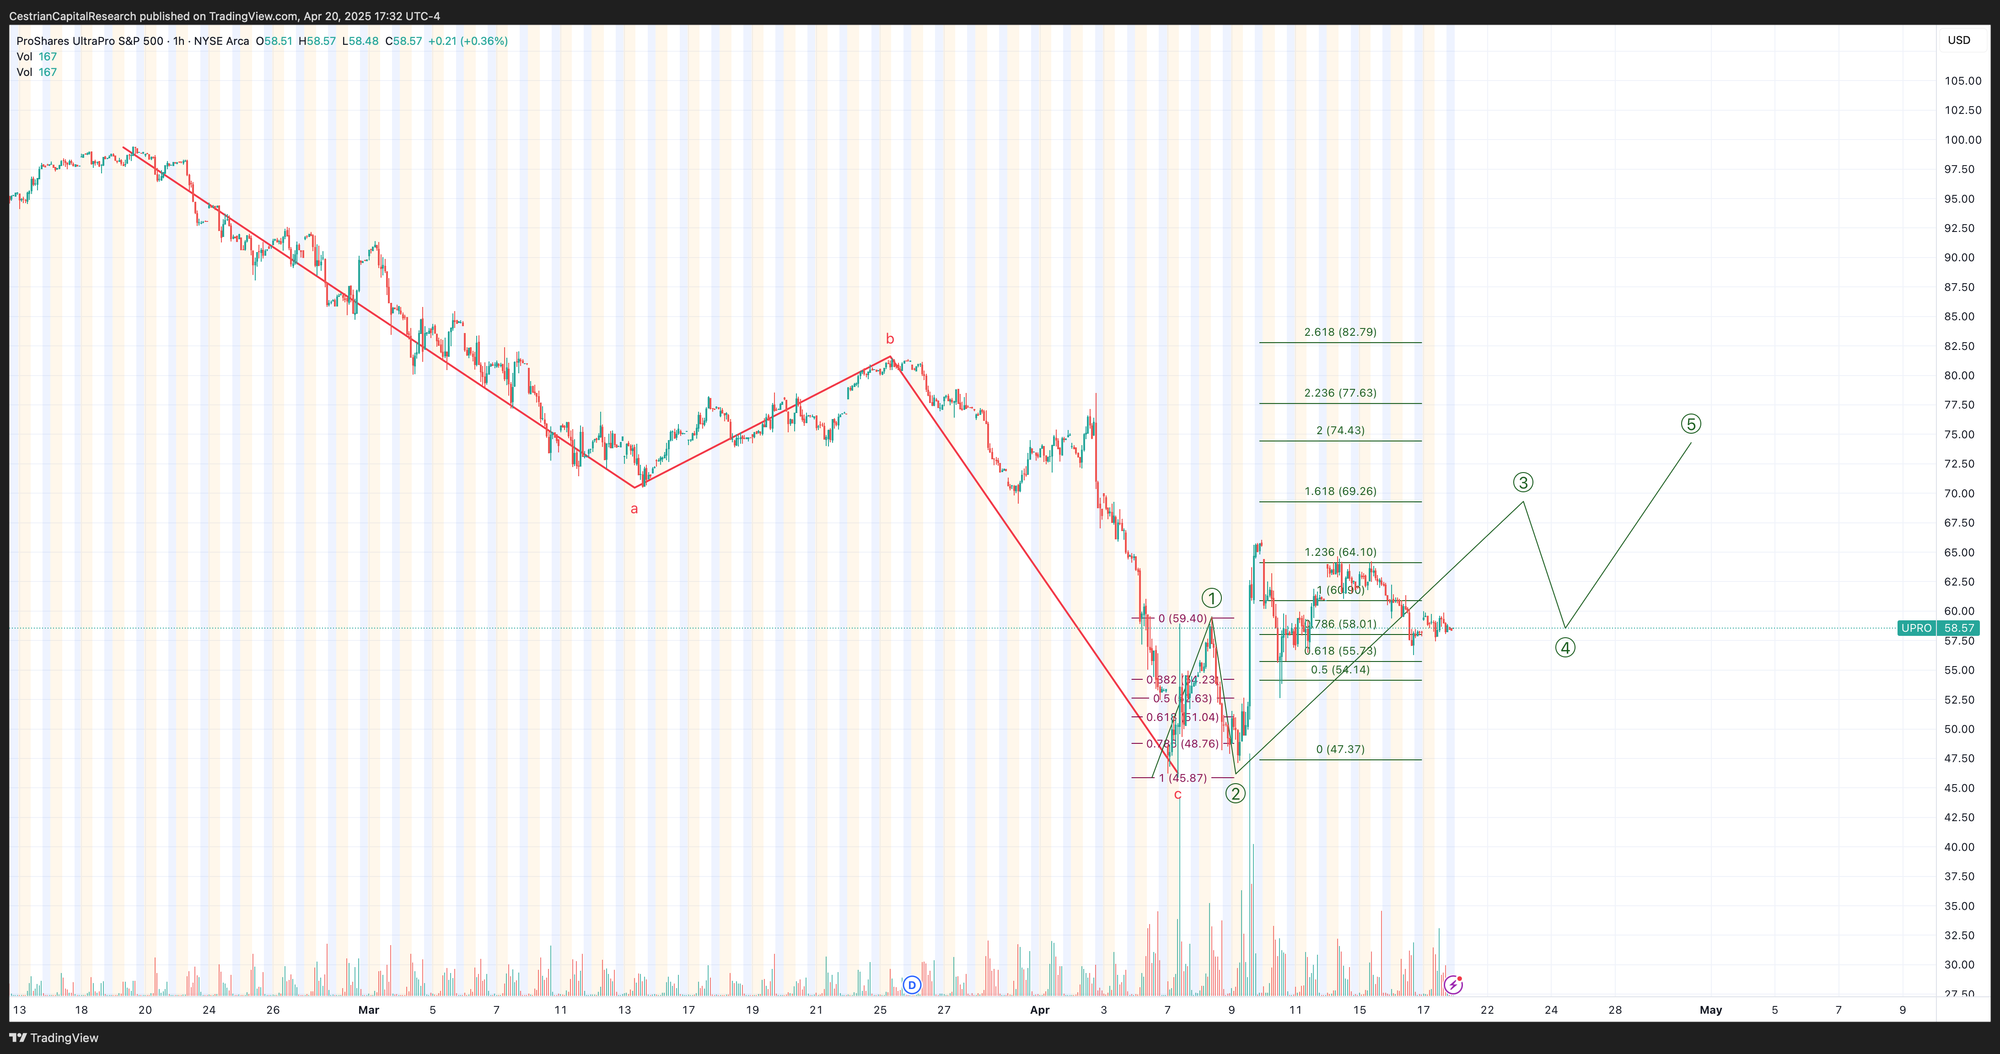
Disclosure: I am unhedged long $UPRO.
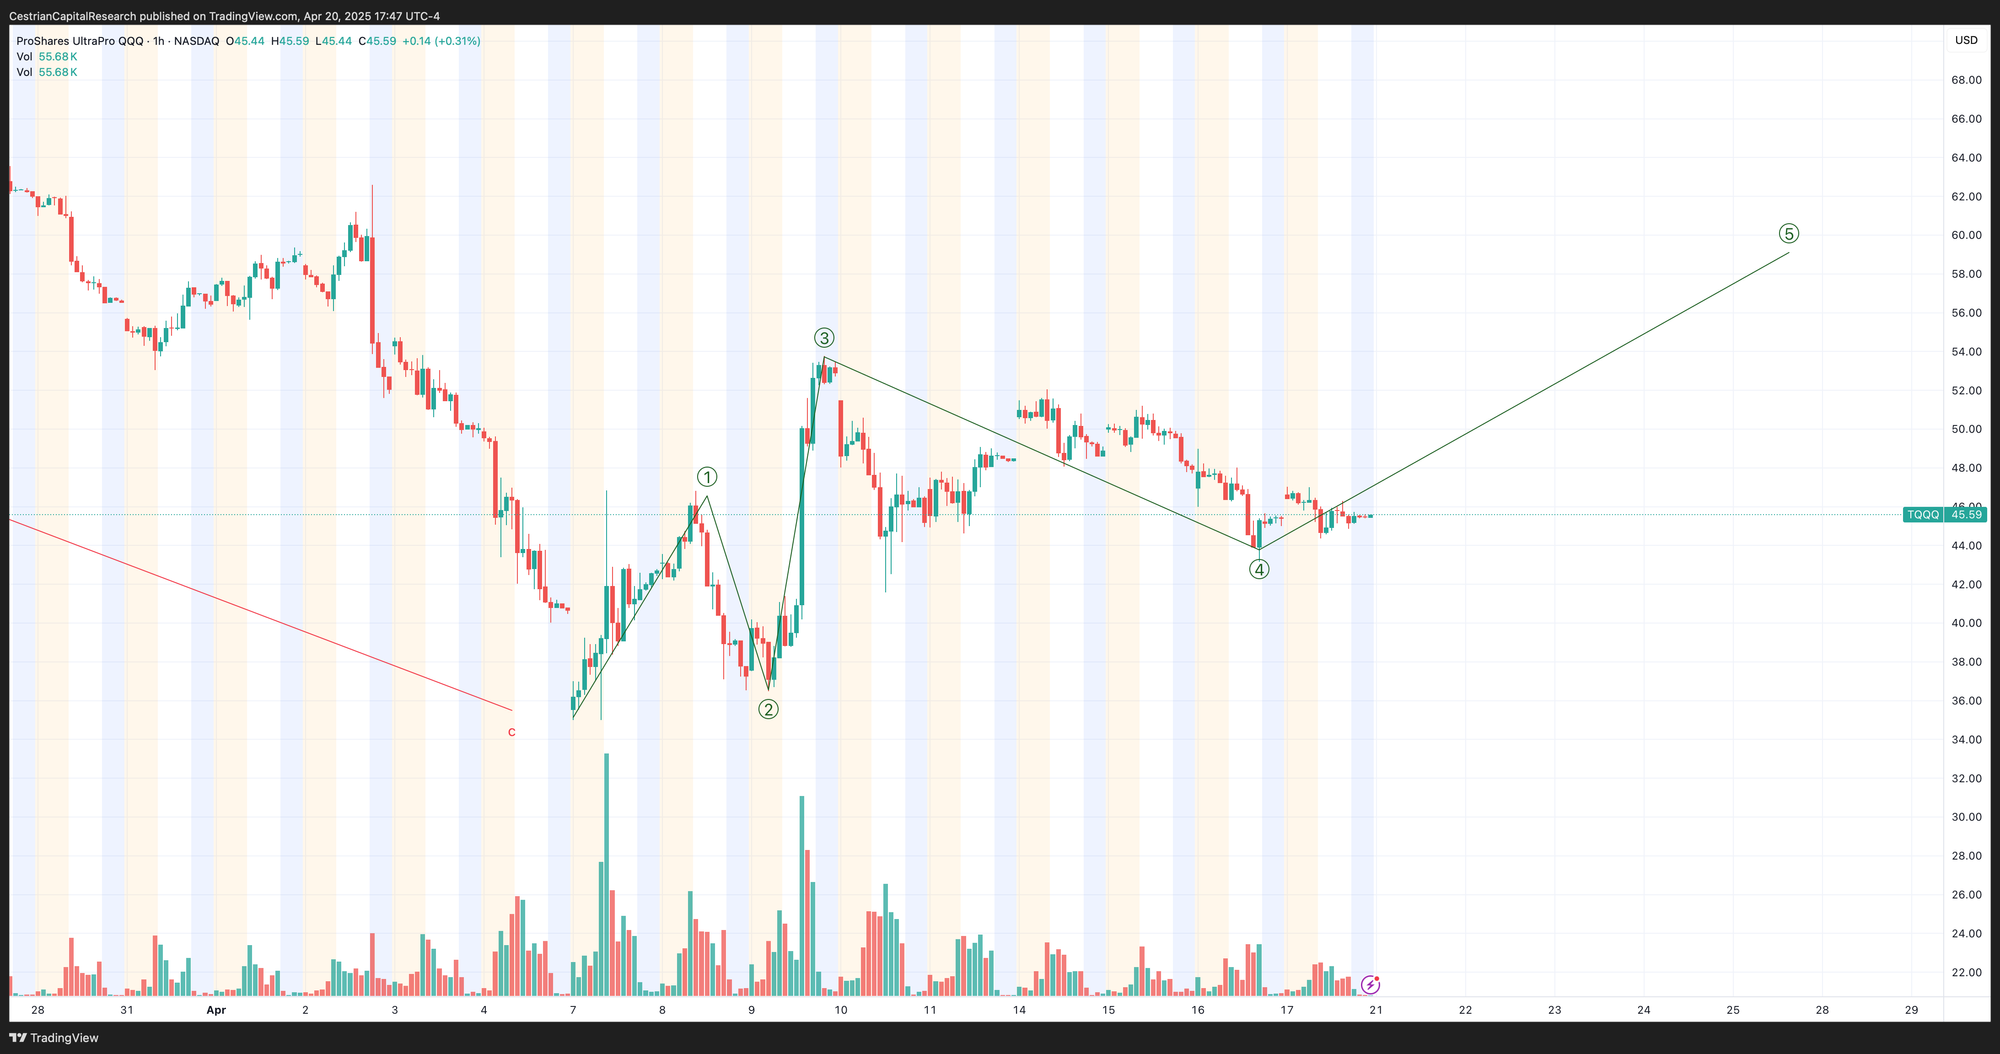
Nasdaq-100 / QQQ / NQ / TQQQ
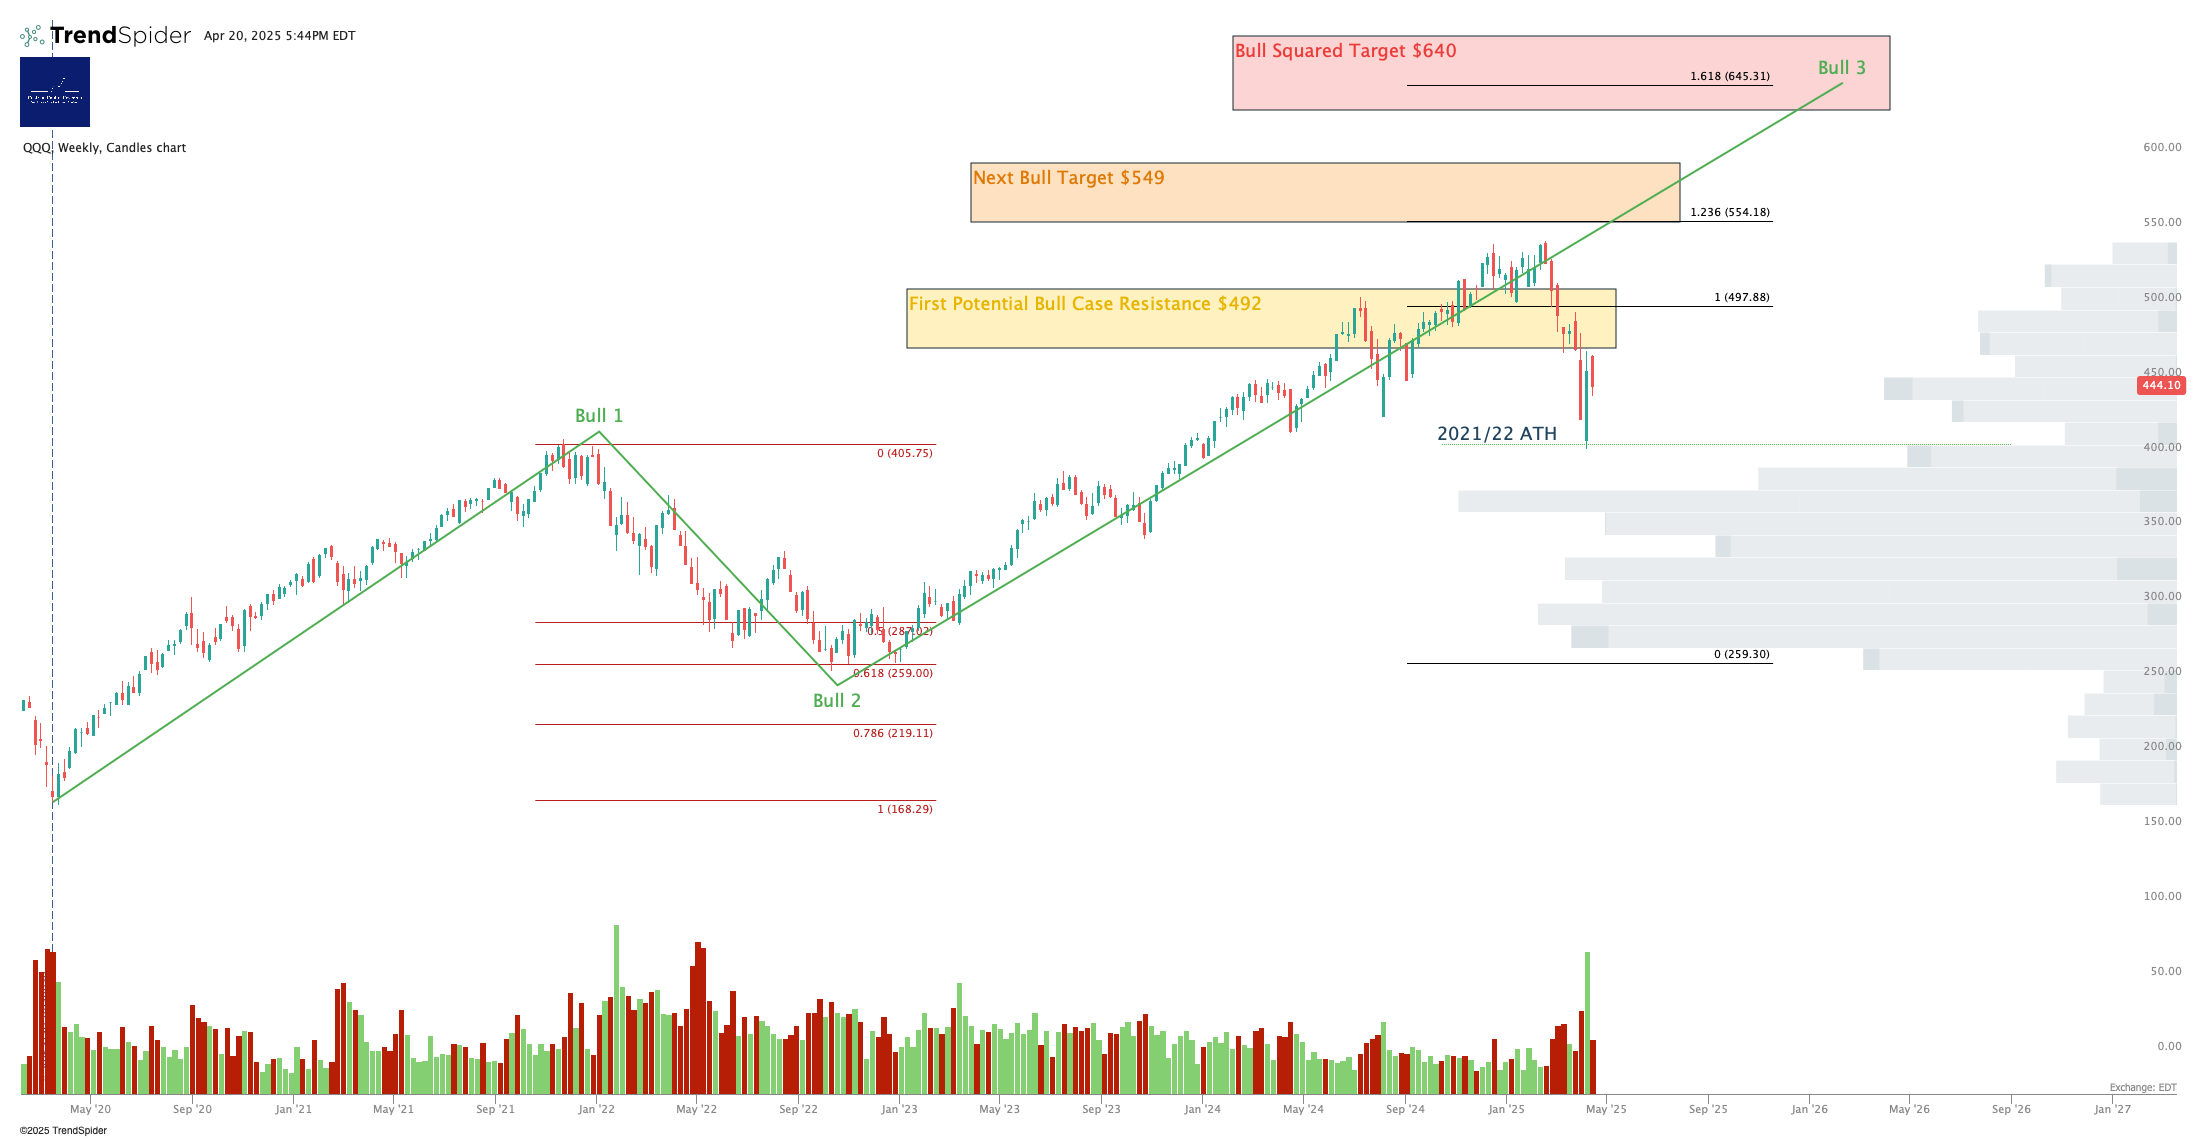
This chart lacks elegance but it may be correct. The Wave 4 shown is holding over the Wave 1 high on a closing-prices basis. We may see a Wave 5 up next.
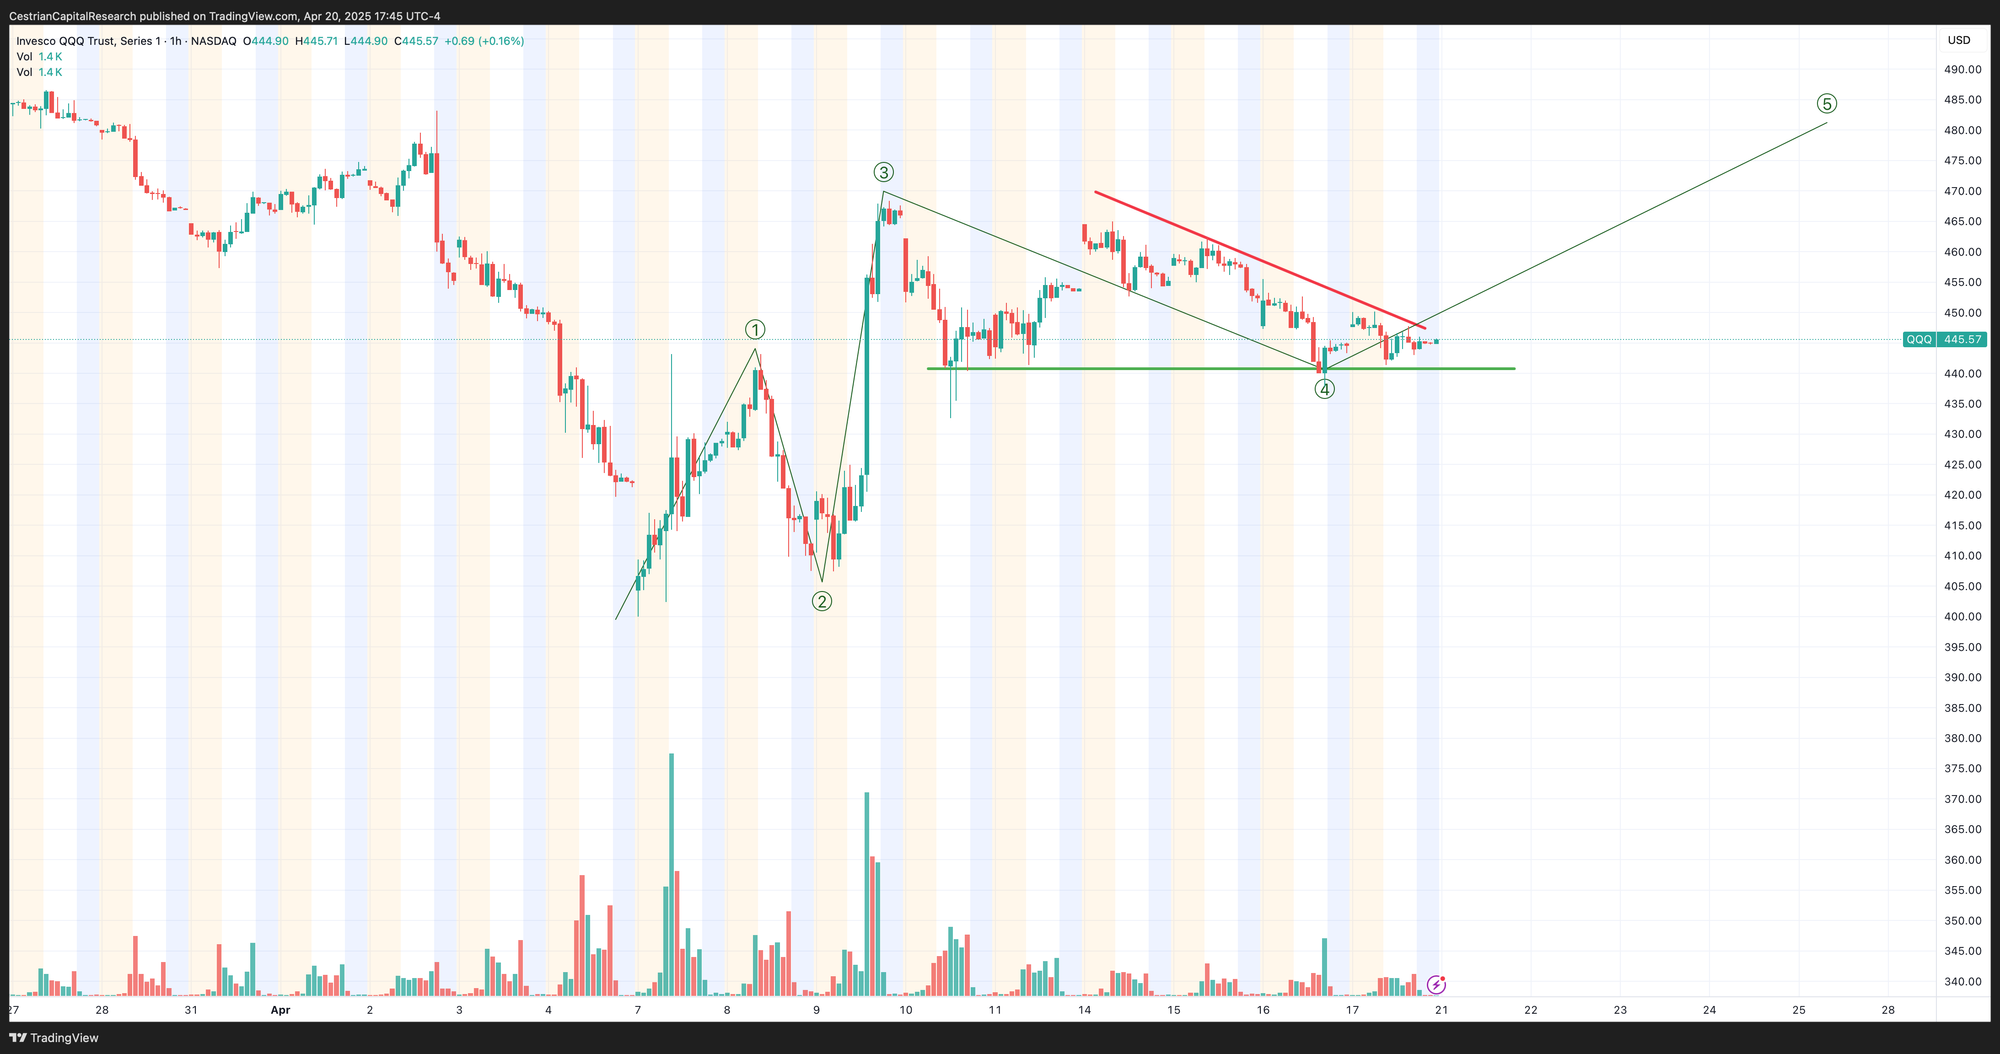
Note - Leveraged ETF. Read the fund documentation if you are considering using this instrument.
If that QQQ chart above is correct then here’s how TQQQ may play out.
Disclosure: I am hedged long $TQQQ / long $PSQ - overall net long the Nasdaq.
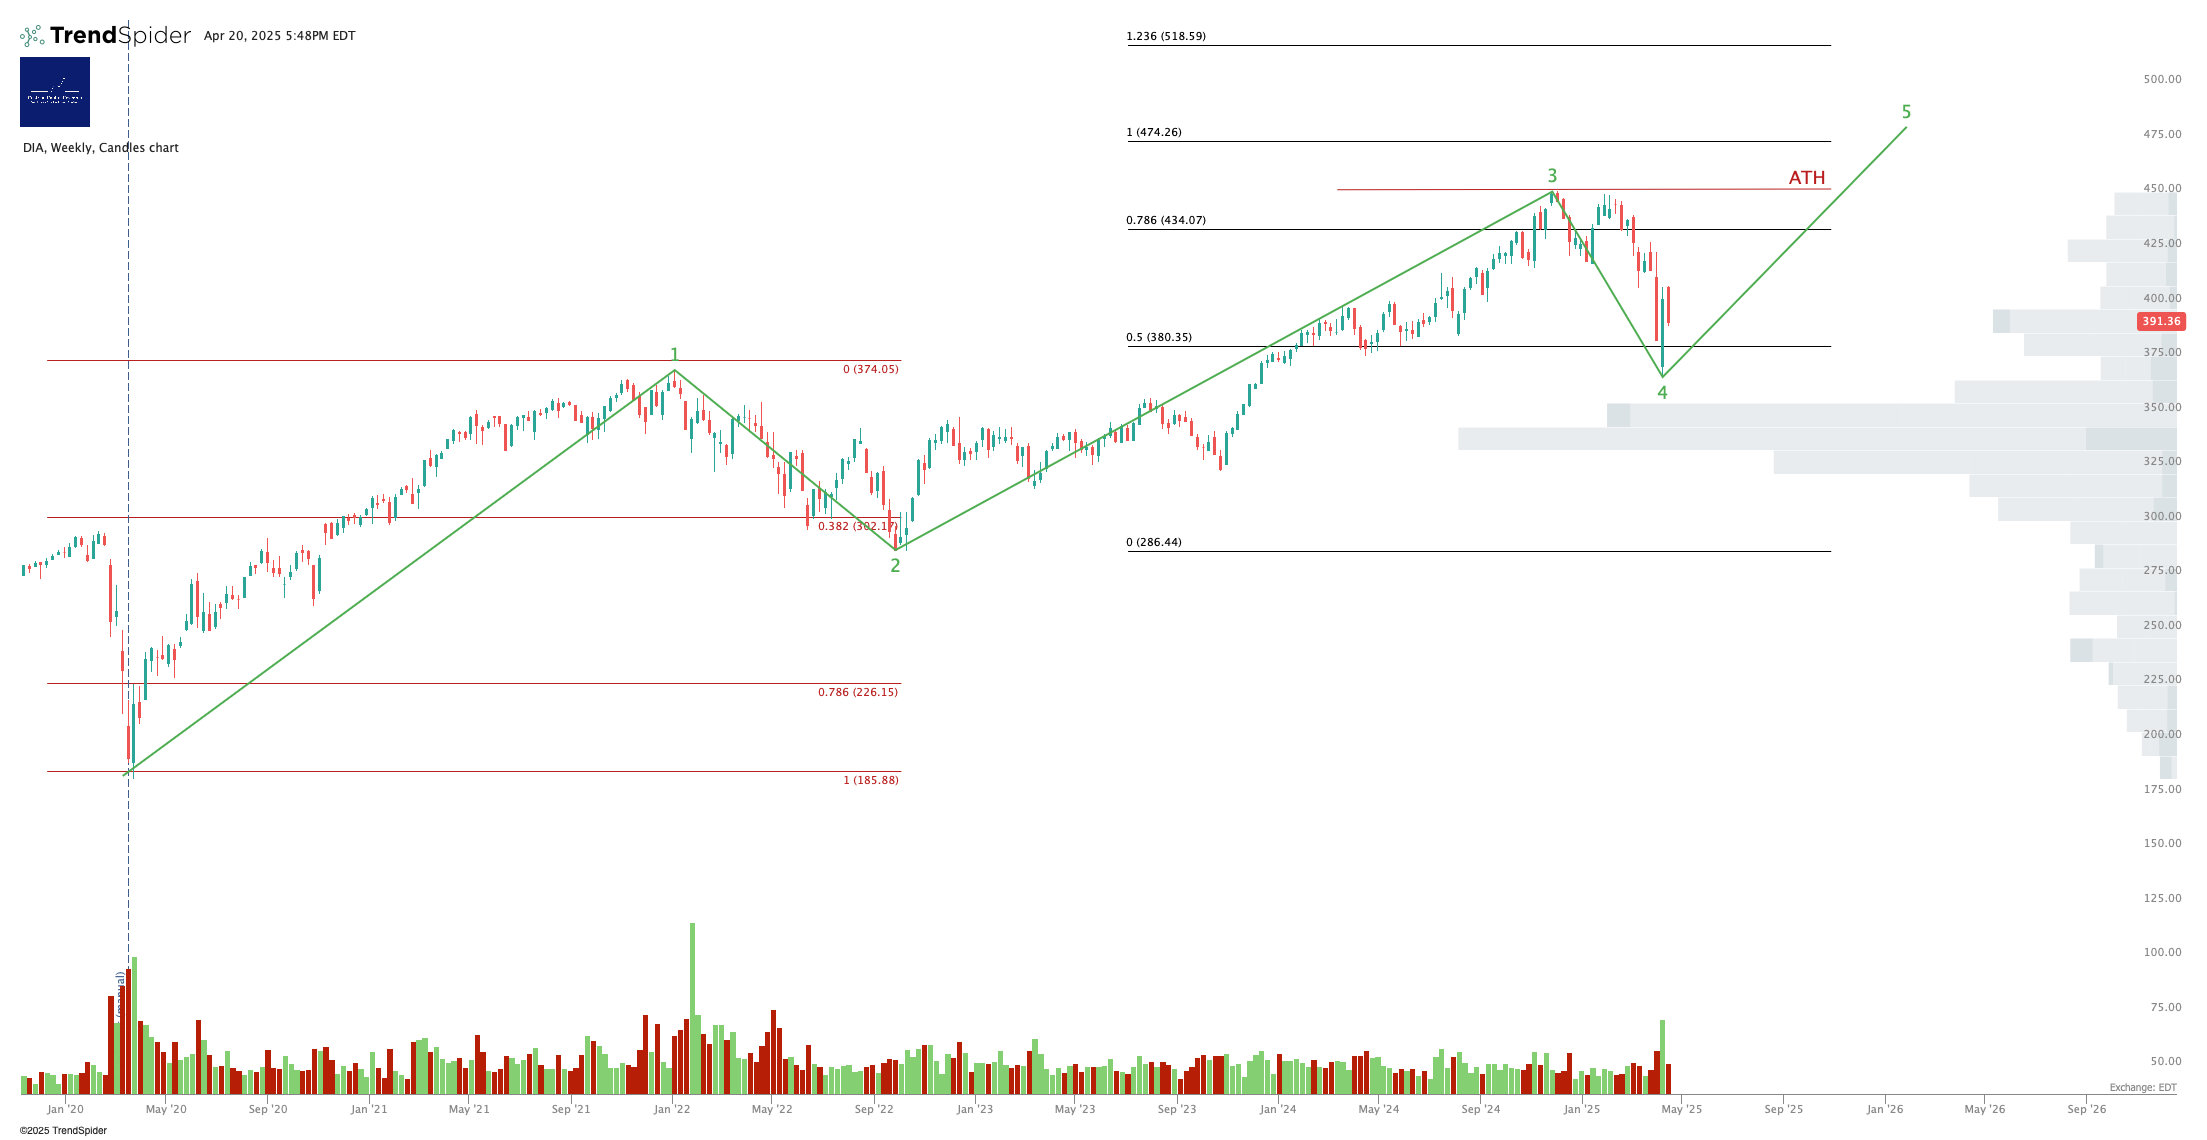
Dow Jones / DIA / YM / UDOW
The Dow may shake off the United Healthcare dump this week.
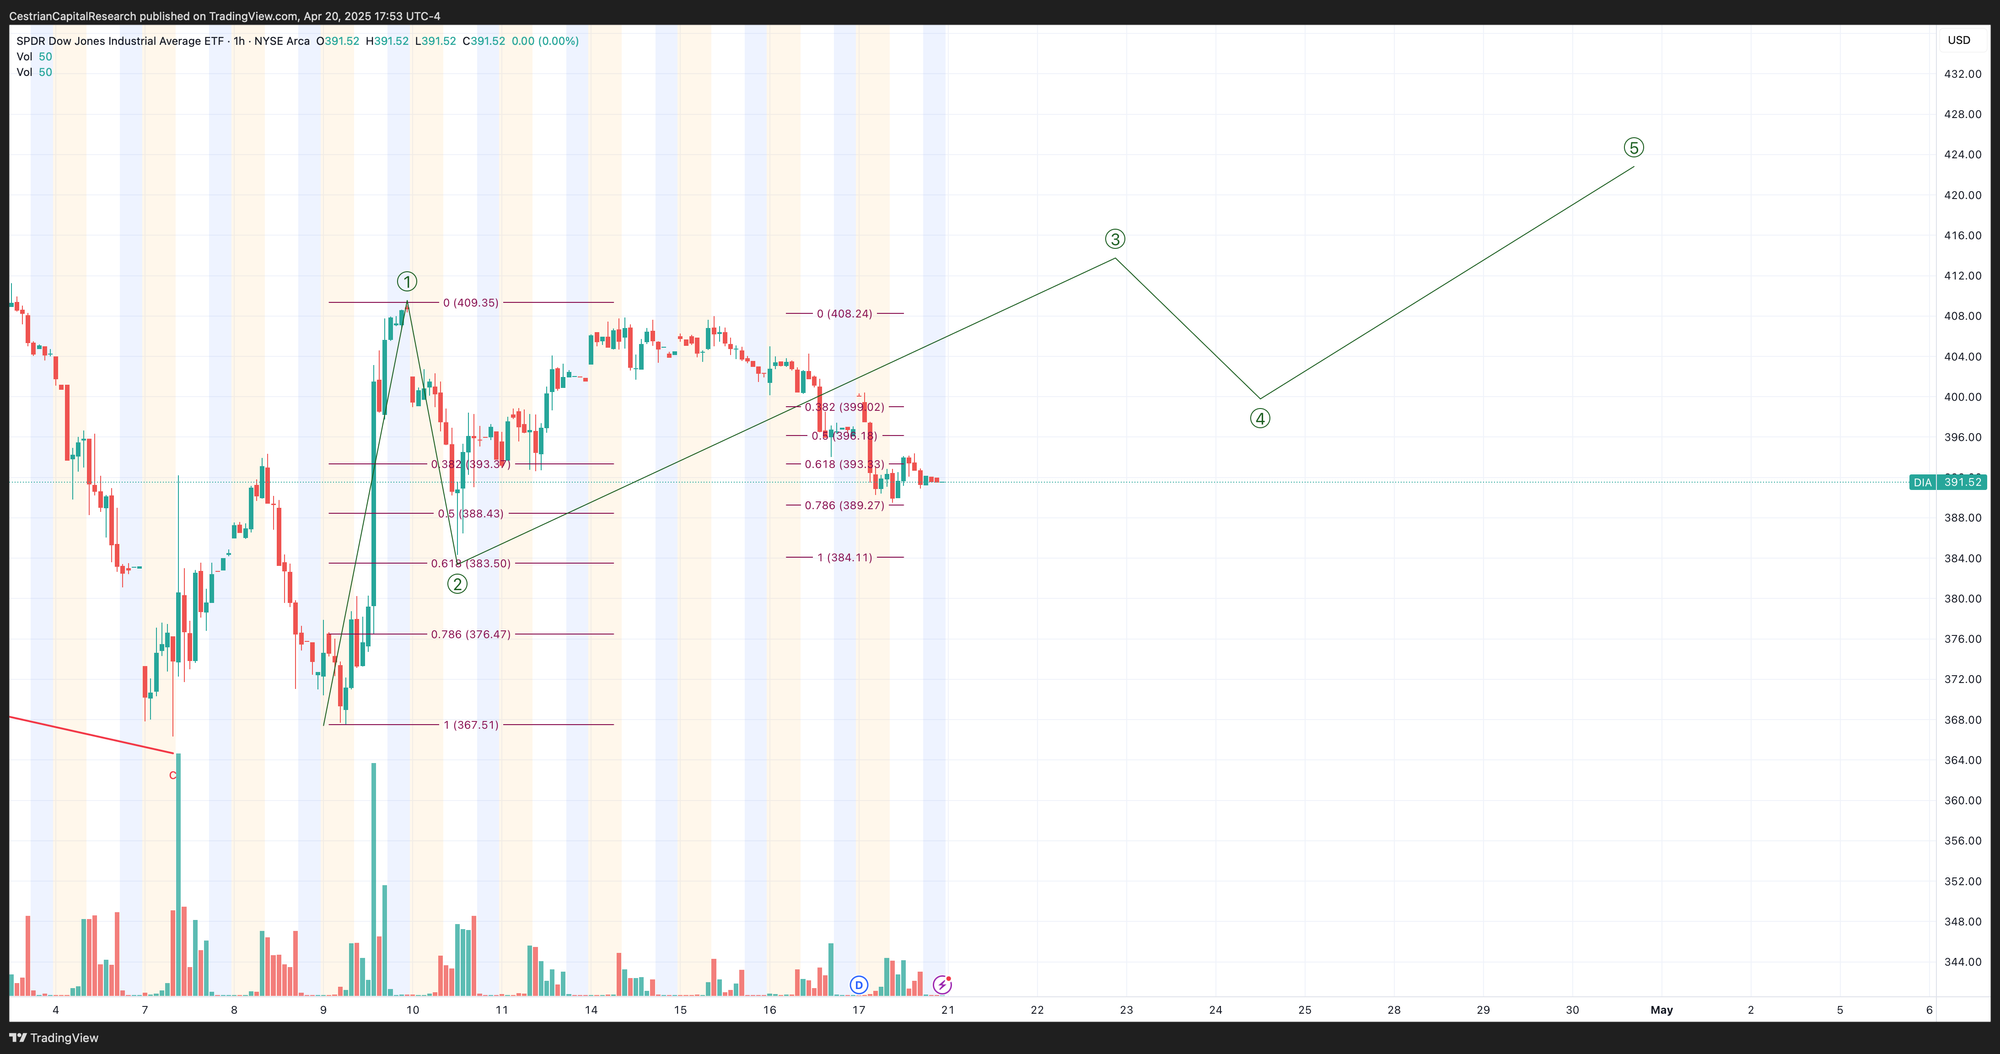
Note - Leveraged ETF. Read the fund documentation if you are considering using this instrument.

Disclosure: No position in the Dow.
Sector ETFs
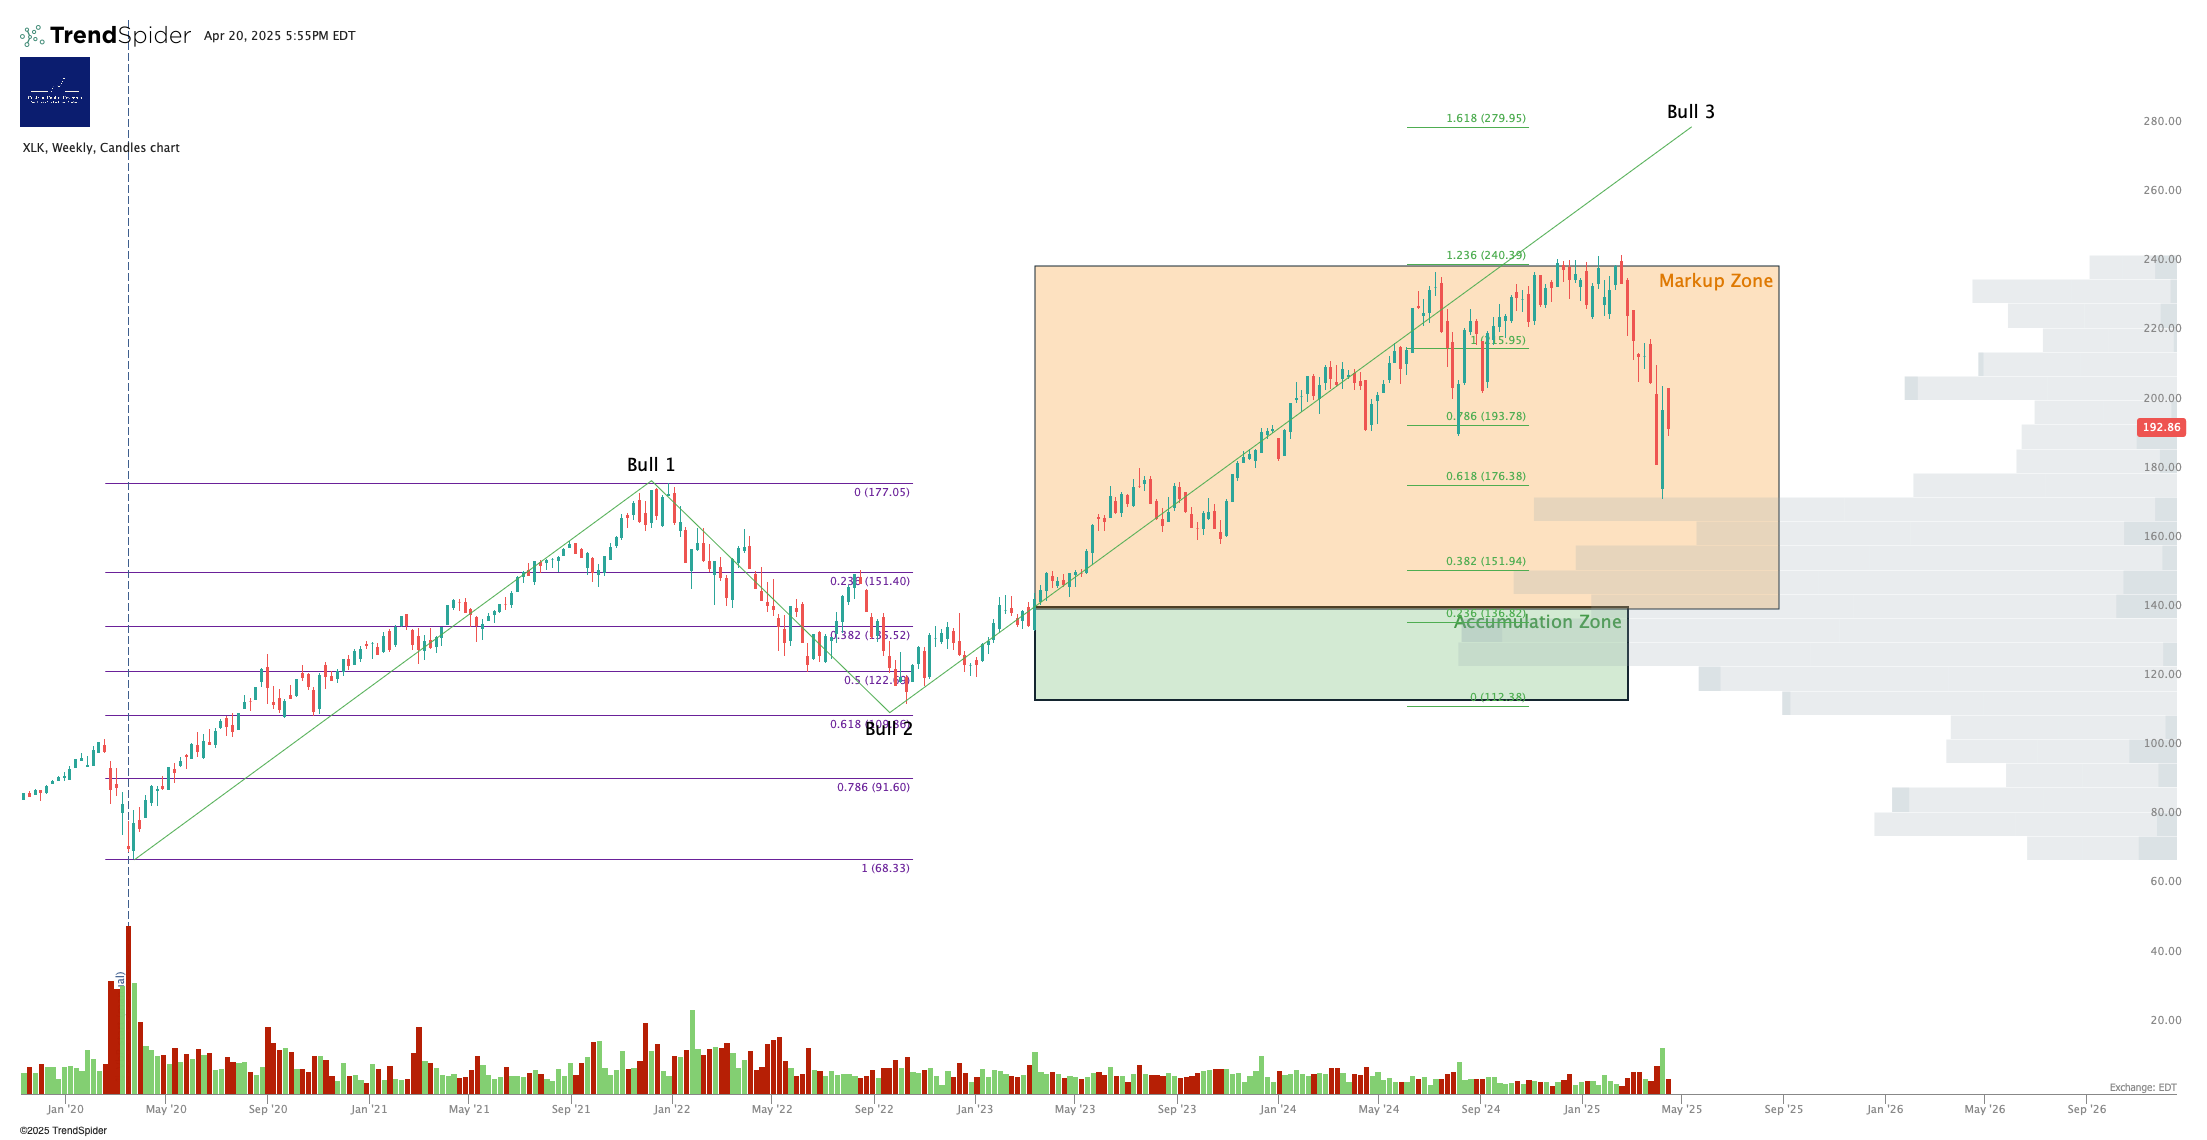
3x Levered Long XLK (Tech) - TECL
Note - TECL and its inverse TECS tend to be illiquid outside RTH with relatively wide bid/ask spreads.
Note - Leveraged ETF. Read the fund documentation if you are considering using this instrument.
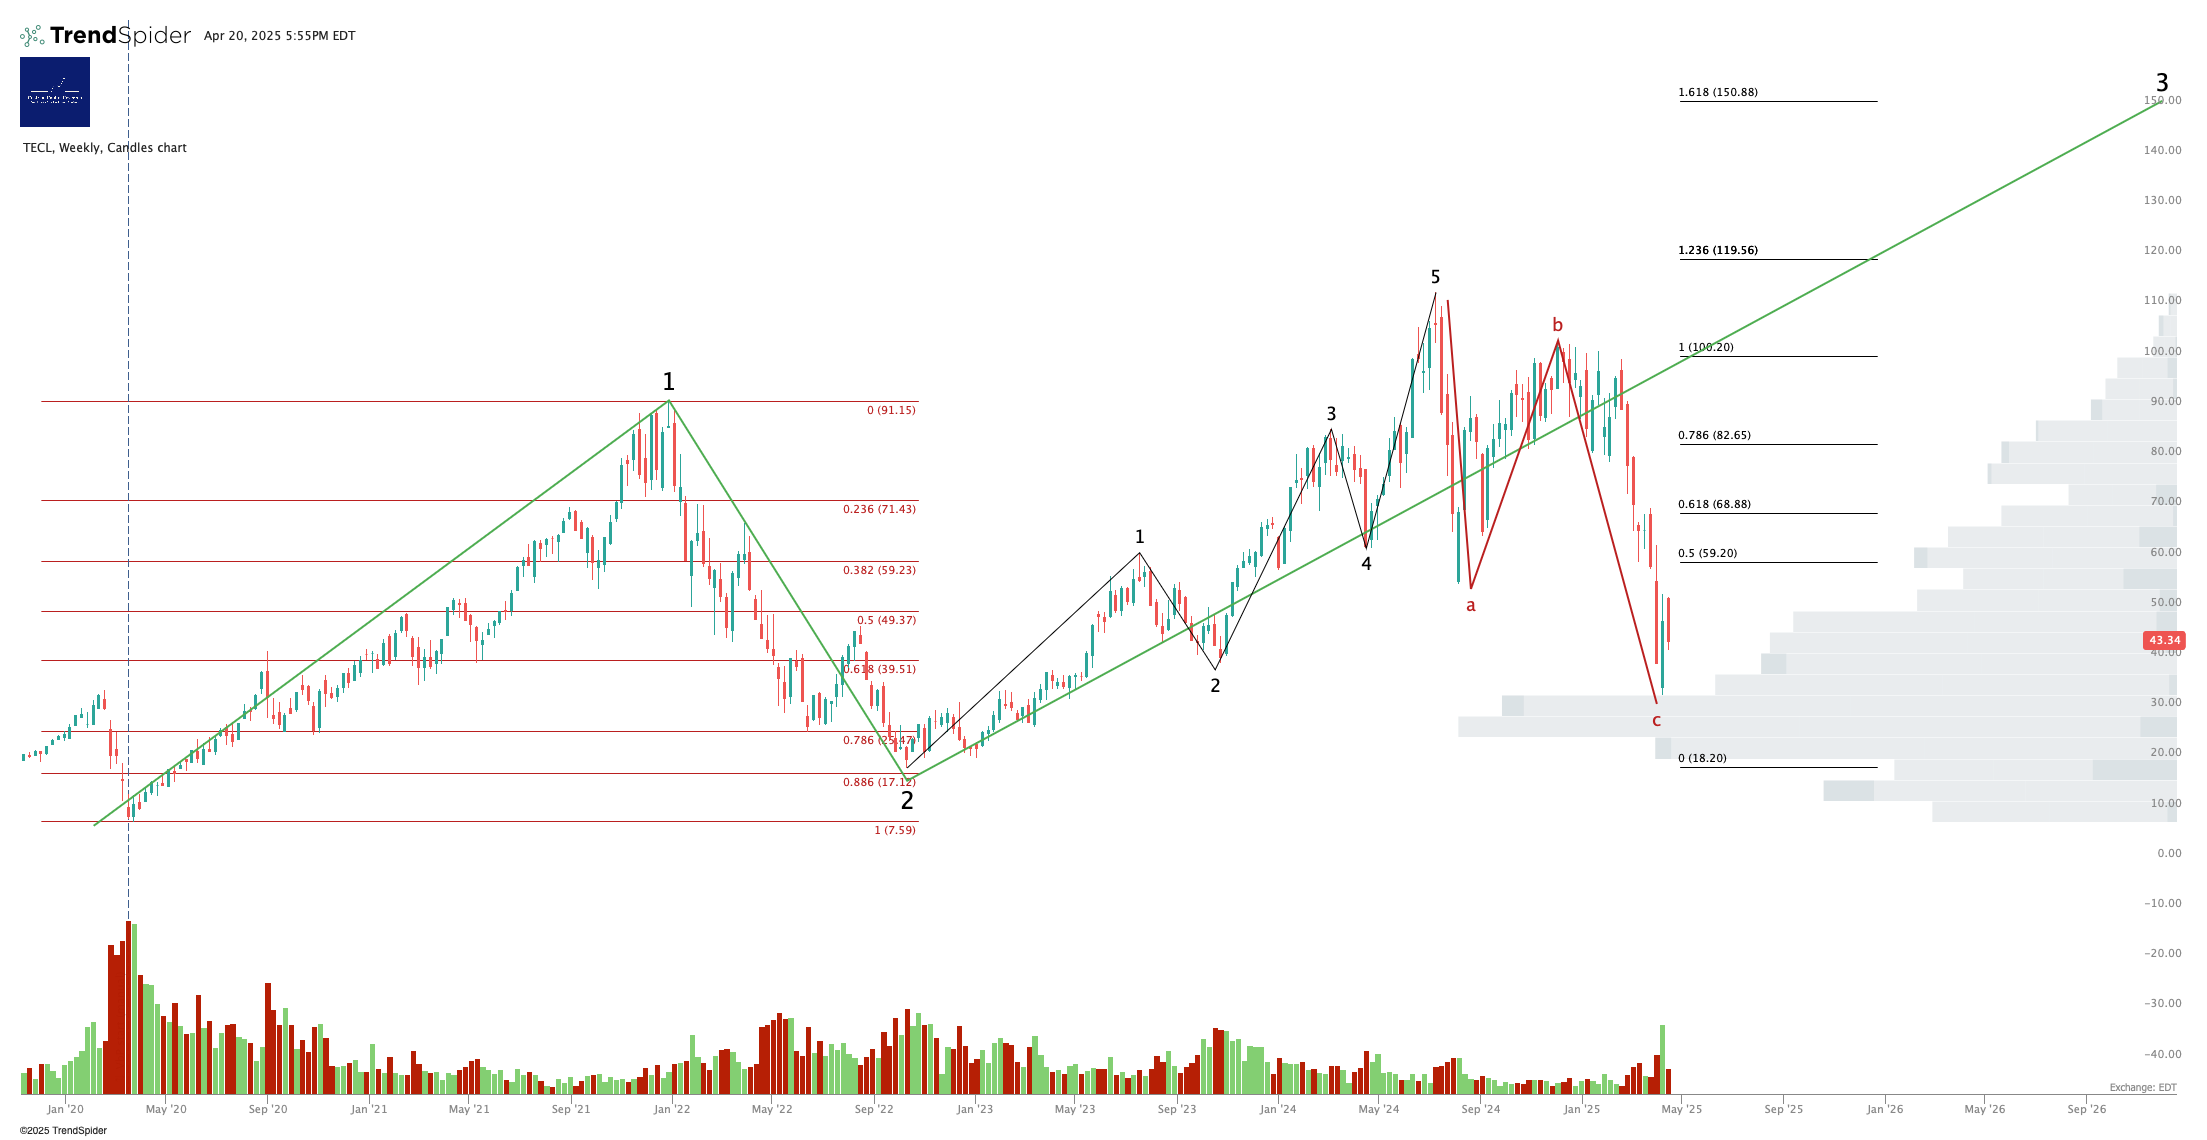
Disclosure: No position in TECL or TECS
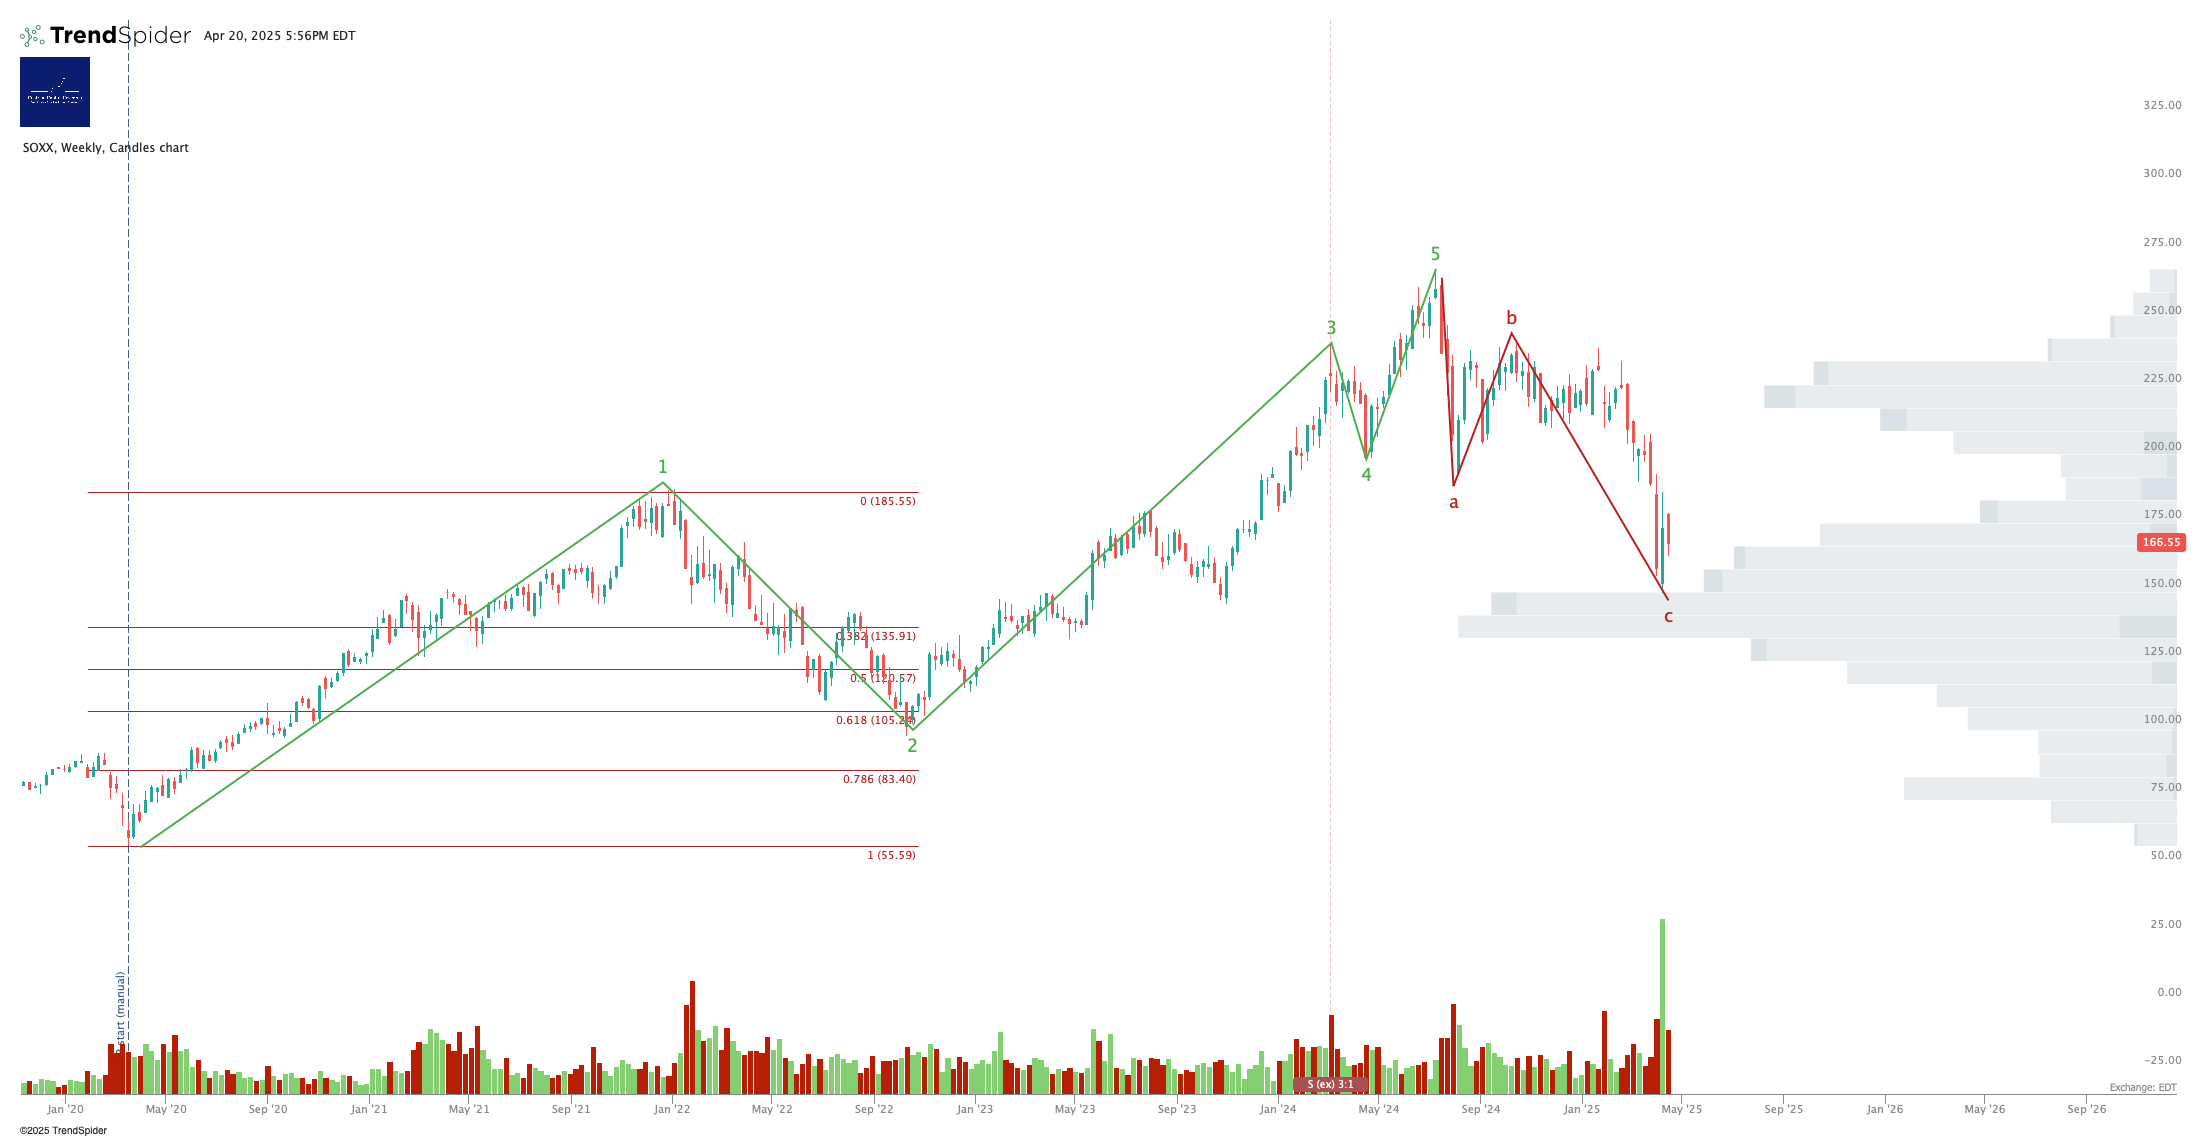
Semiconductor
SOXX (Semiconductor Sector ETF)
3x Levered Long SOXX (Semiconductor) - SOXL
Note - Leveraged ETF. Read the fund documentation if you are considering using this instrument.
Right or wrong, there appears to be a lot of accumulation down here at the lows.
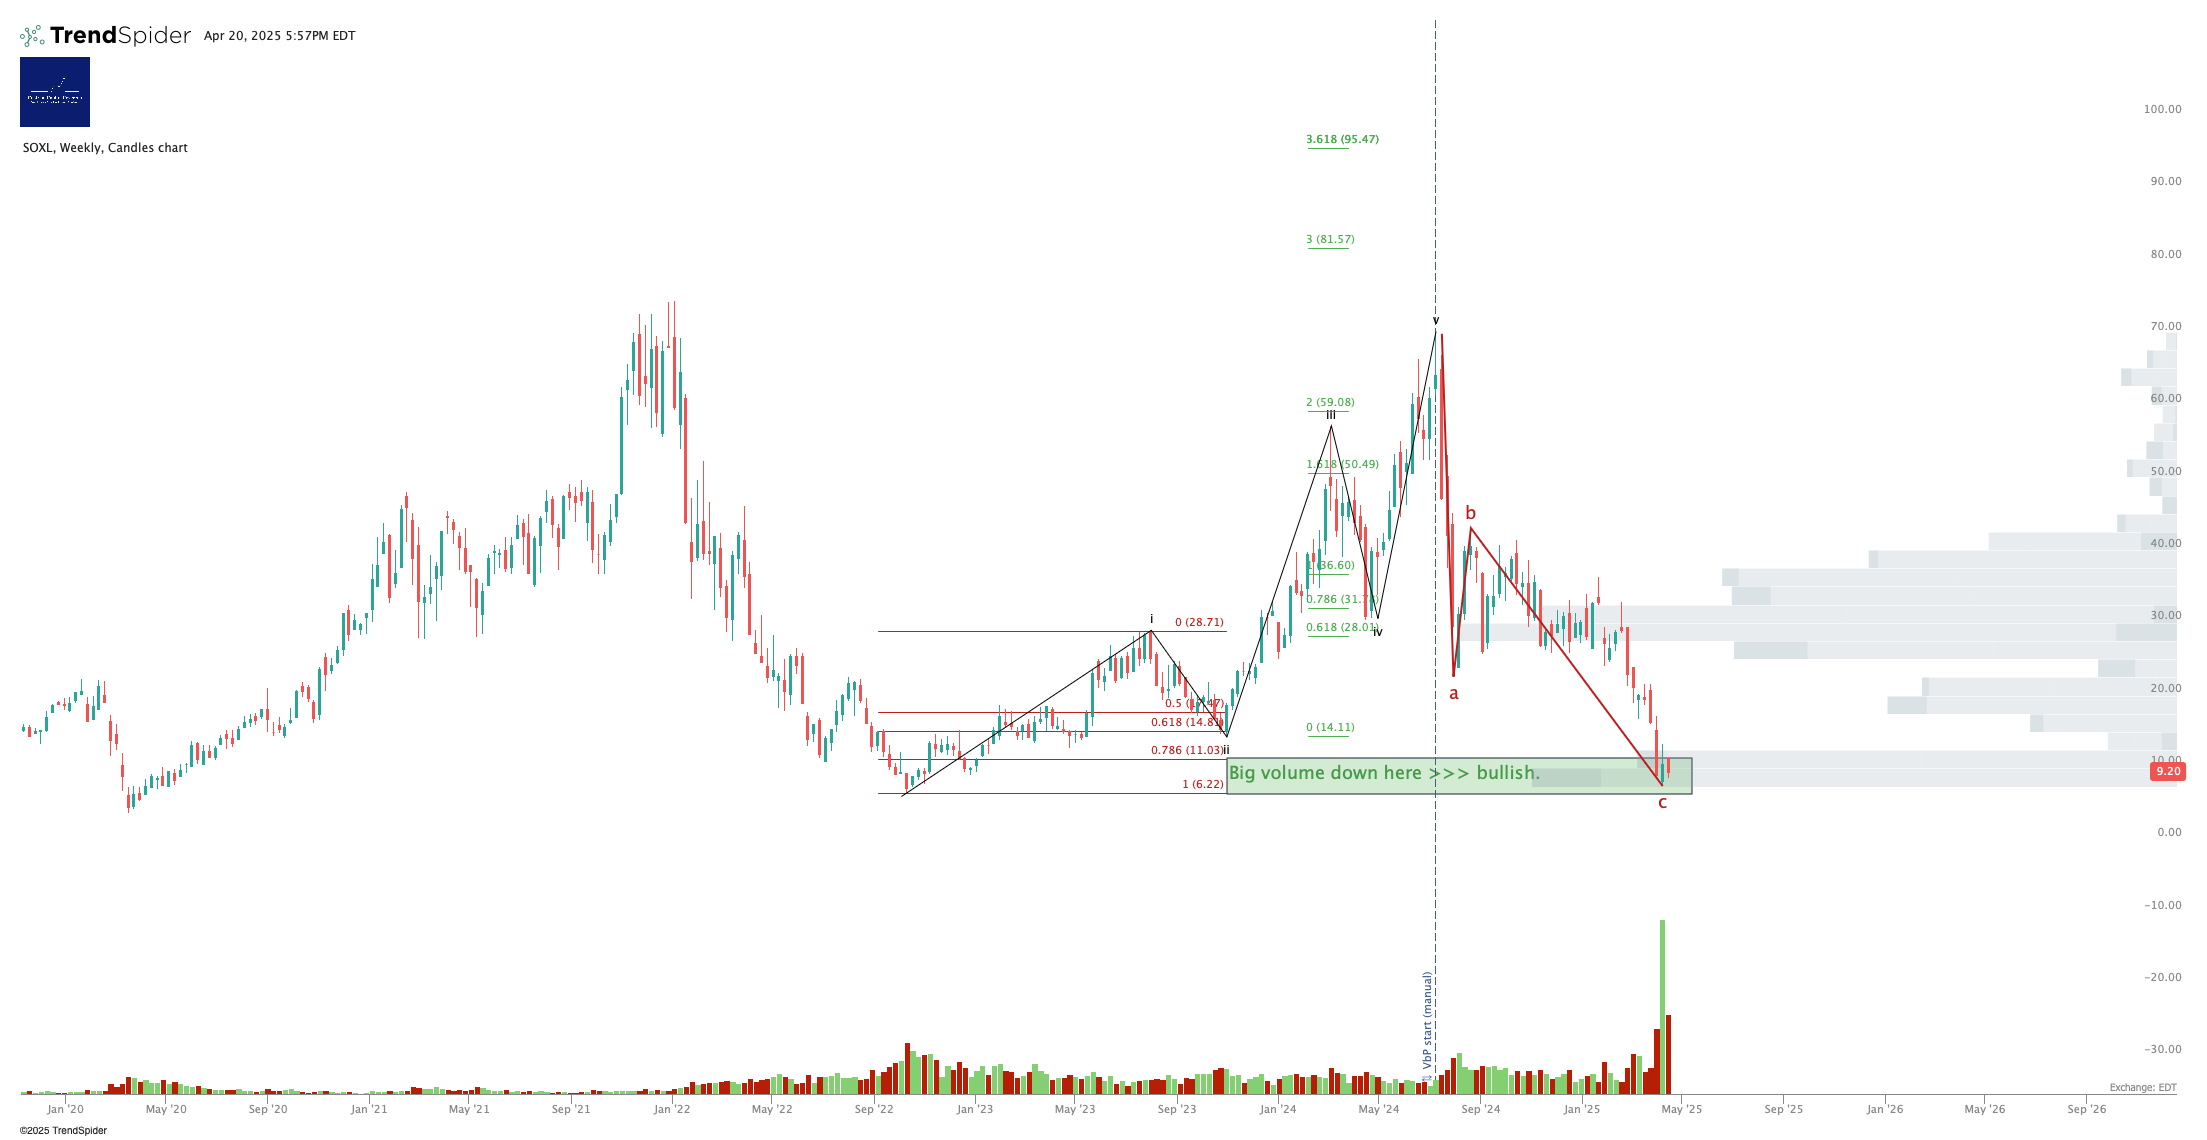
Disclosure: I am unhedged long $SOXL
Alex King, Cestrian Capital Research, Inc - 20 April 2025.
DISCLOSURE - Cestrian Capital Research, Inc staff personal accounts hold long positions in, inter alia, TQQQ, PSQ, UPRO, SOXL, TLT, USO, DTLA.