Market When Closed, Sunday 29 December

DISCLAIMER: This note is intended for US recipients only and, in particular, is not directed at, nor intended to be relied upon by any UK recipients. Any information or analysis in this note is not an offer to sell or the solicitation of an offer to buy any securities. Nothing in this note is intended to be investment advice and nor should it be relied upon to make investment decisions. Cestrian Capital Research, Inc., its employees, agents or affiliates, including the author of this note, or related persons, may have a position in any stocks, security, or financial instrument referenced in this note. Any opinions, analyses, or probabilities expressed in this note are those of the author as of the note's date of publication and are subject to change without notice. Companies referenced in this note or their employees or affiliates may be customers of Cestrian Capital Research, Inc. Cestrian Capital Research, Inc. values both its independence and transparency and does not believe that this presents a material potential conflict of interest or impacts the content of its research or publications.
Awakening From Slumber
by Alex King, CEO, Cestrian Capital Research, Inc
Well, it's been fun. But at some point bigs gotta get back to work and some of them, the smaller fry that have only the 6000 sq ft Hamptons house and the baby yacht - more of a boat, really - will be traipsing back to the office to actually do some work Monday. I think everyone is a little queasy about market direction right now, reason, nobody knows what policies will be brought to bear post inauguration, and worse, nobody knows how the market will react to whatever such policies are in fact brought in. So you have a little who's-on-first game going on right now which is causing equities to be somewhat rangebound, at index level at least, which is causing bond markets to keep goading the 10yr yield ever higher, and which is applying Dementor-like treatment to any crypto ebullience that tries to catch hold. To borrow a phrase from Ben Hunt (Epsilon Theory, here), "the crowd can't see the crowd" so there is a lack of committed direction at present. Did the Dow top already? No-one is quite sure. Is inflation going to run up? Yes, if you look at any bond chart, no, if you look at oil. Unclear.
So what to do? Well, you can always hedge everything out, sit and wait, nothing wrong with that. Or pick a direction but lighten up on allocations to reduce risk. Nothing wrong with that either. Or, gun for only short-term targets with stops or hedges at the ready. Lots of ways to win. YOLOing or "full porting" or any of this week's other favored FinTwit strategies, good luck with that.
Anyway, let’s check in on where markets stand right now. Today's "Market On... " note is published on a no-paywall basis by way of celebration of (nearly) the new trading year to come. If you're yet to sign up for one of our subscription services, it's a great time to do so - we have 48 Hours Of Discounts available from now until midnight Eastern time on 31 December. To get the good discounts, use only the links in this post:

Short- And Medium-Term Market Analysis
Don’t forget that to open full page versions of any of the charts below you can just click on the underlined header which titles each chart - they are all hyperlinks.
US 10-Year Yield
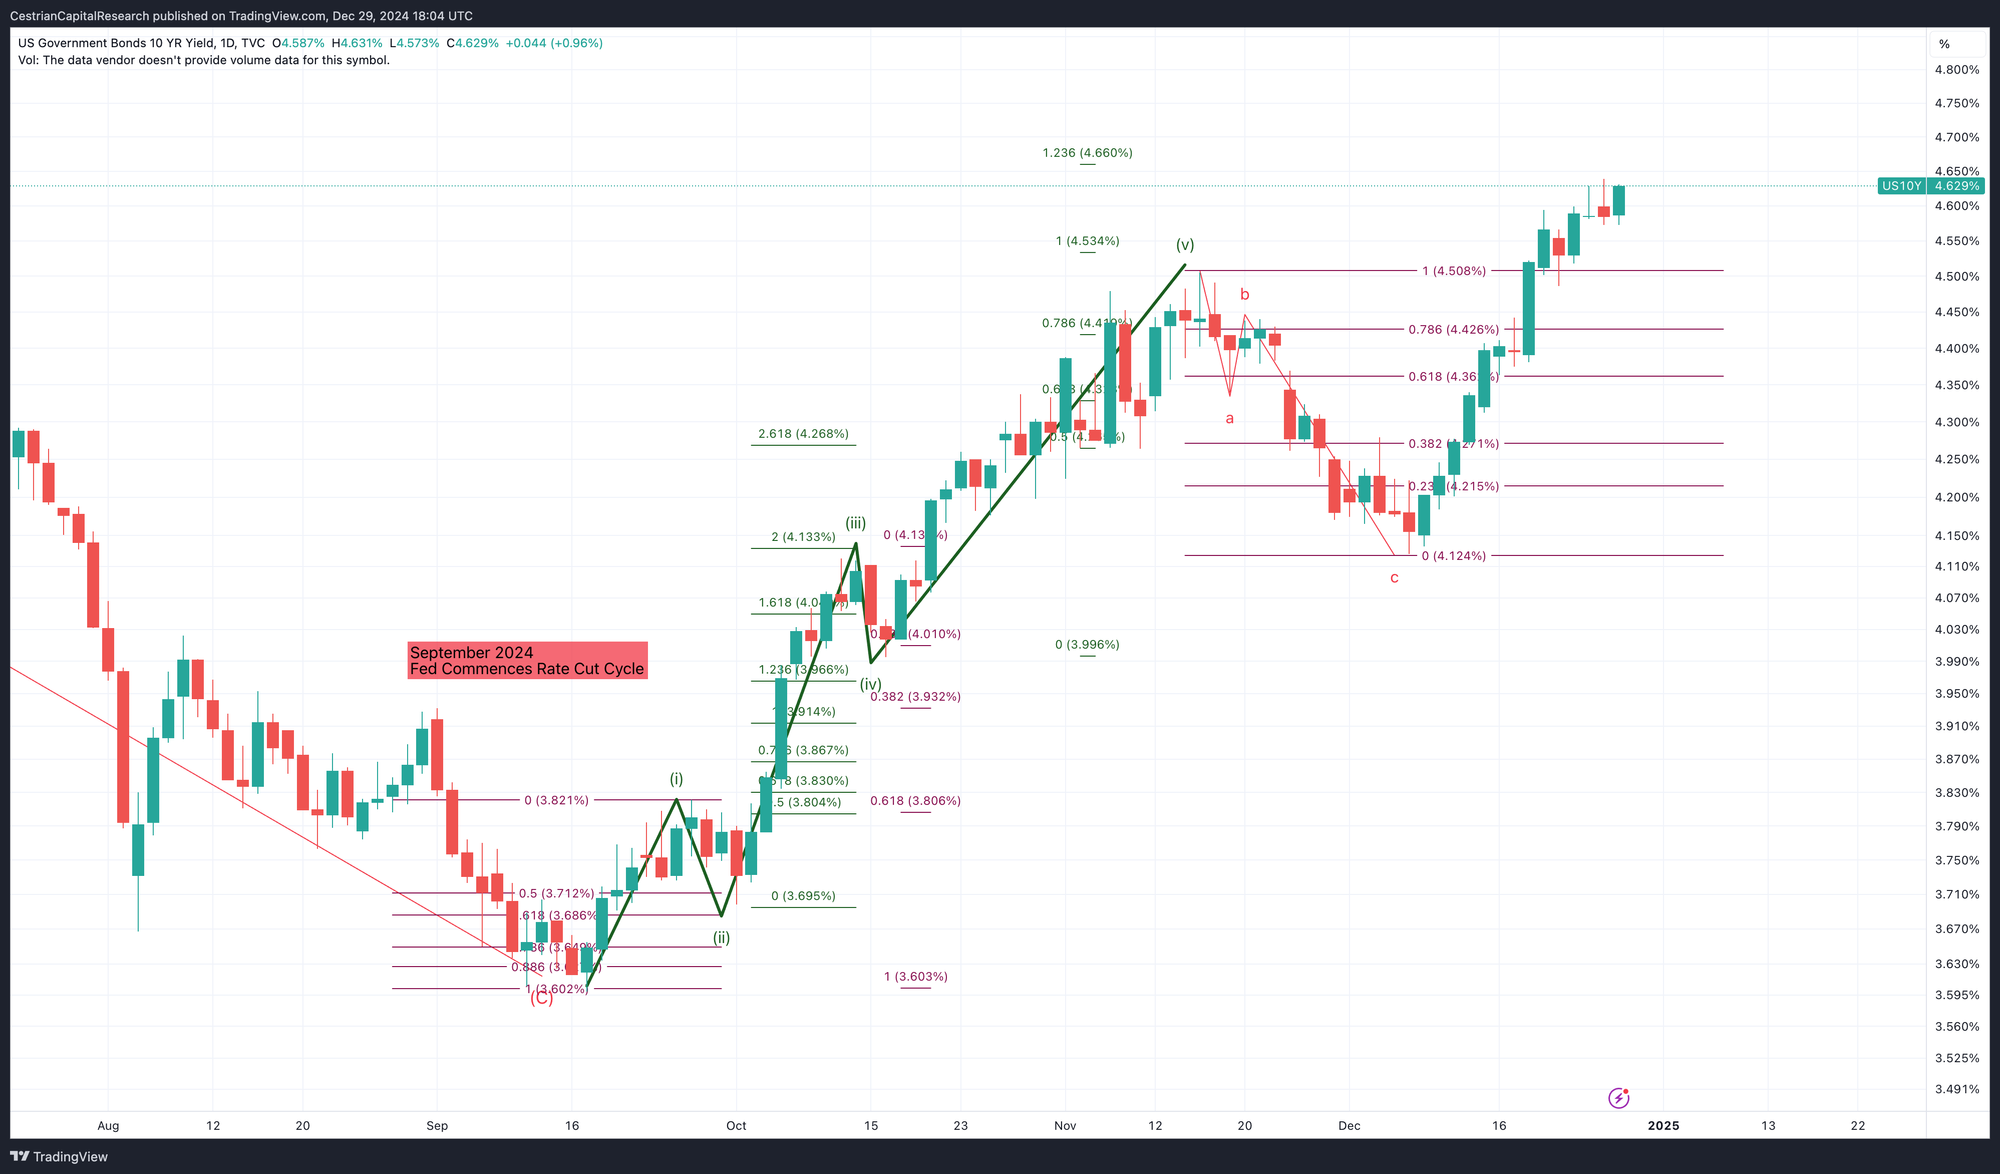
The 10yr woulda coulda shoulda topped already. Actually if you look closely, Friday's high didn't break up and over Thursday's high so perhaps we start to see a reversal soon. If you are the incoming Administration and you want to be in good shape for refinancing government debt as it comes along, and indeed raising new levels of debt, you want this number to go down. So I am assuming we will see some policy initiatives intended to drag this number down. They may not succeed, of course!
Equity Volatility
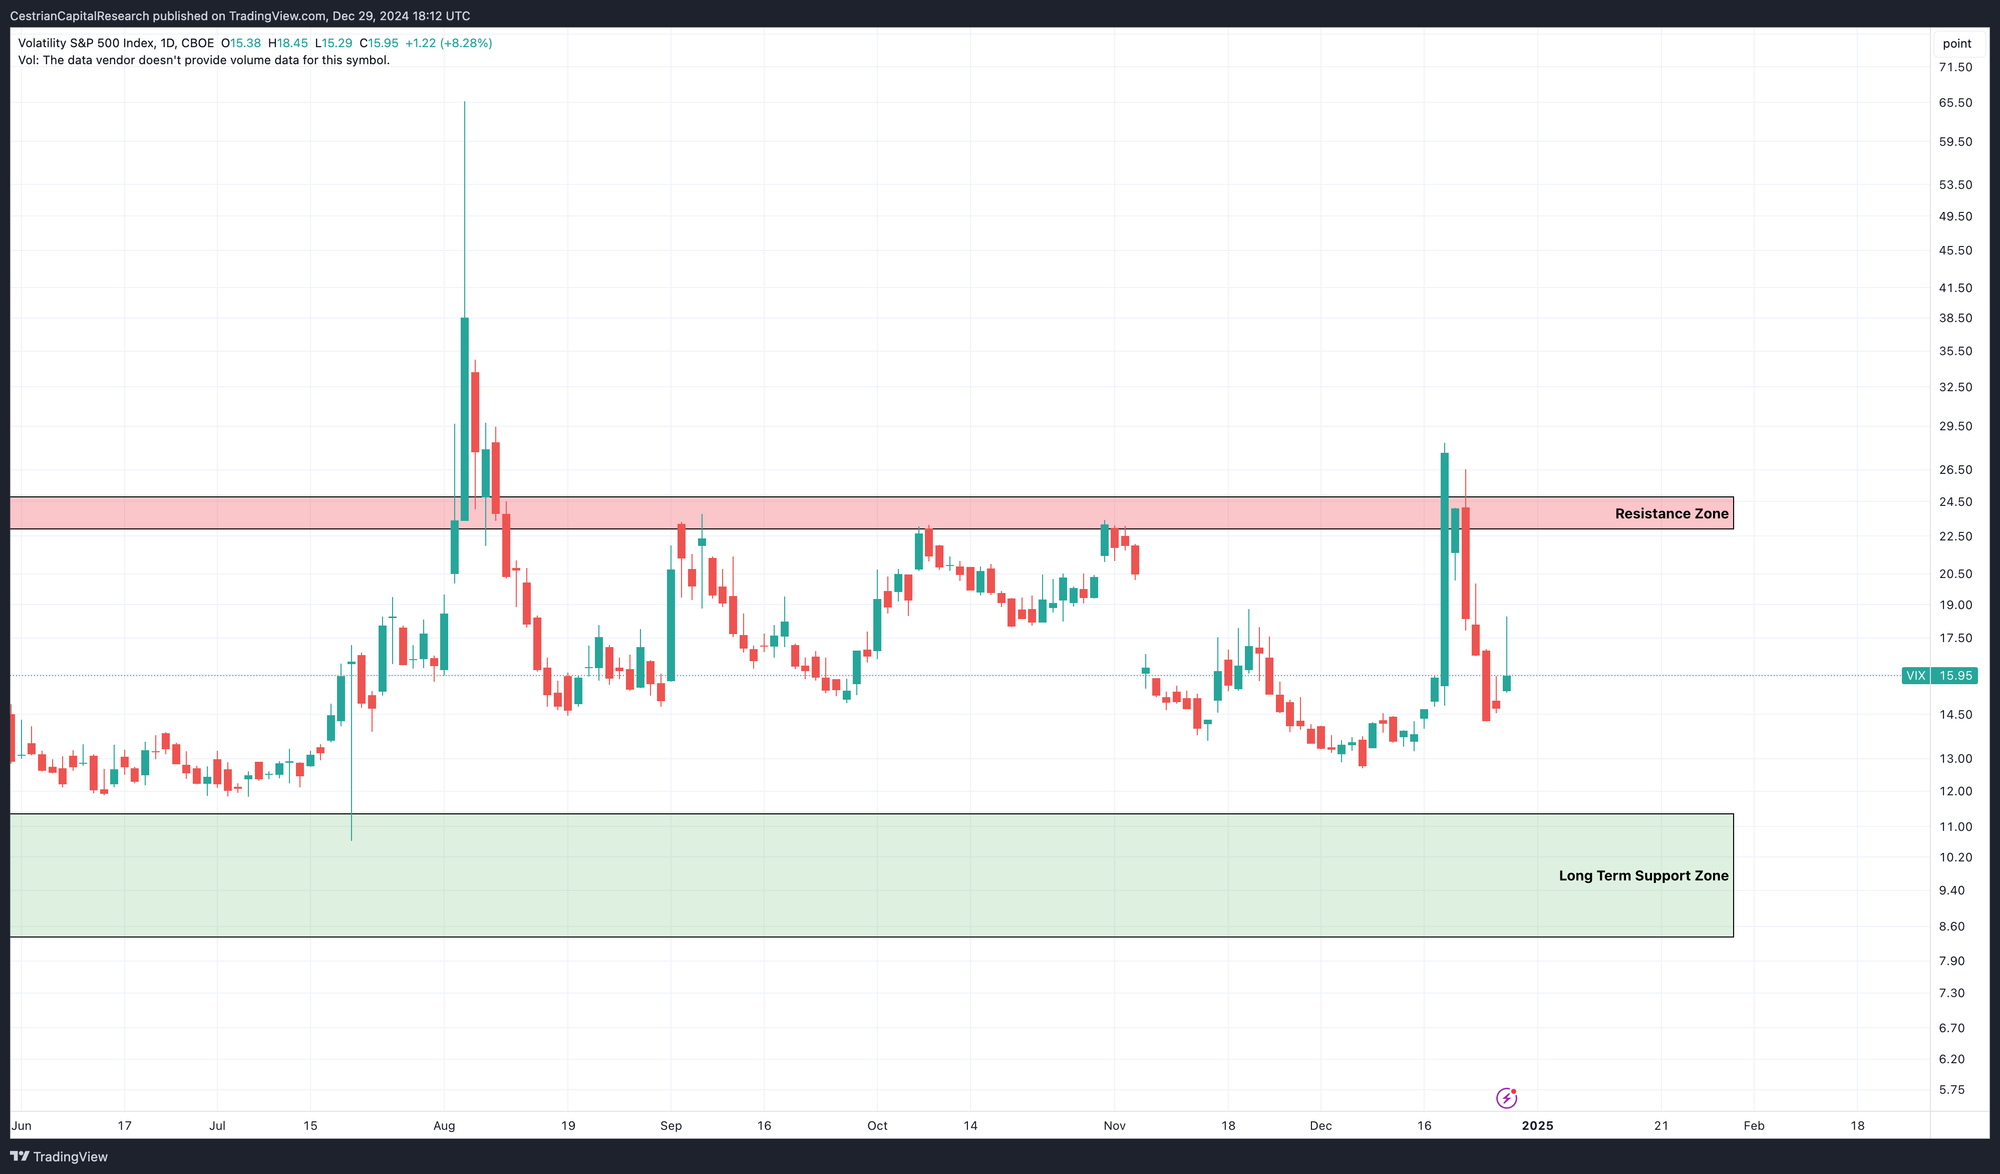
Since everyone that has a published opinion is of the view that equity volatility will increase in the next couple years vs. the only-up of 2023-4, it's unsurprising to see the Vix rising to reflect increasing demand for S&P500 puts. At this point the pain trade would, I think, be only-up or only-down in 2025 since it seems no-one is expecting an easy bull or an easy bear market. (One should not fear bear markets by the way. One should just have a plan to recognize tops and reversals and, within your comfort zone and indeed compliance zone of permitted securities, own ones that will go up as prices fall. You don't have to use esoteric or levered instruments; a simple position in, for instance, $SH, will rise as the S&P500 falls.
Anyway, here's the Vix.
Disclosure: No position in volatility-based securities.
Longer-Term Treasury Bonds (TLT / TMF)
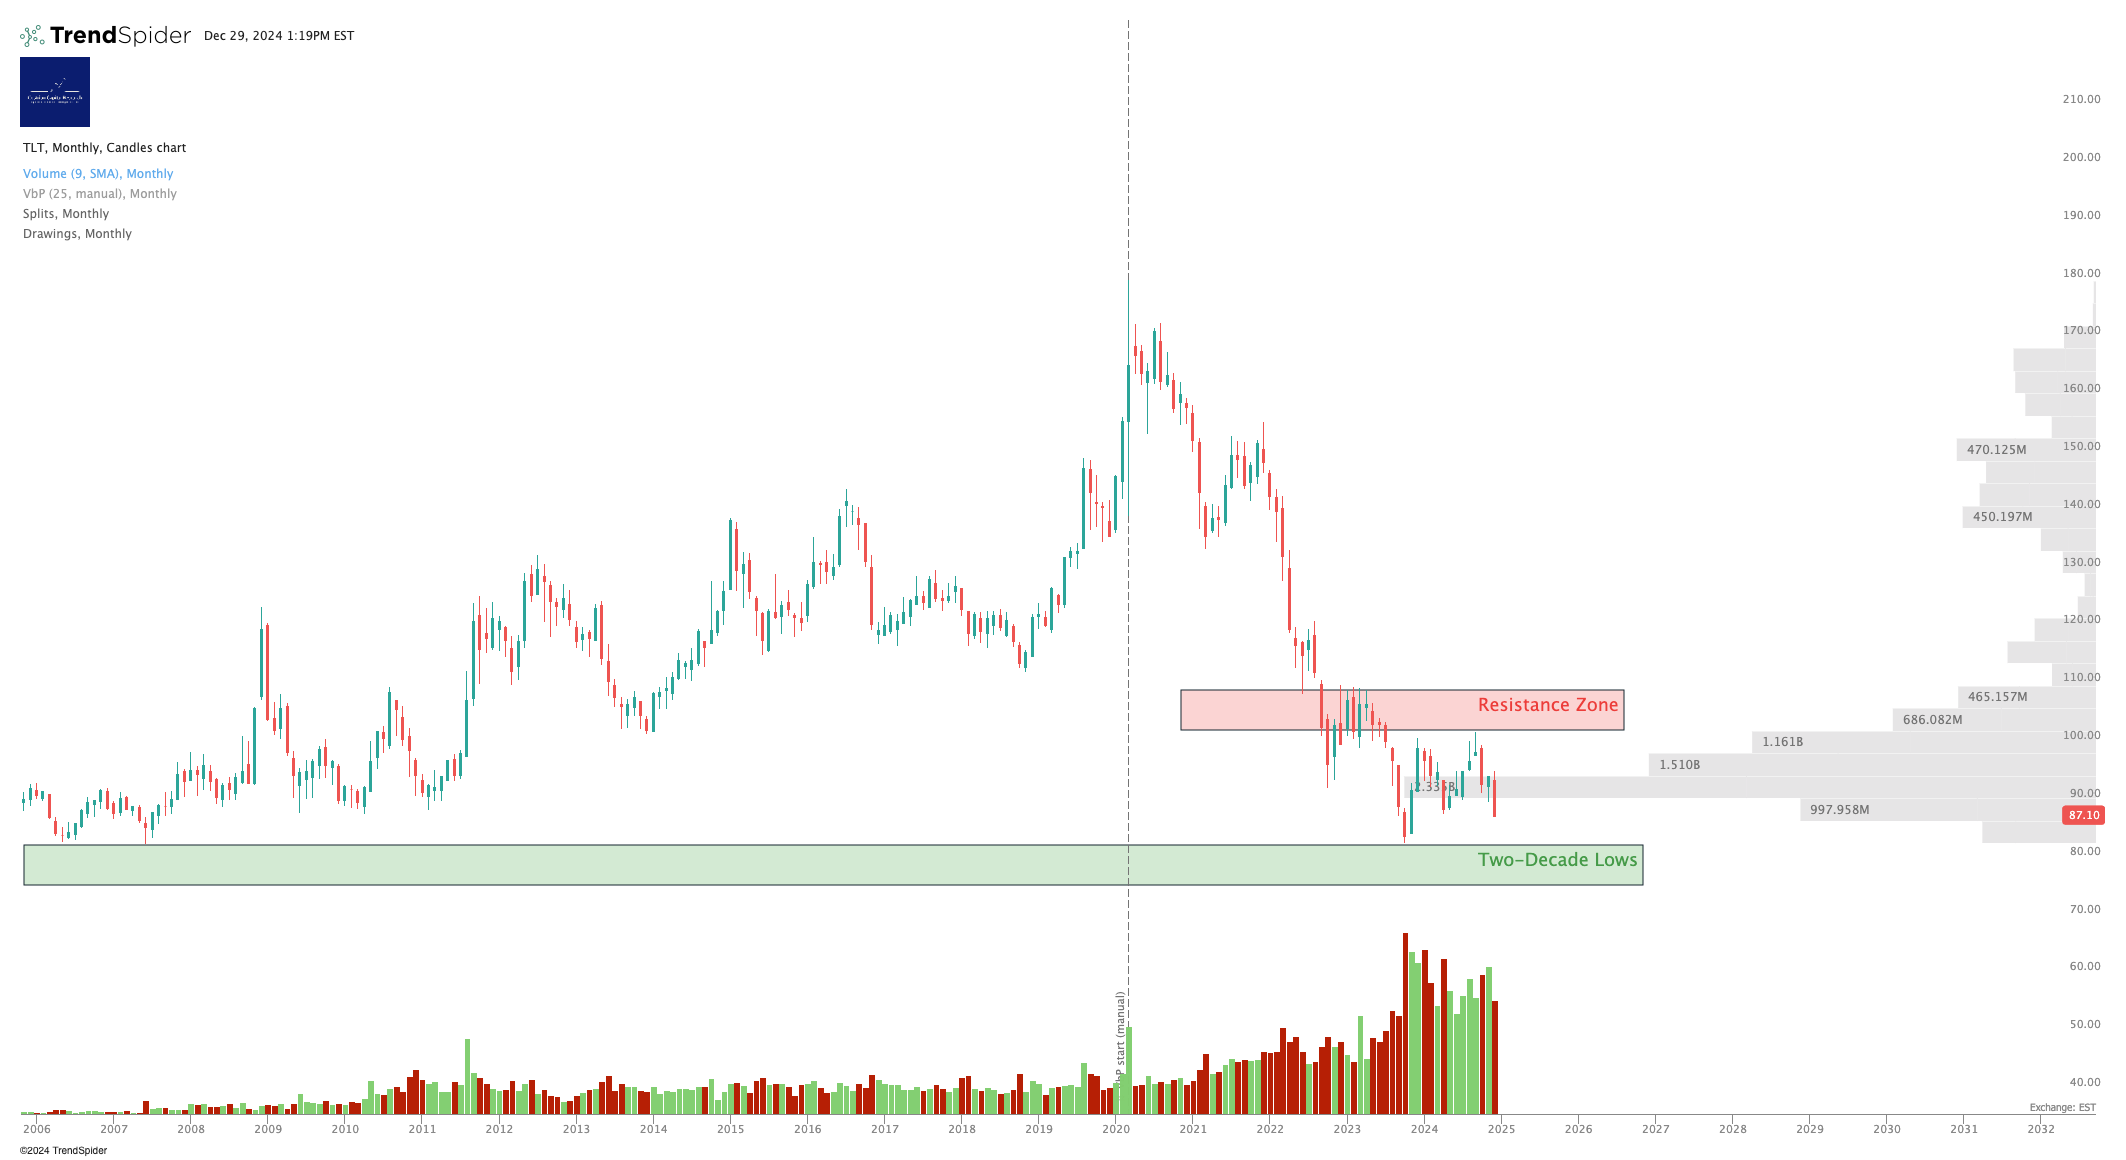
There is a lot of volume down here at the lows, which I believe to be both short-covering and accumulation in anticipation of some sort of drop in the yield and consequent move up in bonds. A break of let's say $80 to the downside would render this opinion bunk.
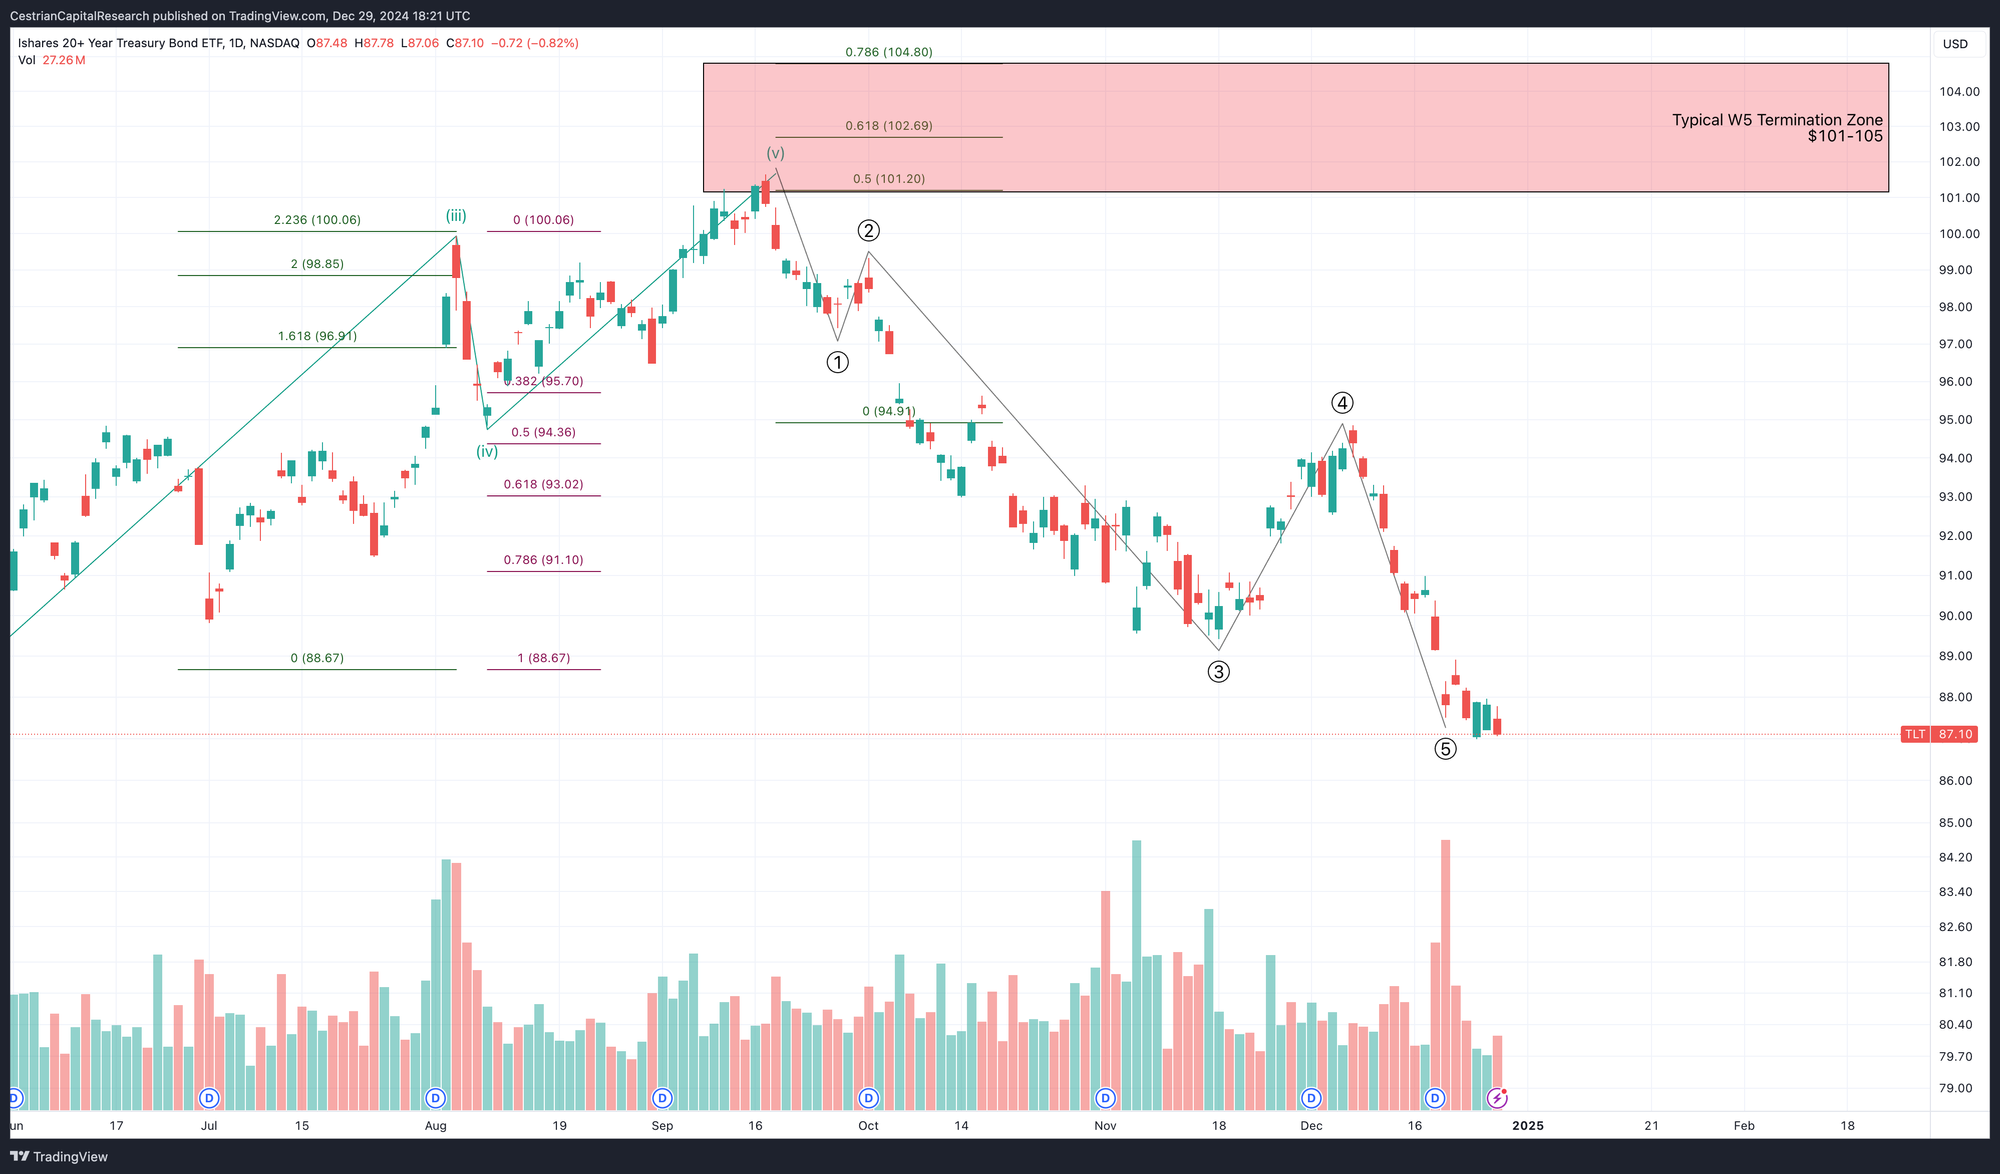
Also looks like a potential bottoming; the risk-averse investor would wait to see if a new Wave 1 up is put in on this timeframe, followed by a Wave 2 down holding at a typical retracement level; and at that point go long TLT to ride the potential Wave 3 up.
Note - Leveraged ETF. Read the fund documentation if you are considering using this instrument.
The aggressive investor would now YOLO and/or "full port" $TMF with a proximate stop.
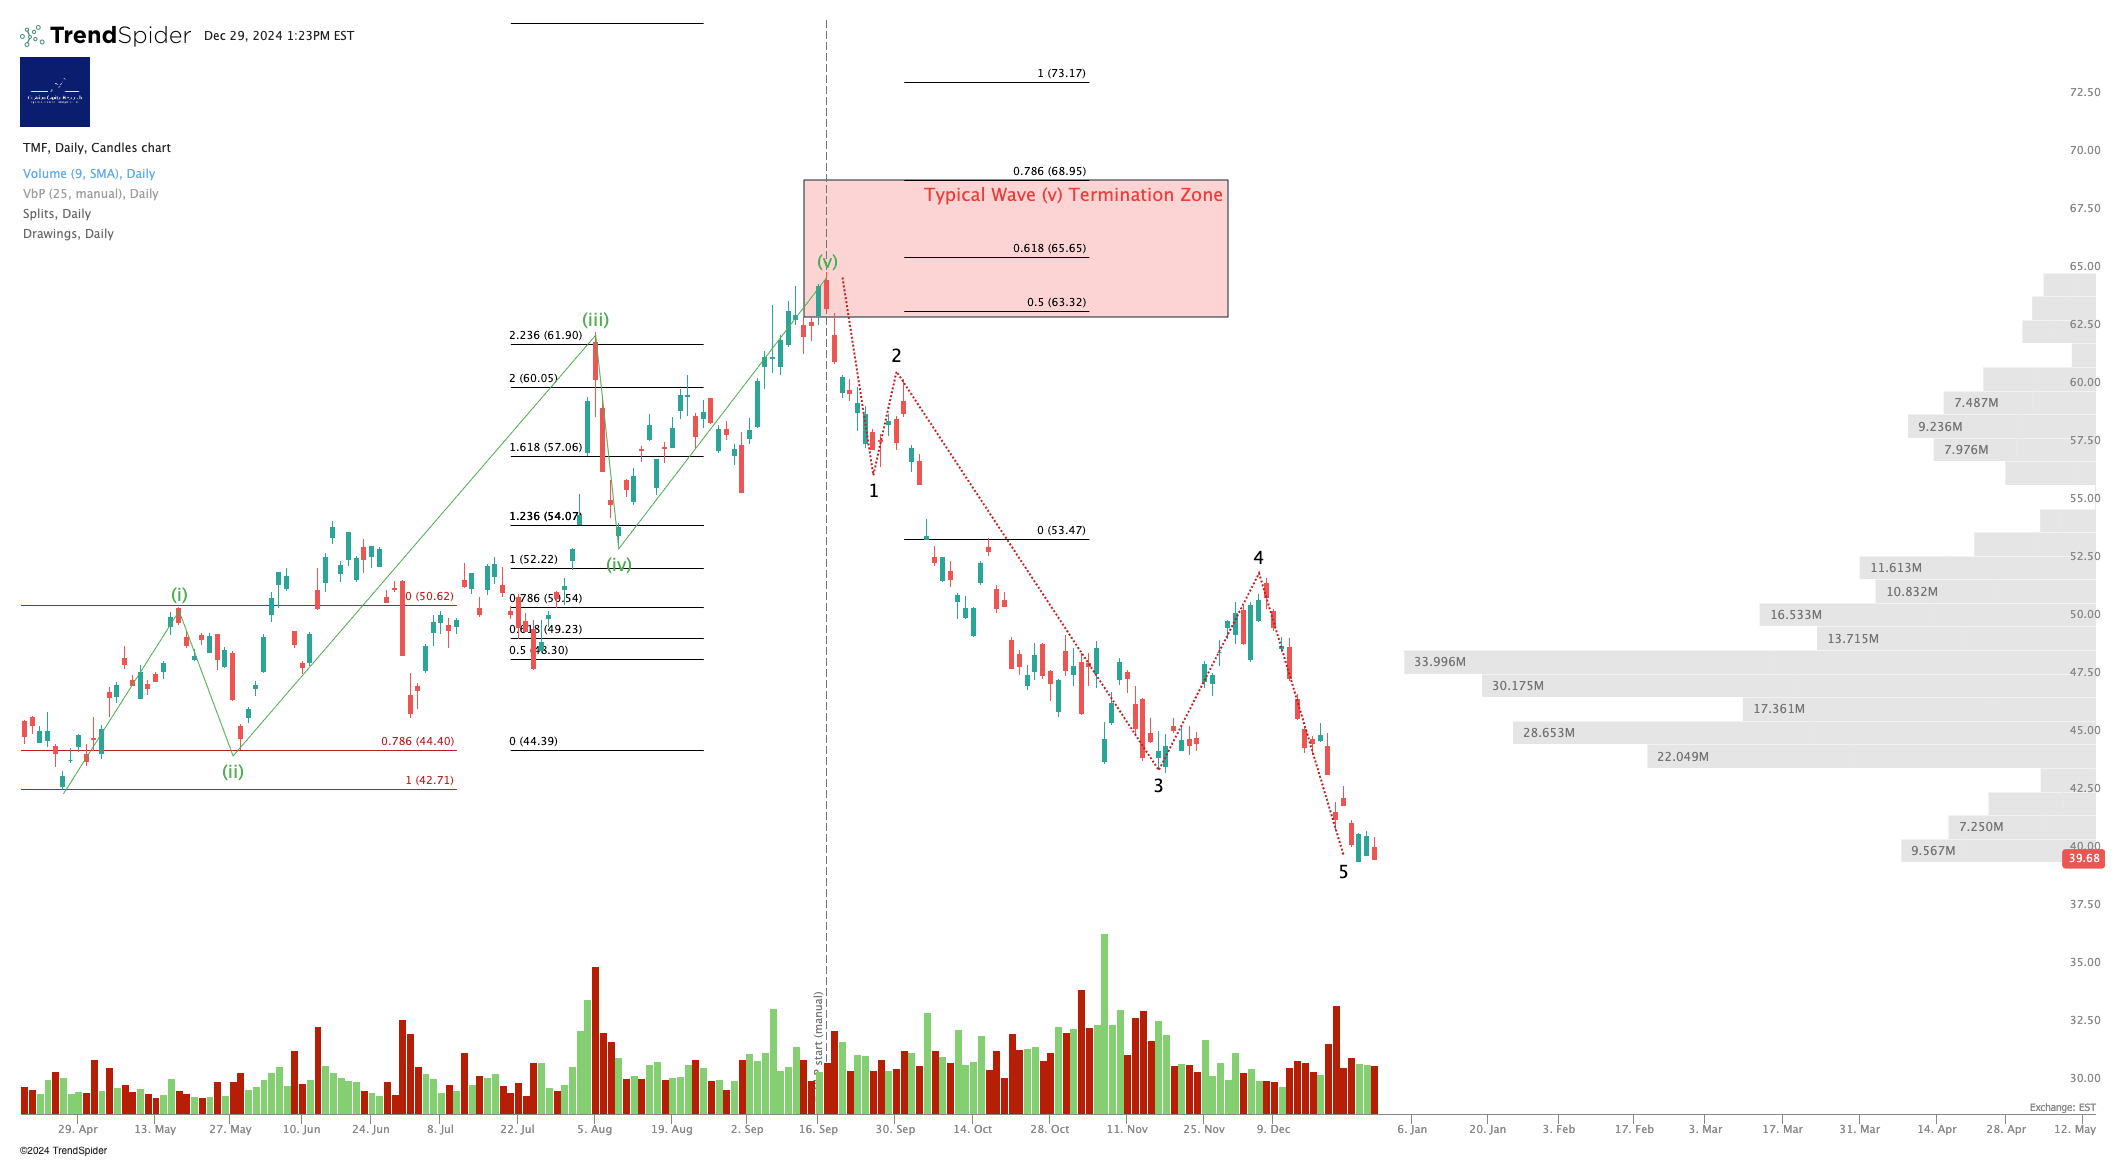
Disclosure: I am unhedged long $TLT and similar EU UCITS ETFs, and unhedged long $TMF. (Appropriately sized!).
Oil (USO / WTI / UCO)
That is a wedge pattern, and I absolutely hate wedge patterns because, well, I don't know which way they are going to break. So for me I am just scalping little bits of gains in oil between the upper and lower trendlines. I took the most recent set of modest gains last week. Currently no position.
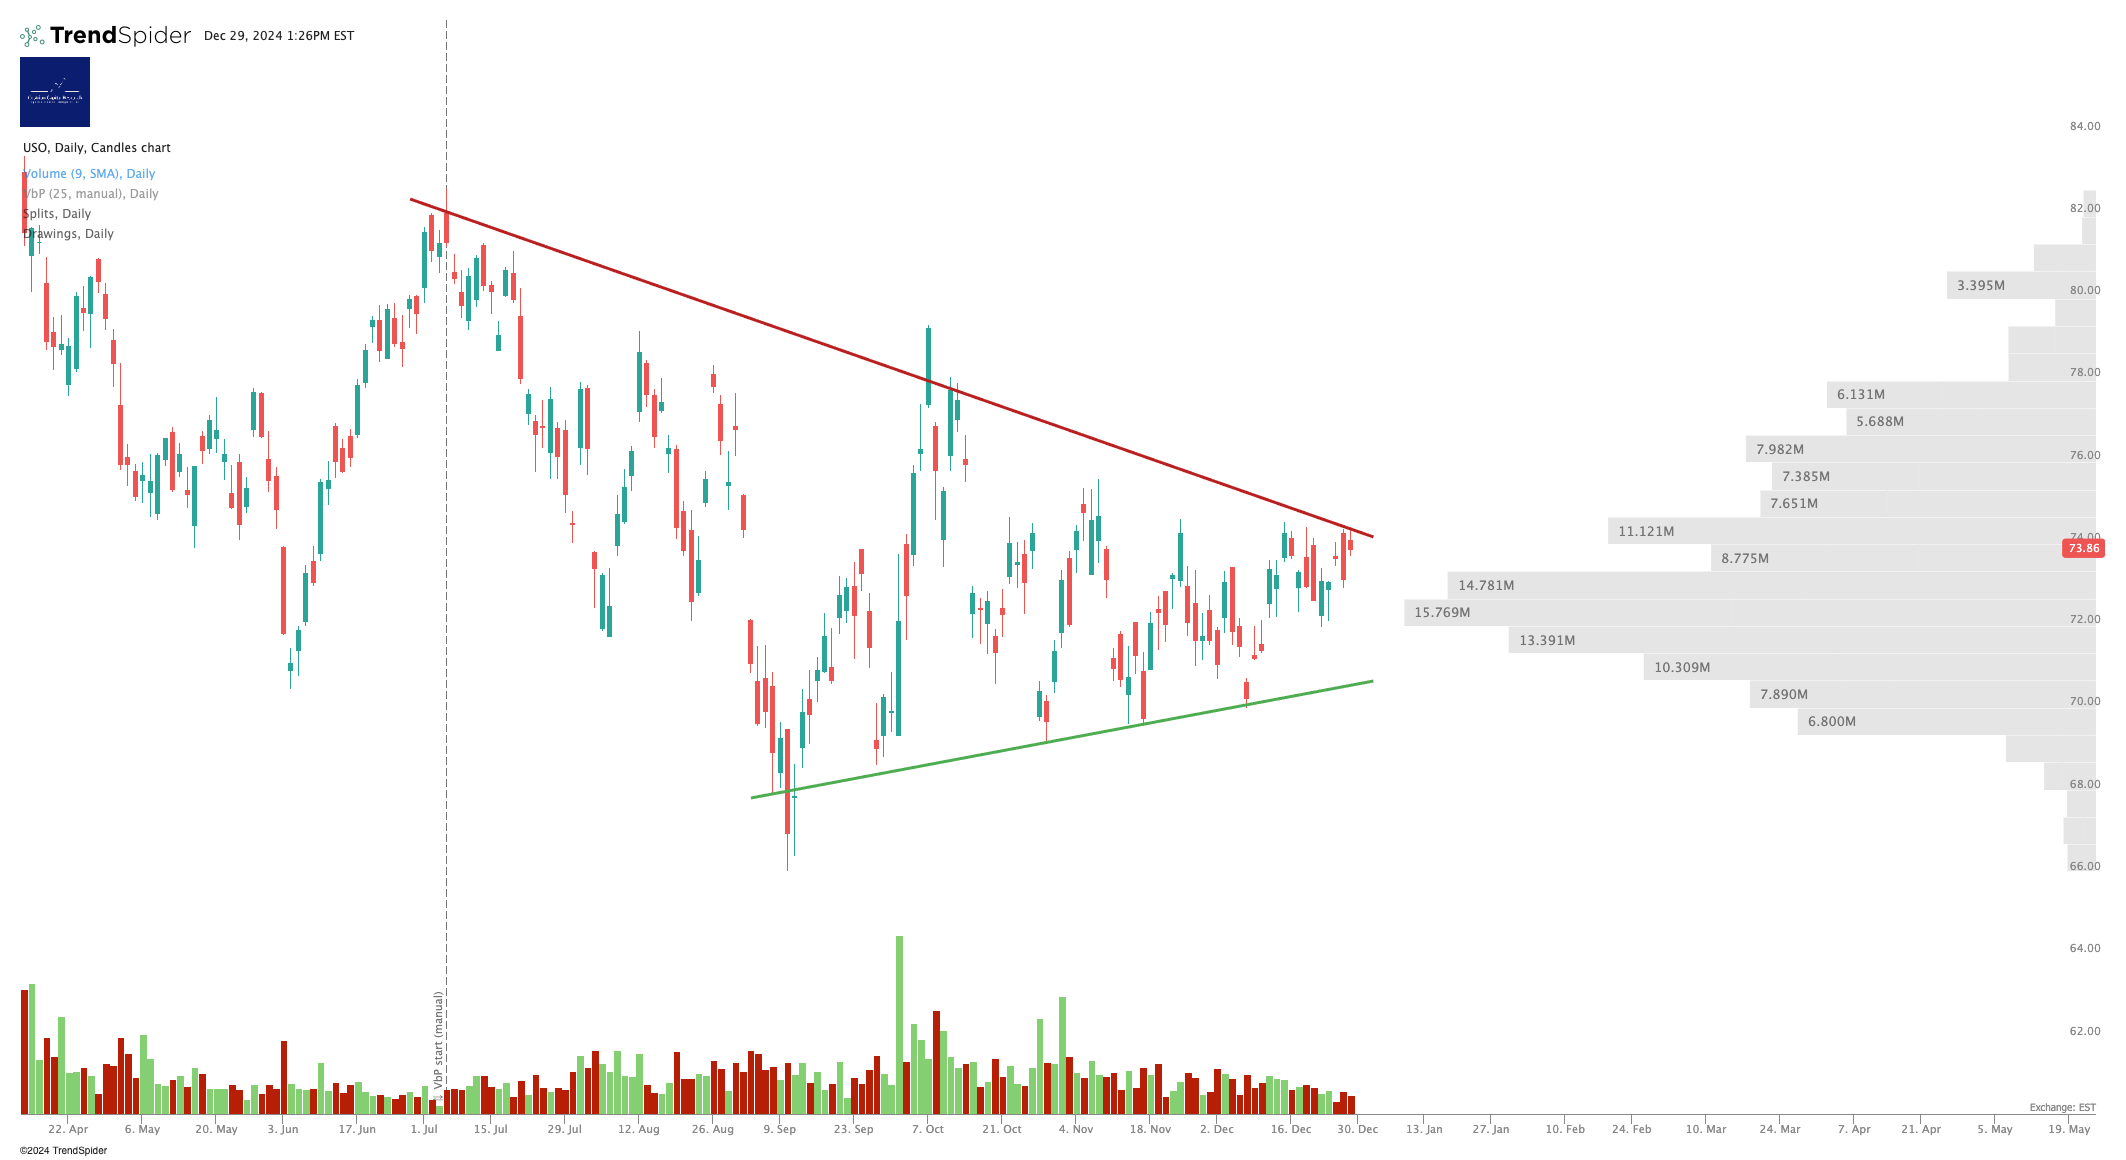
So here's one source of confusion in the market. Generally speaking, if inflation, bonds bad, oil good. Except it looks like both bonds and oil want to rise. So one of the charts - bonds or oil - is lying. Which one? No idea, and I don't think any Market Bigs have any idea either, since the inflation / deflation story will be policy-driven and, again, nobody quite knows which policies will be implemented nor with what effect at this stage. This once more causes me to lean towards just trying to bag small gains here and there rather than swinging for the fences.
Here's a potential bullish pattern for oil by the way.
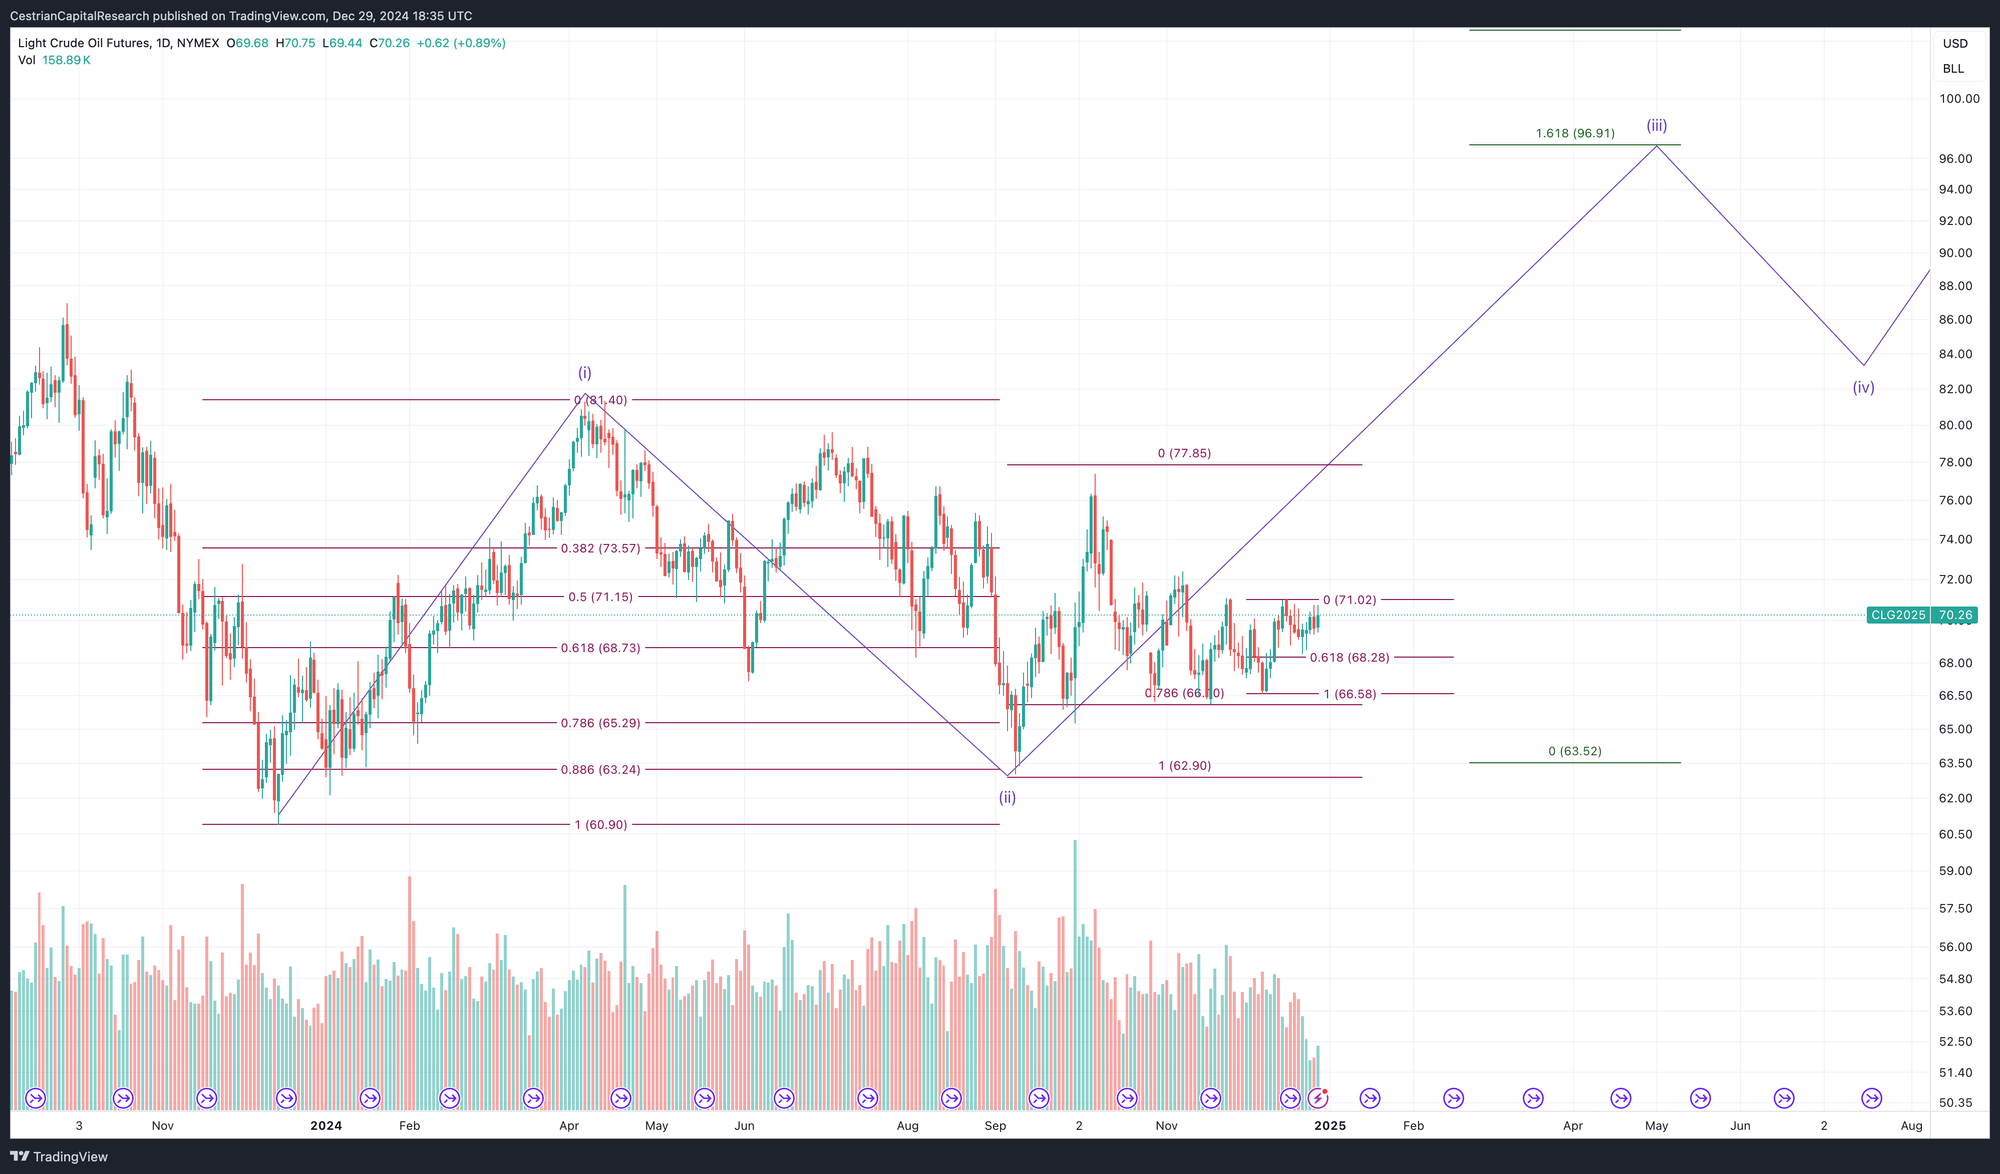
Note - Leveraged ETF. Read the fund documentation if you are considering using this instrument.
For the brave! $SCO can be used to hedge this one.
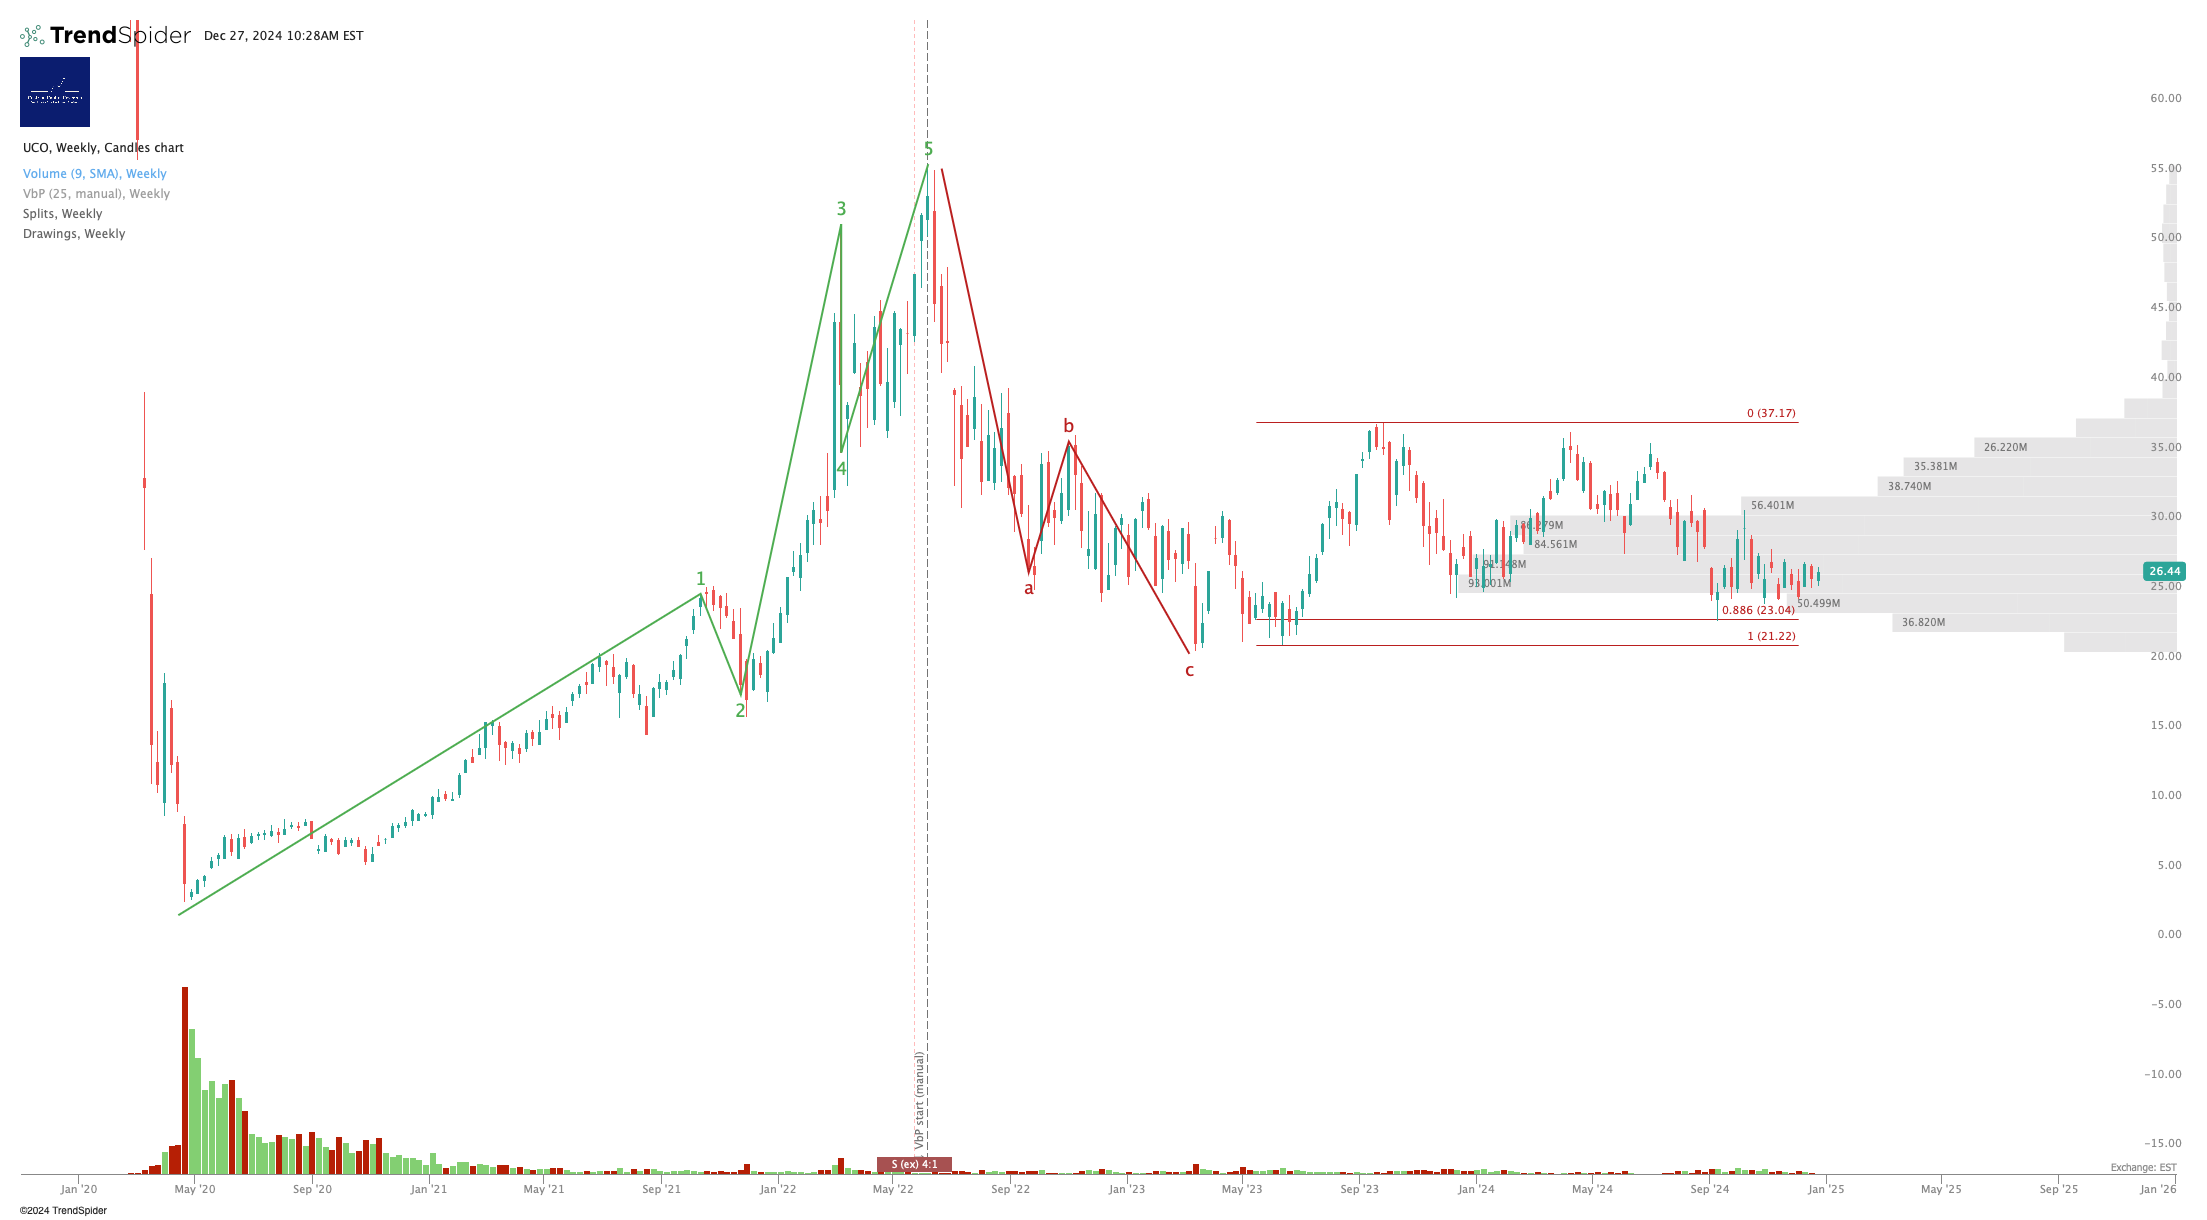
Disclosure: No position in oil.
S&P500 / SPY / ES / UPRO
Over $609, bullish, below, bearish. Easy.
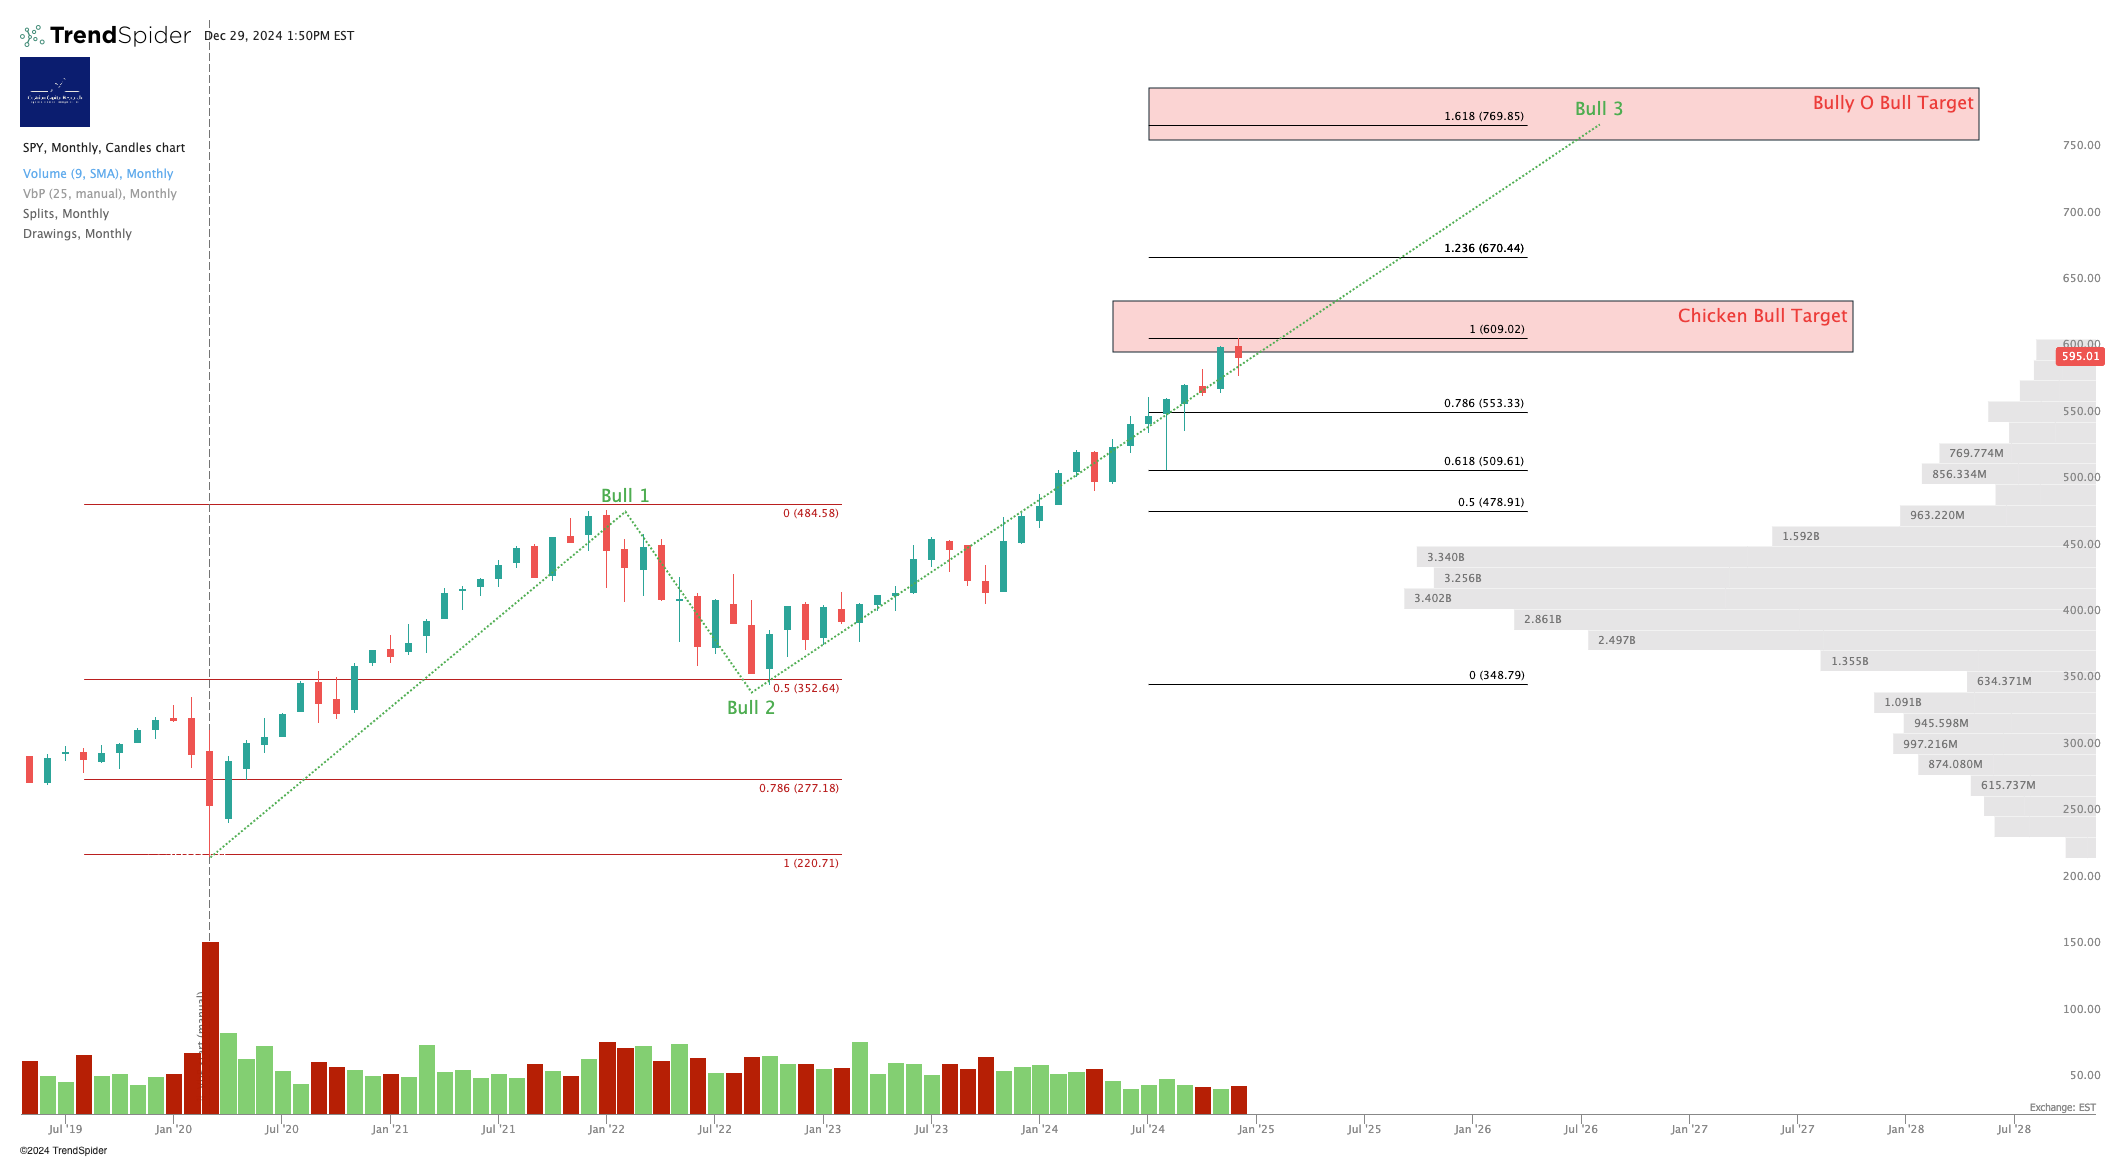
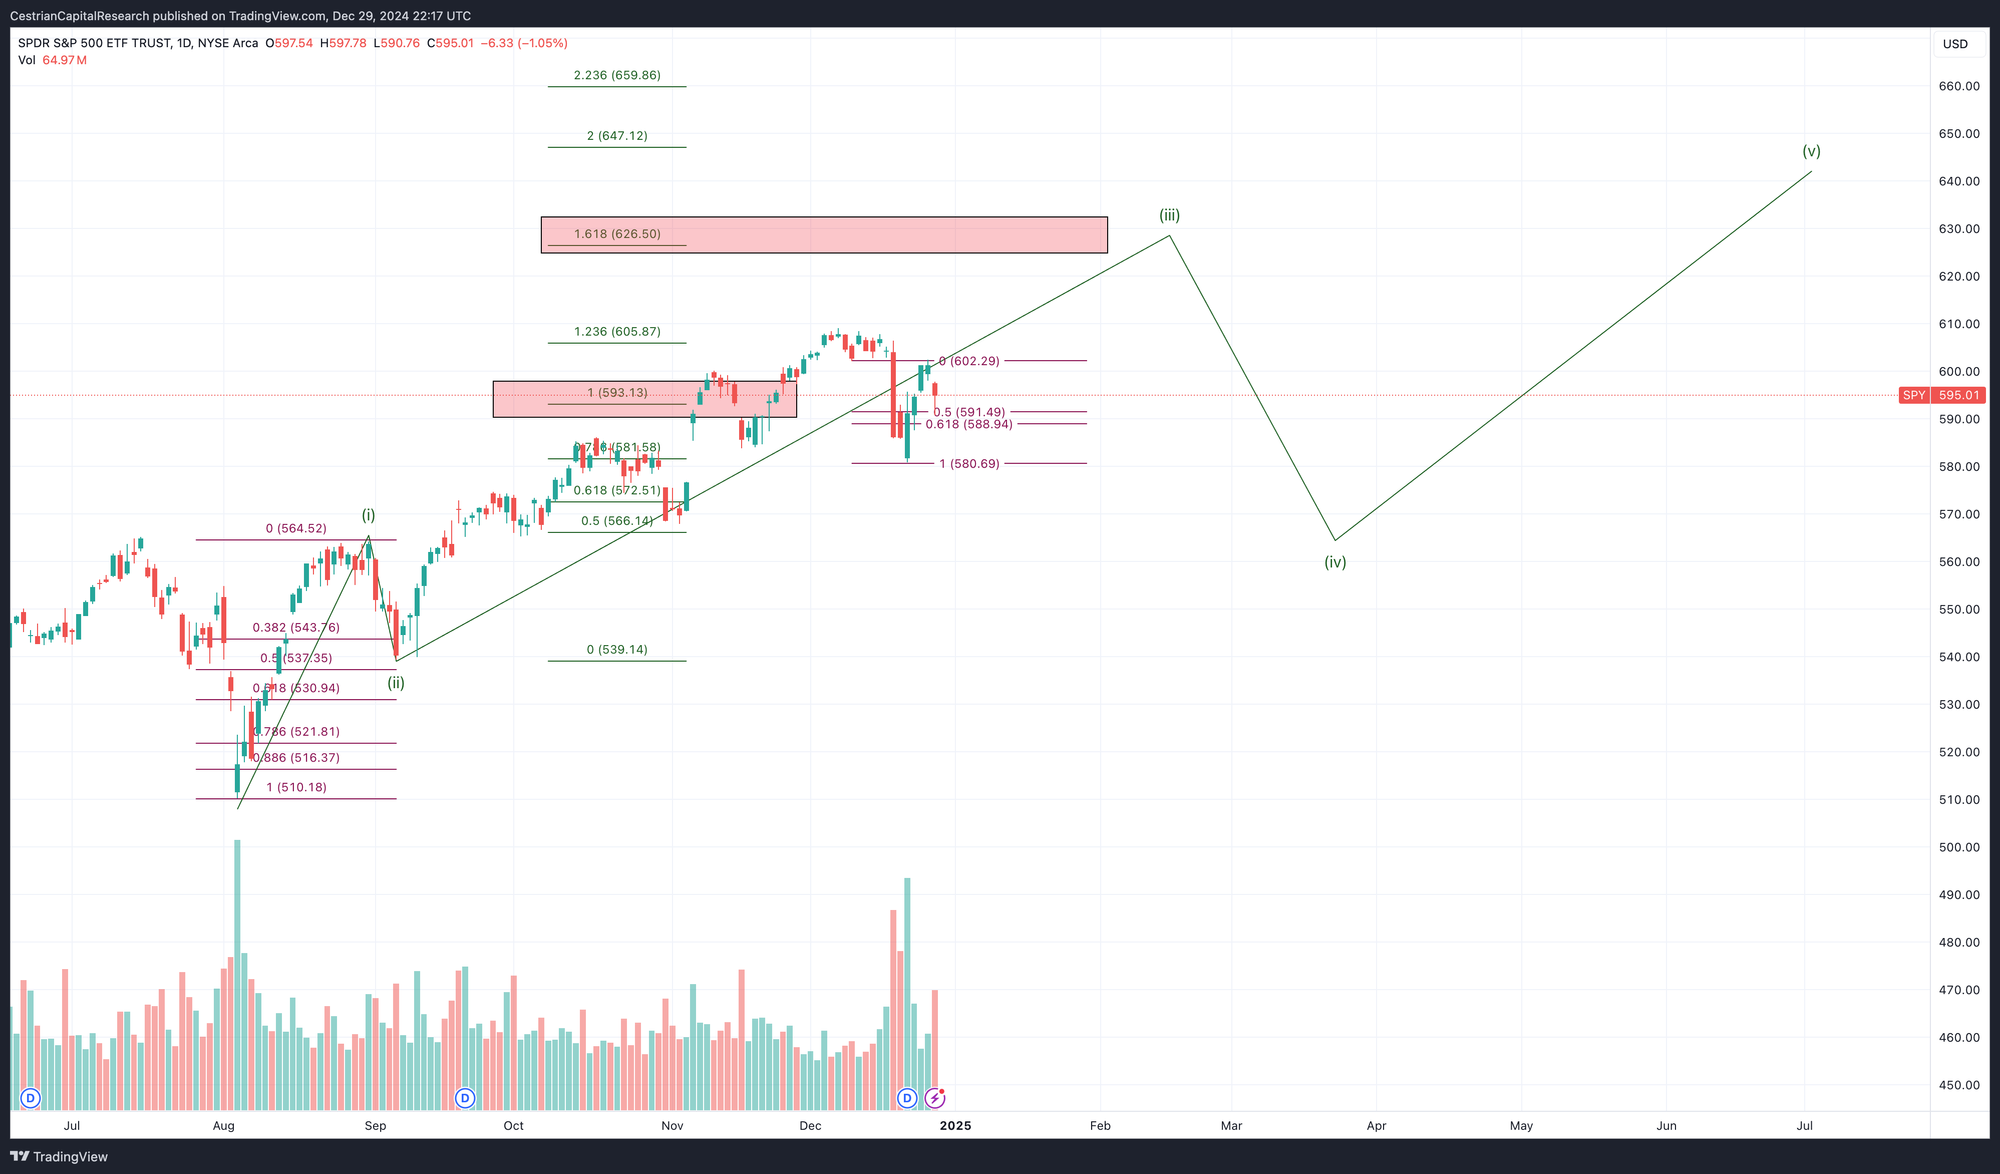
Currently retracing the gains since the FOMC low. Friday saw $SPY bounce at the 50% retracement of that post FOMC move up. It's possible that marks a local low with a further move up to come. A break below $580 invalidates that idea.
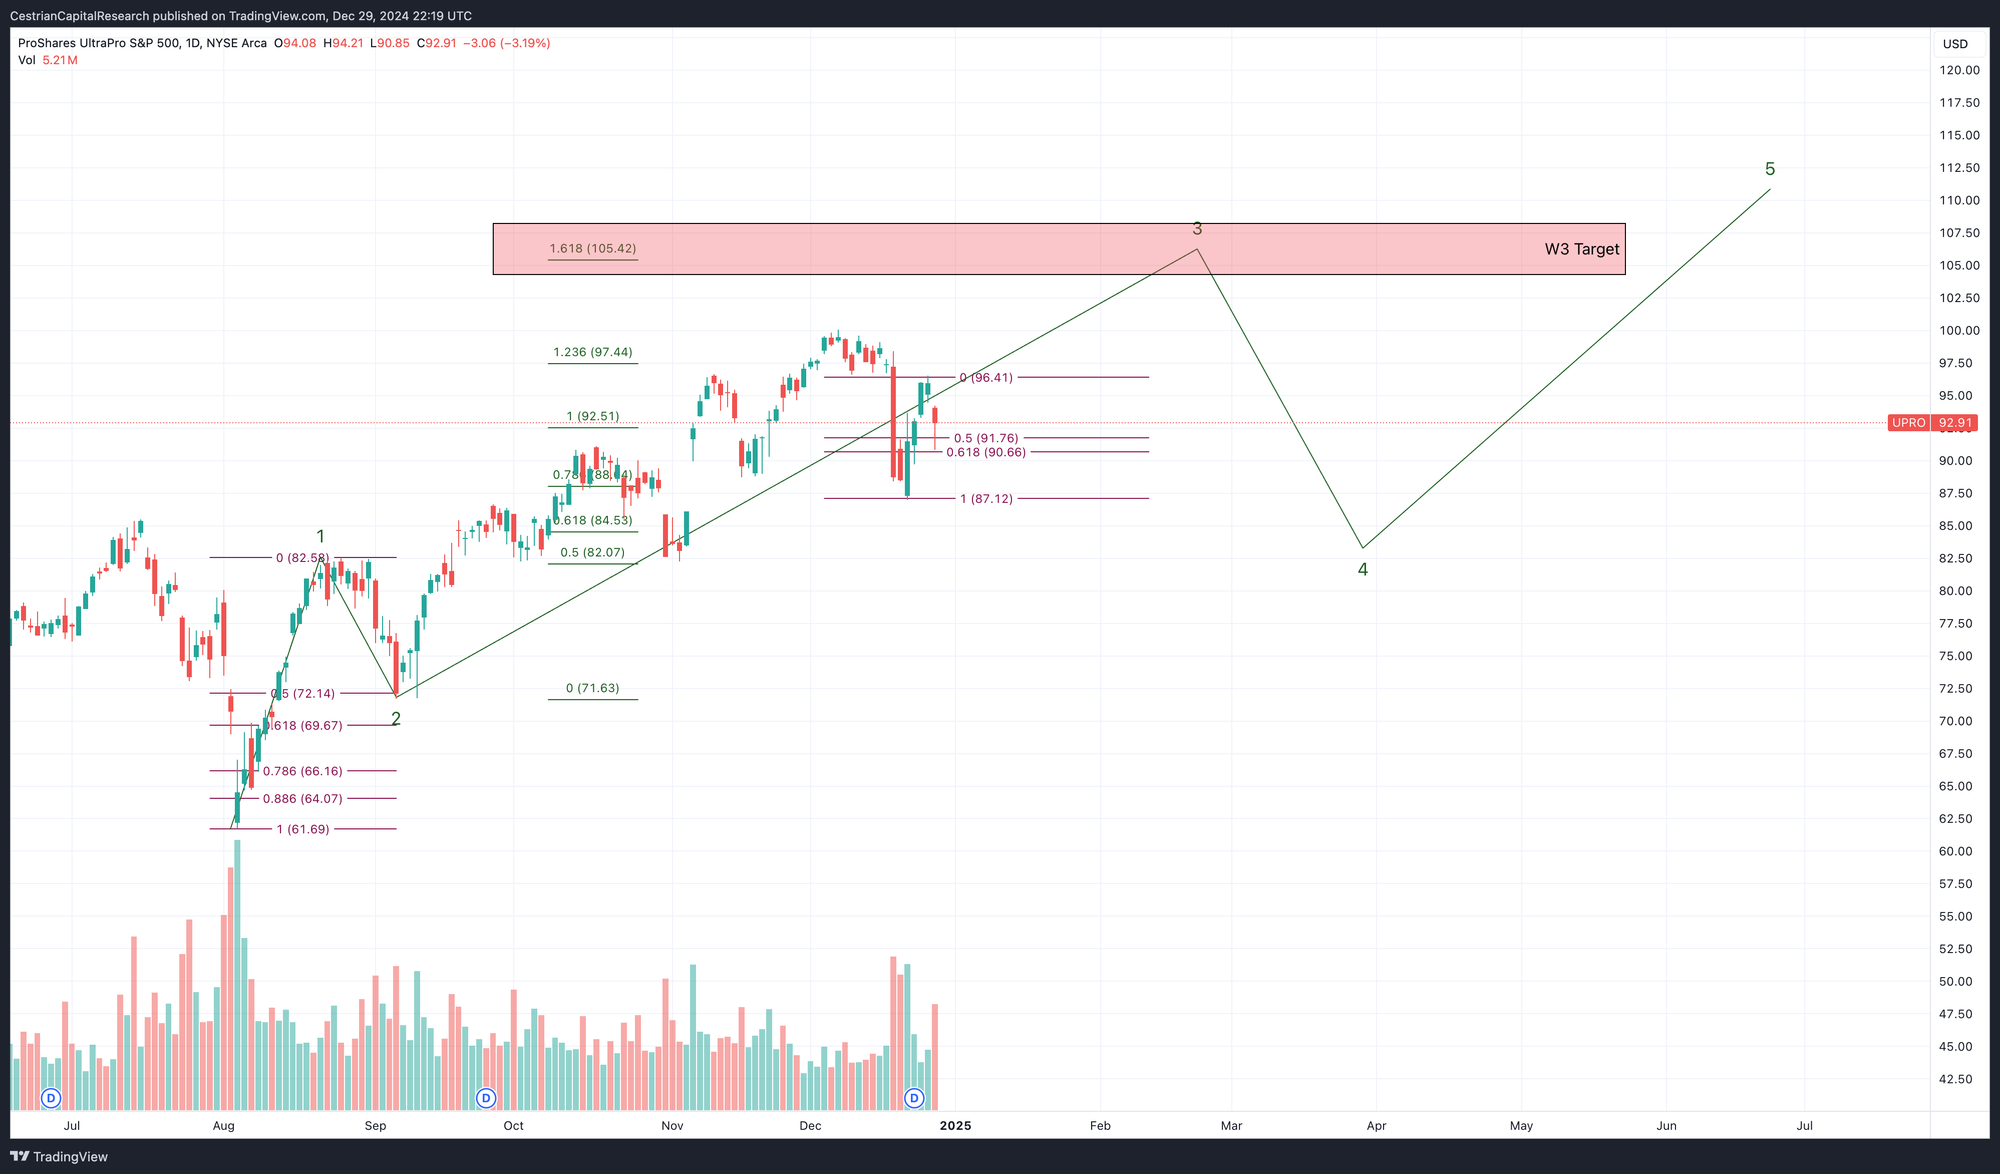
Note - Leveraged ETF. Read the fund documentation if you are considering using this instrument.
UPRO is tracking SPY but, by design, with more over-reaction to the up- and downside. That's why UPRO bounced Friday at the .618 retrace vs. the .5 for SPY.
Disclosure: I am unhedged long $VUAG.
Nasdaq-100 / QQQ / NQ / TQQQ
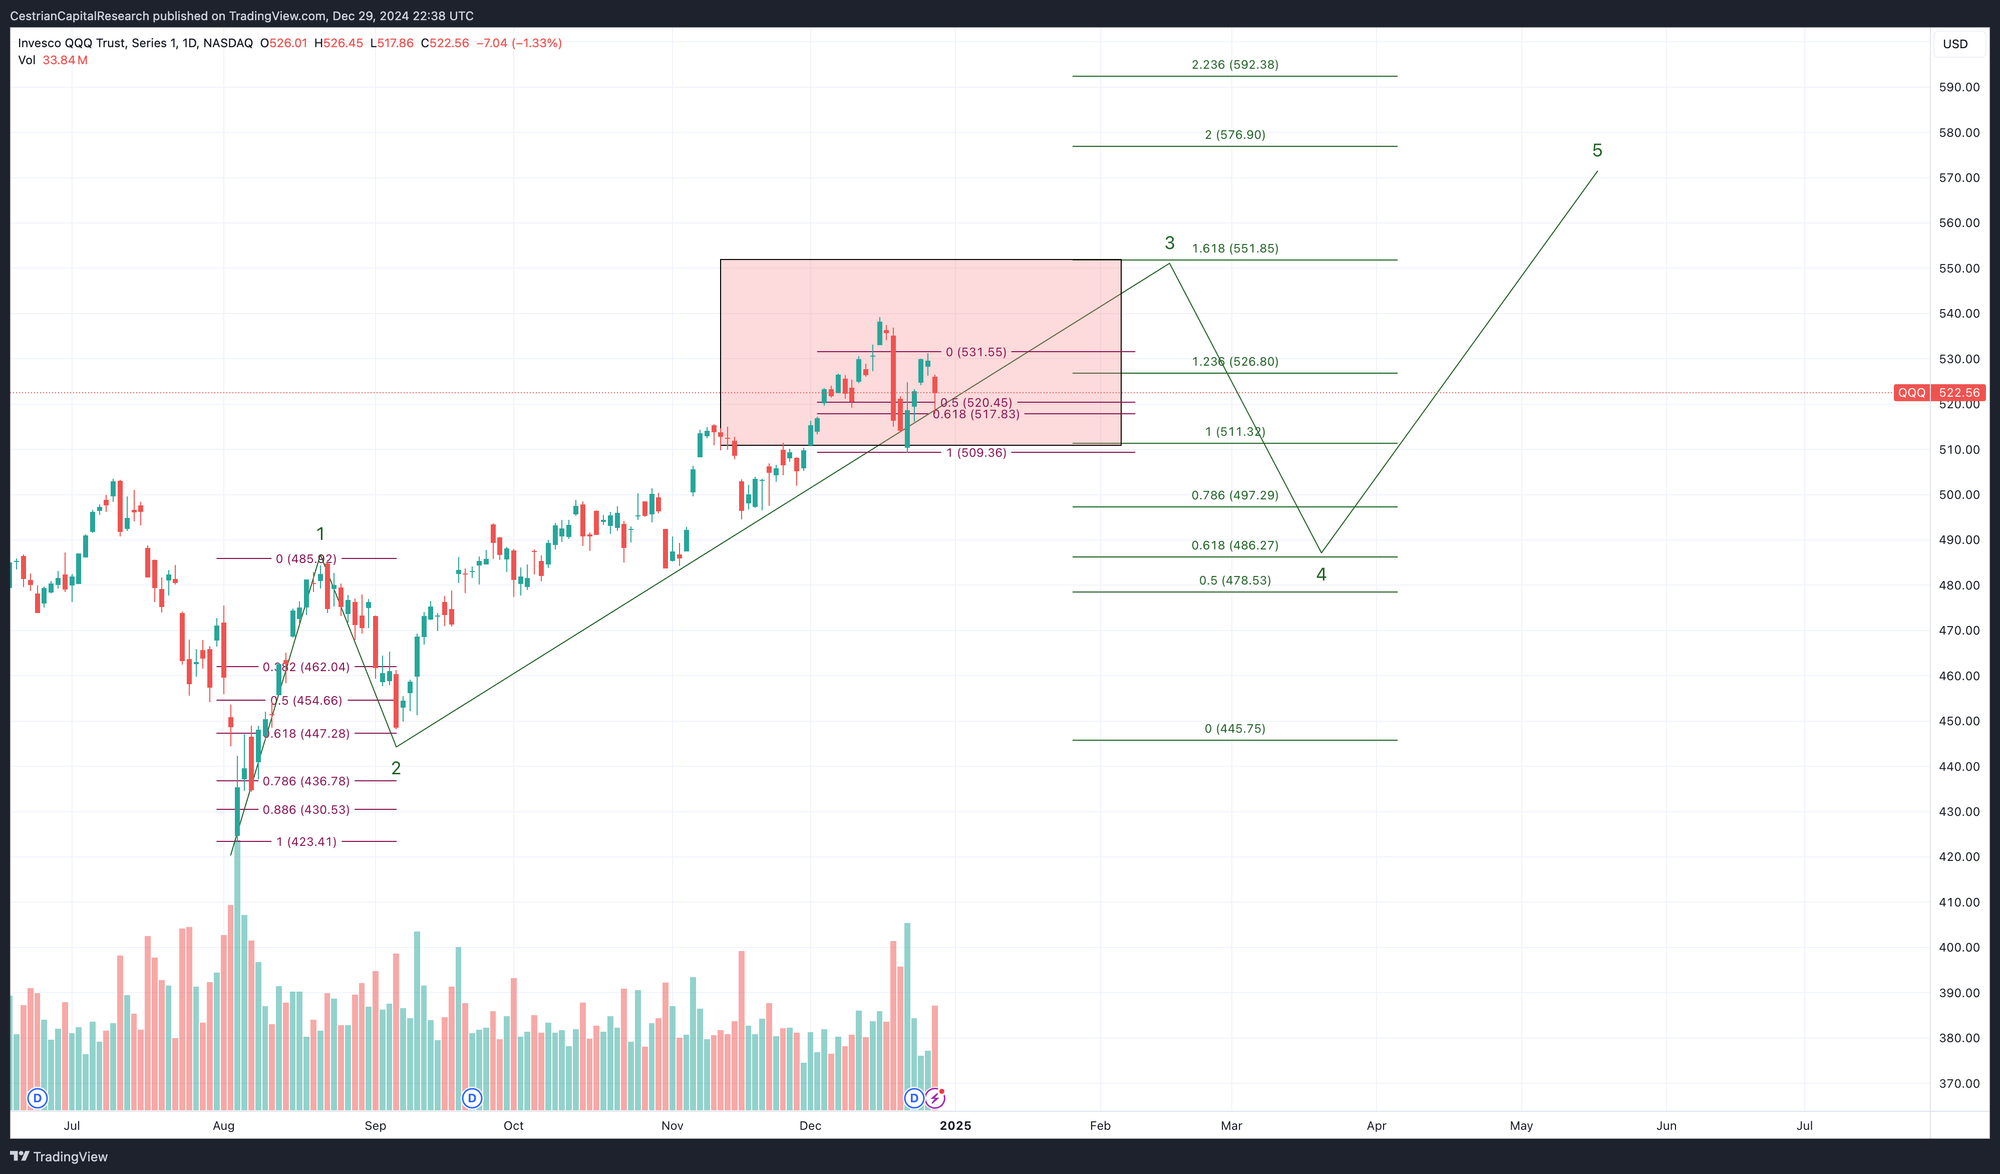
Above $522, bullish, below, bearish. Friday saw a close just over $522.
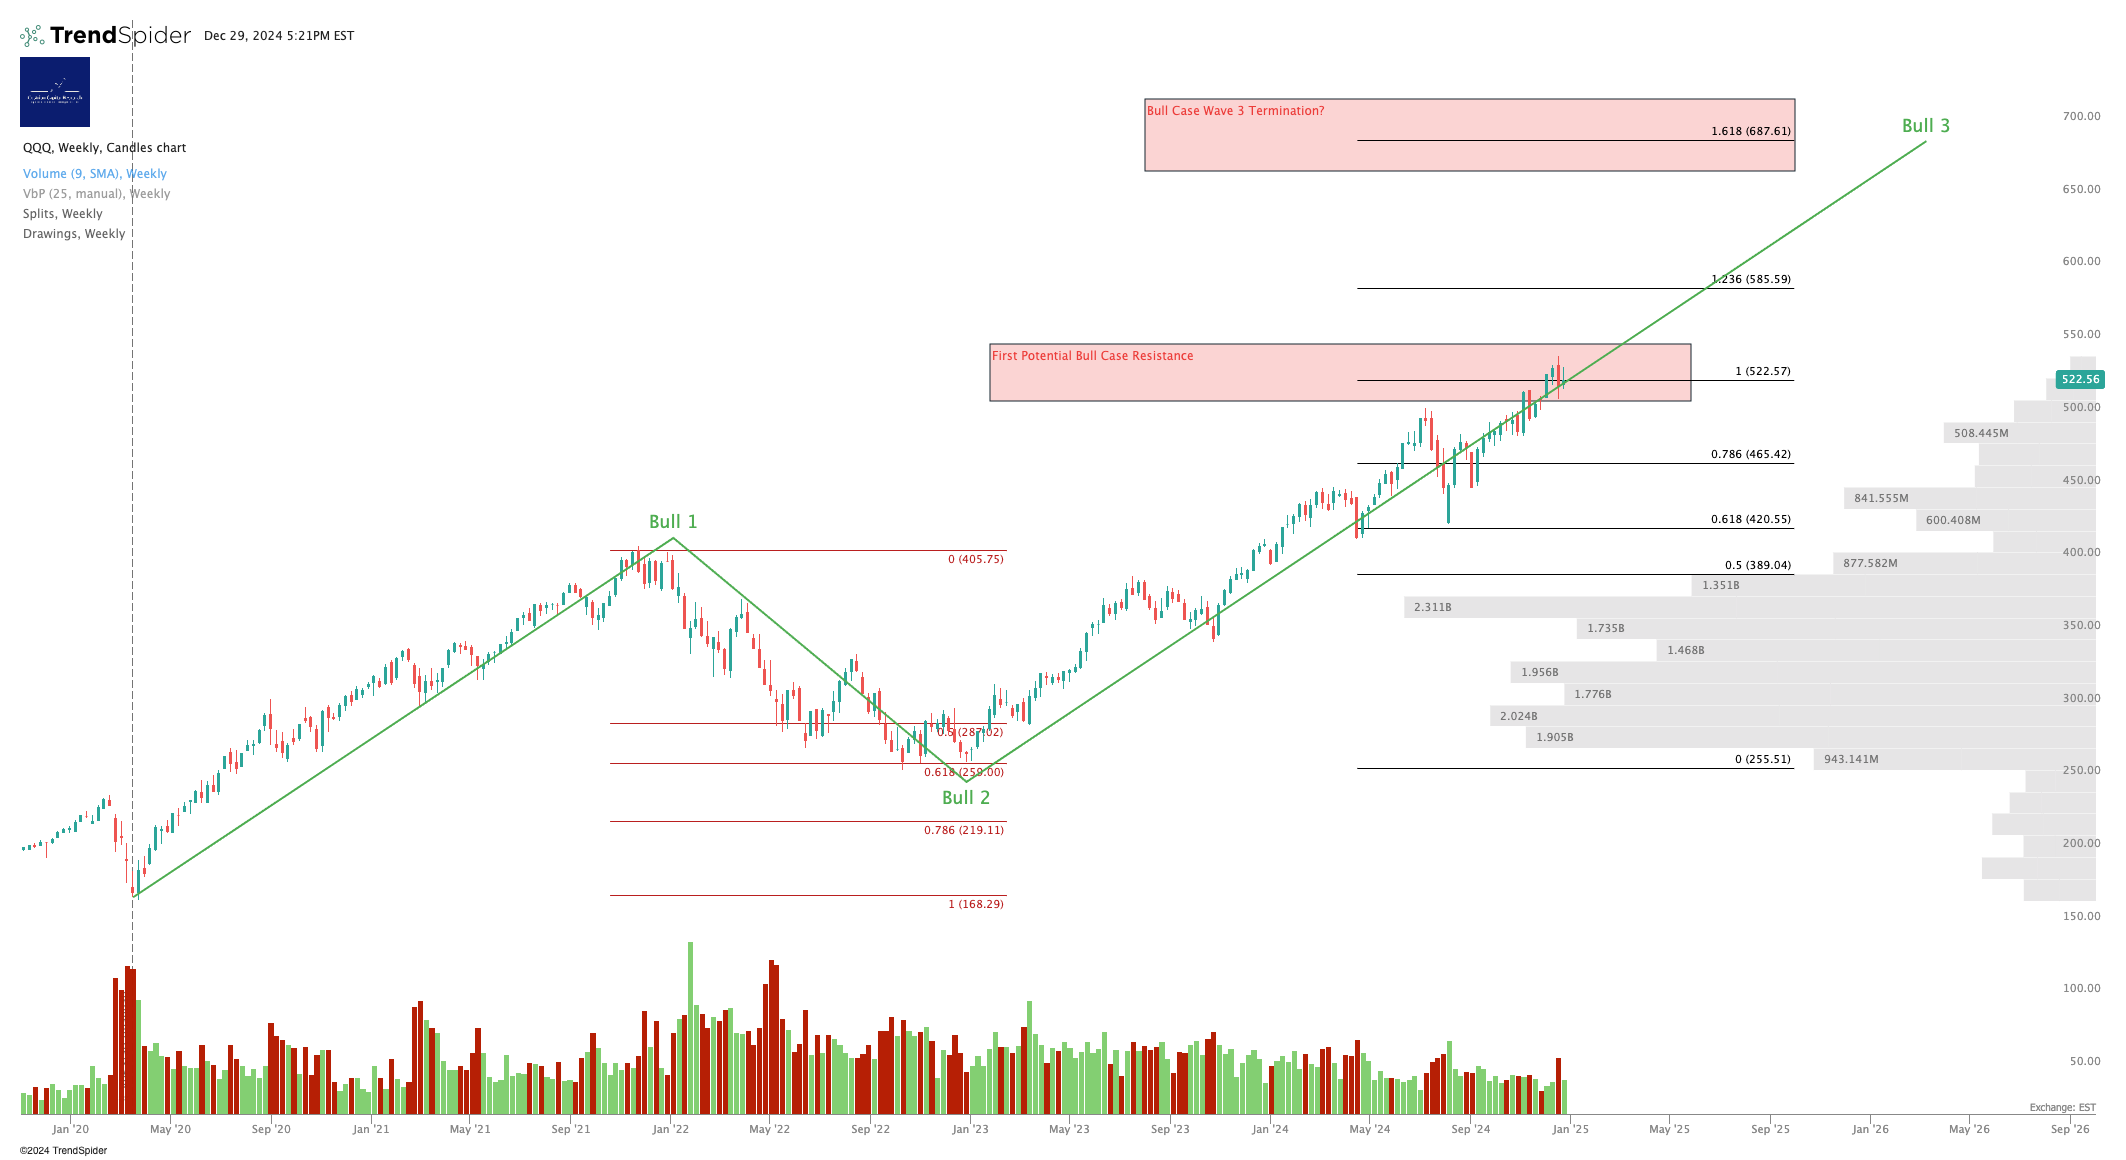
As per SPY, retracing the gains from the post FOMC lows. Bounced at the .618 retrace (QQQ is more volatile than SPY so tends to retrace lower and extend higher during any given move).
Note - Leveraged ETF. Read the fund documentation if you are considering using this instrument.
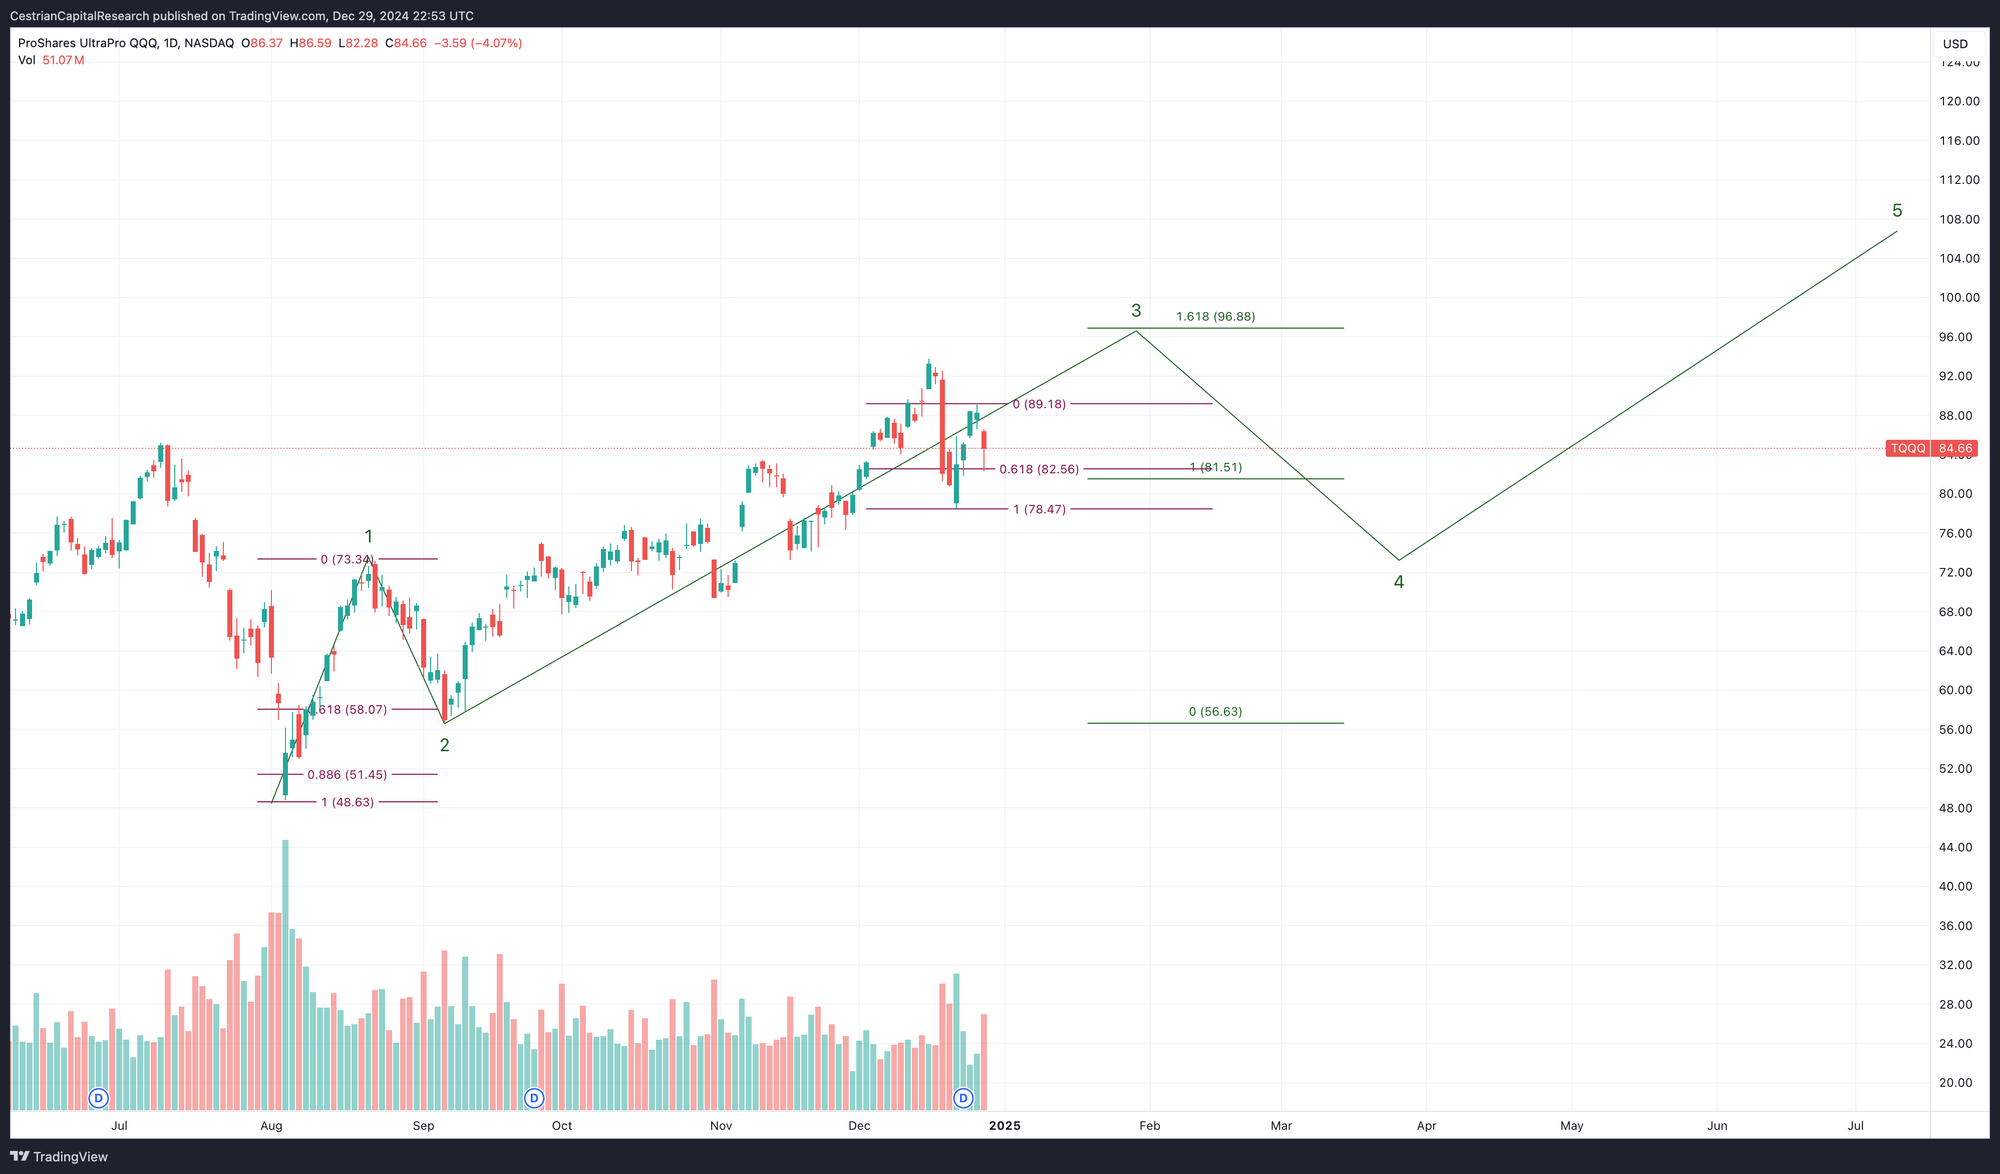
No change. Target $96. Downside to $73 if it keeps falling.
Disclosure: I am unhedged long $TQQQ and unhedged long $CNDX.
Dow Jones / DIA / YM / UDOW
Target $474. Currently $430. Volume shelf support in the high $300s.
The bear argument, by the way, is that the Dow has already topped and the S&P and Nasdaq aren't too far behind. That seems too bearish to me, but let's see. If the Dow reclaims new highs in the near term, bullish all around; if we get a move back up, but it can't make new highs, that's a warning shot for equities at large.
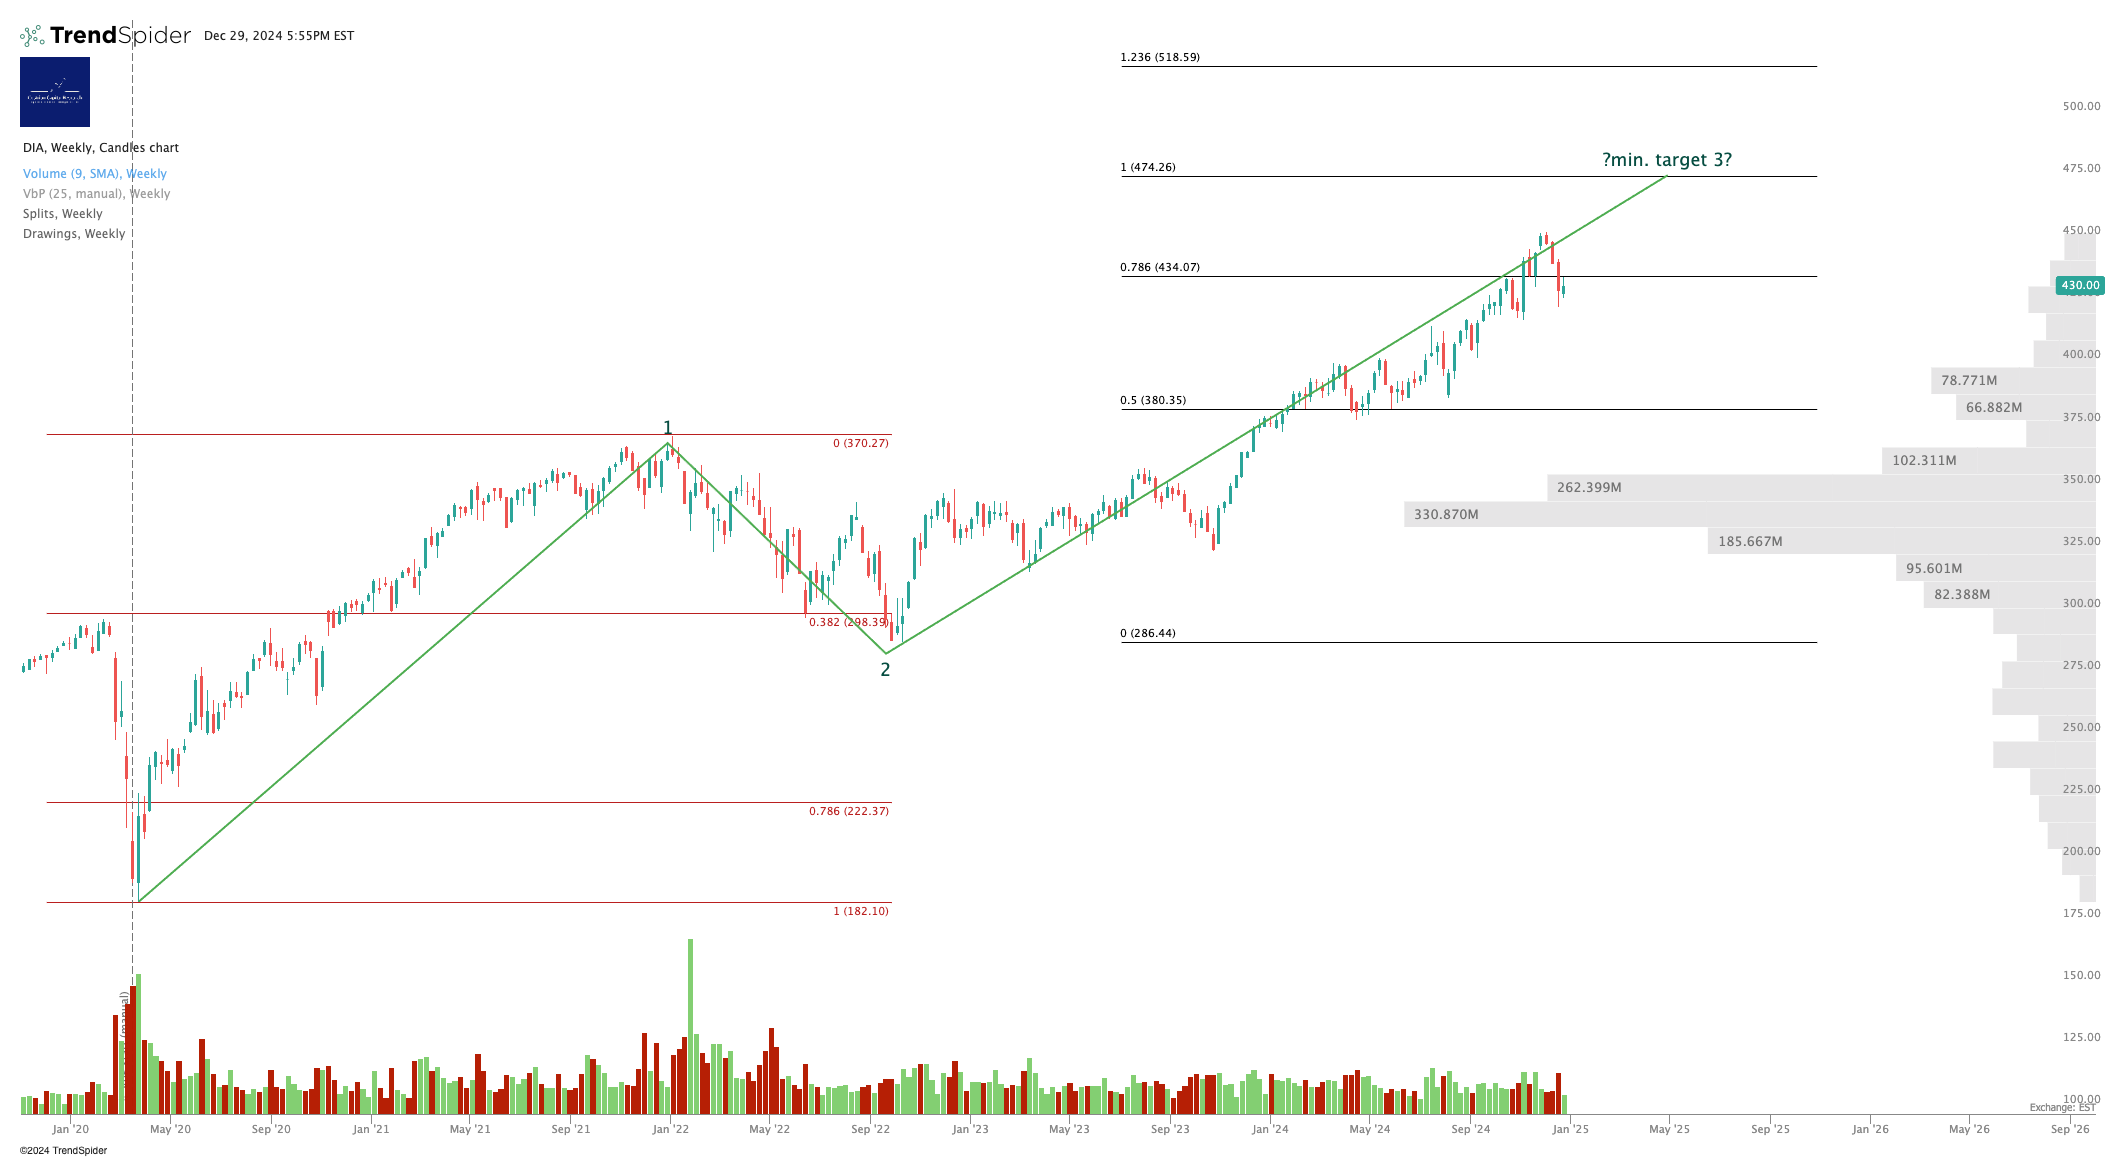
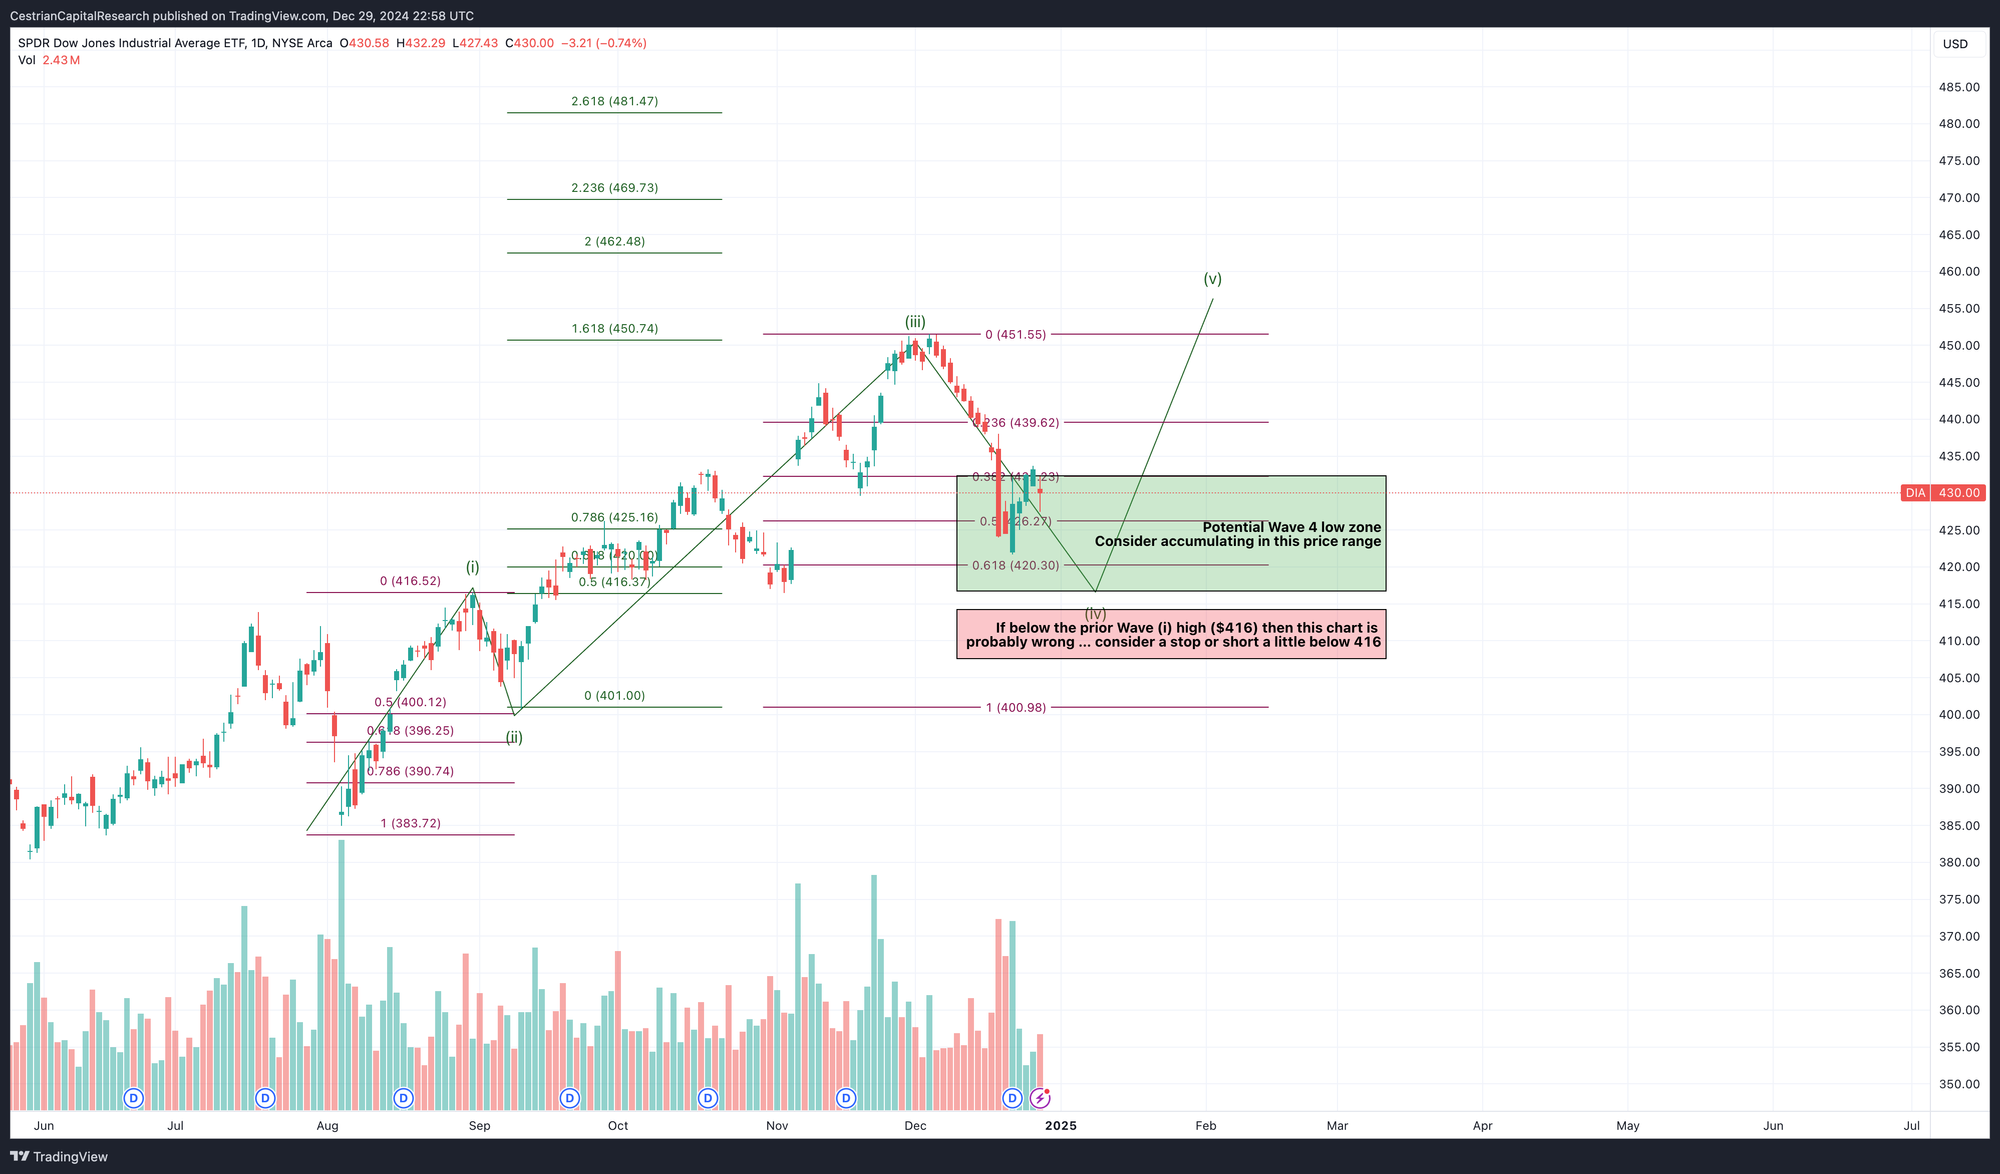
No change. For this to resolve in a bullish manner, DIA needs to break up and over $434 and hold that as support.
Note - Leveraged ETF. Read the fund documentation if you are considering using this instrument.
UDOW has to move up and hold over $102 for this to resolve in a bullish manner.
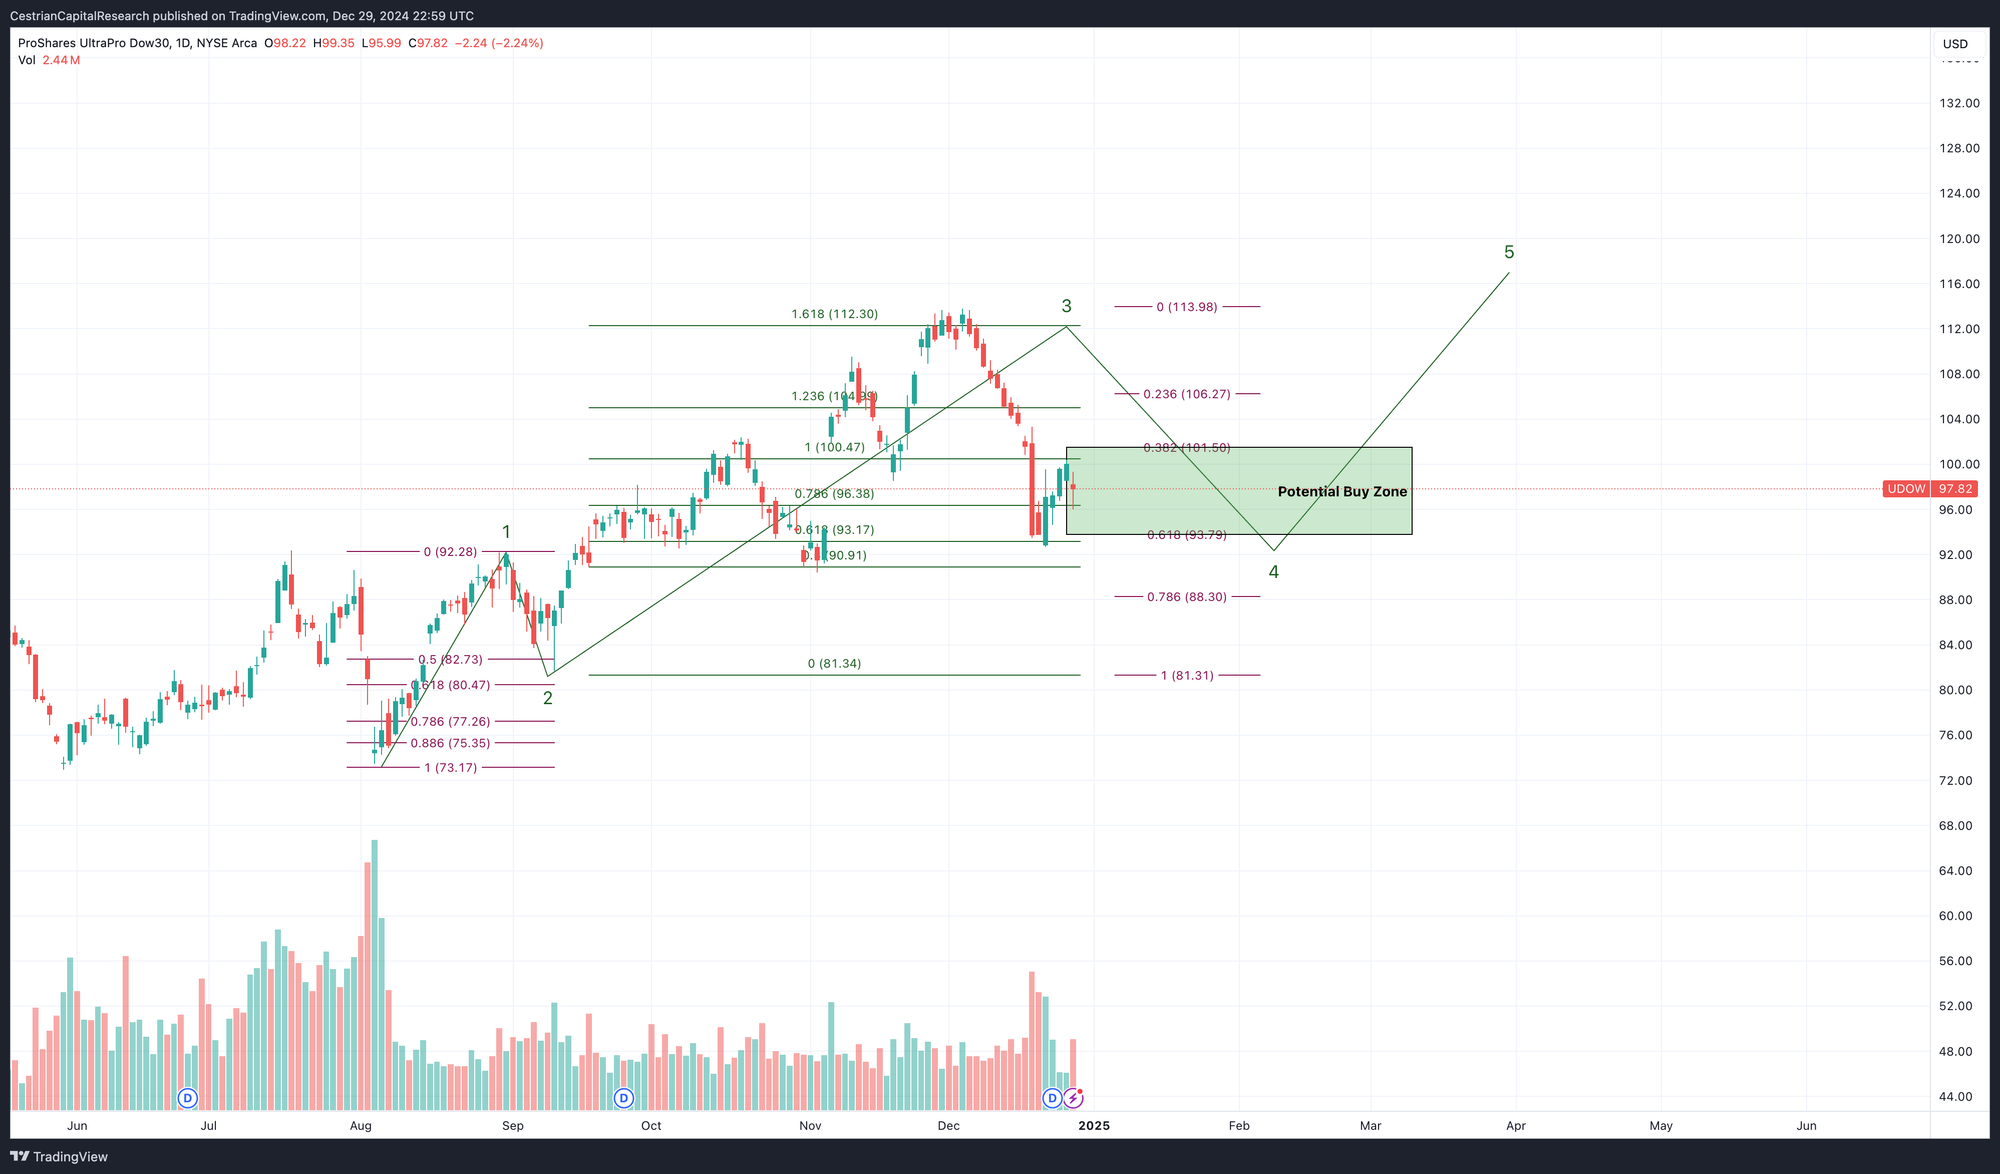
Disclosure: I am unhedged long $UDOW
Russell 2000 / IWM / RTY / TNA
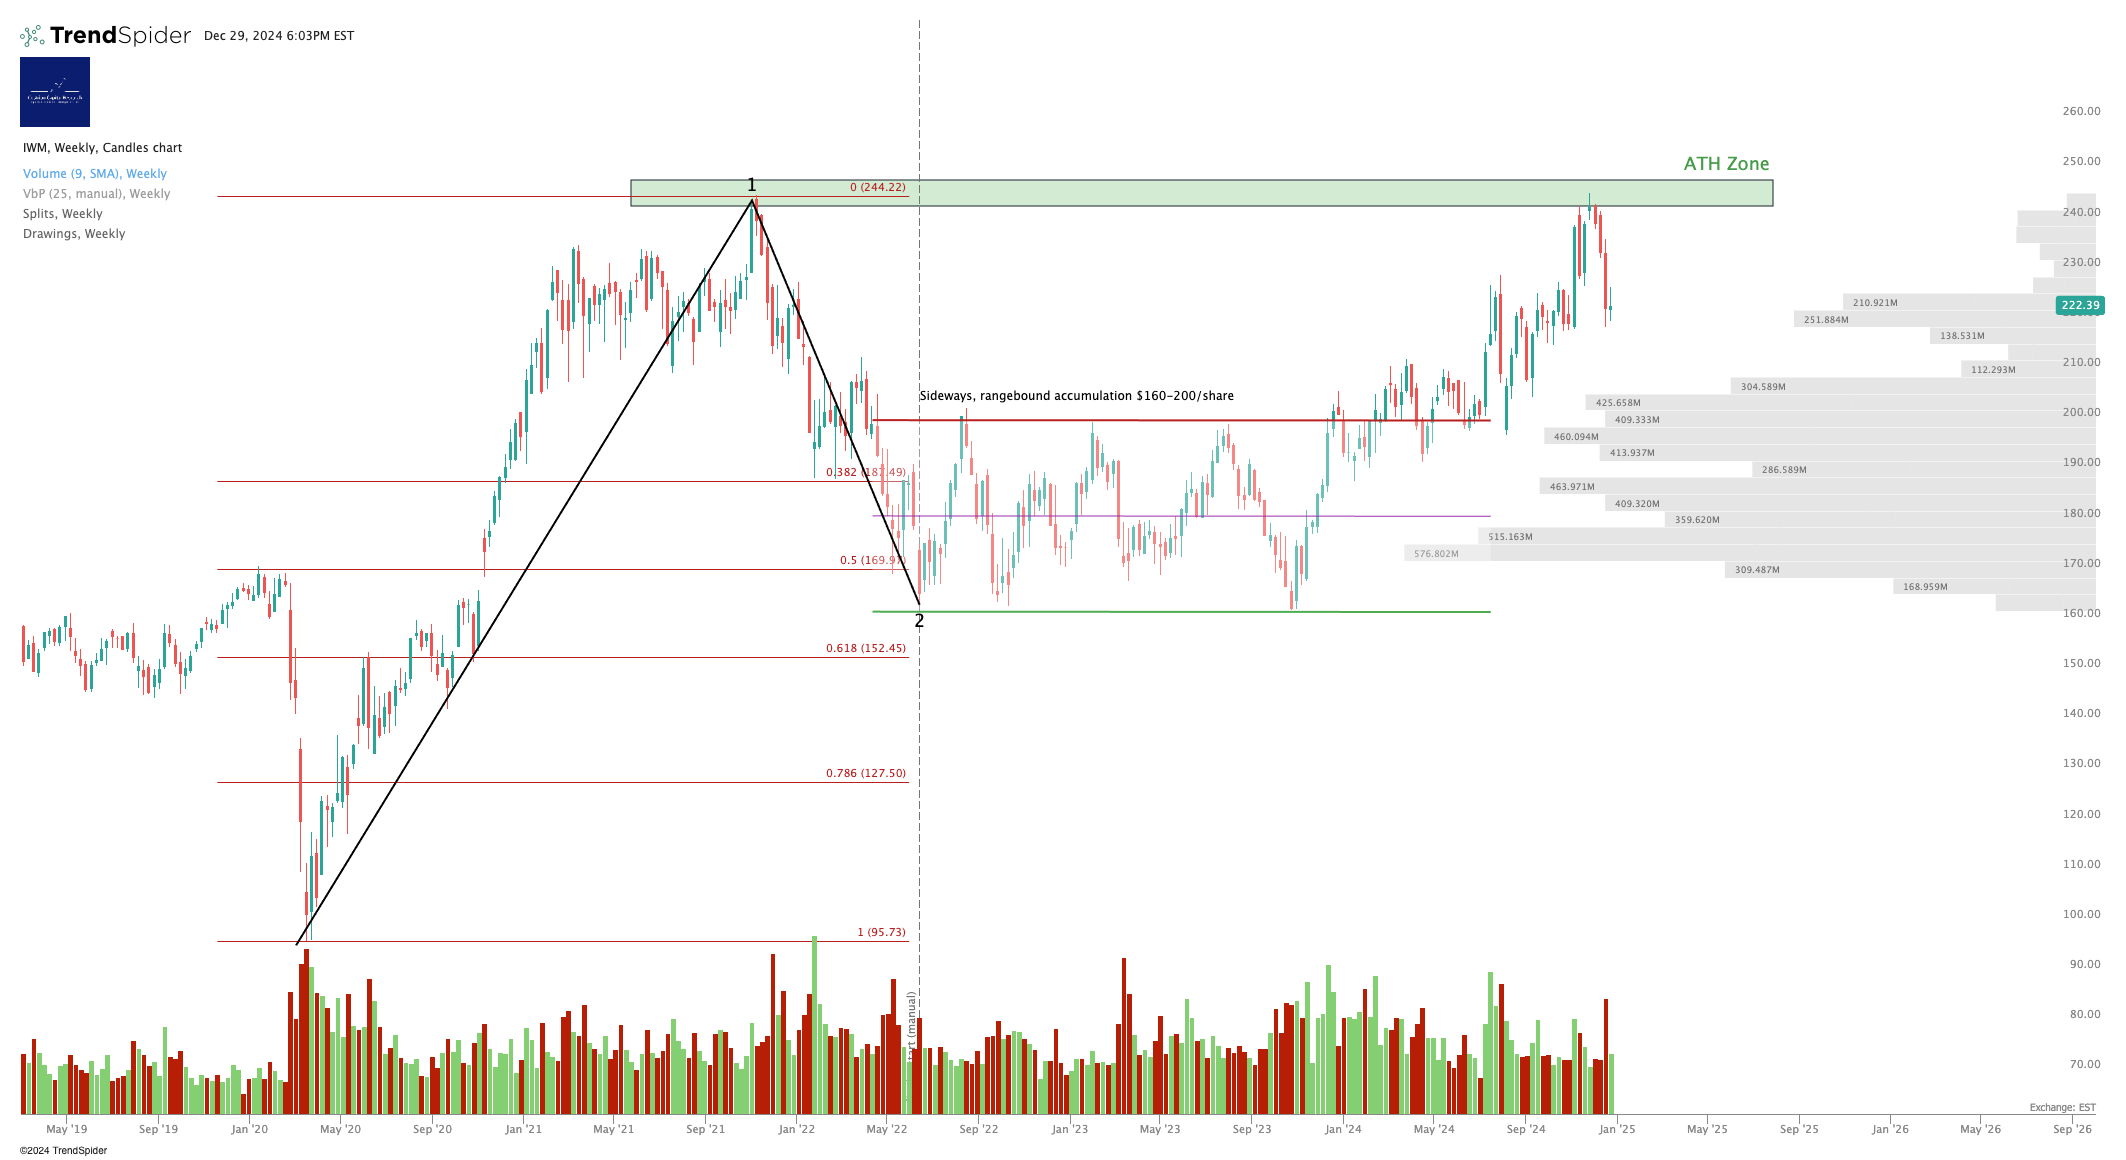
So far that ATH has proven hard to overcome. Looks like the Russell may have another attempt at breaking that high.
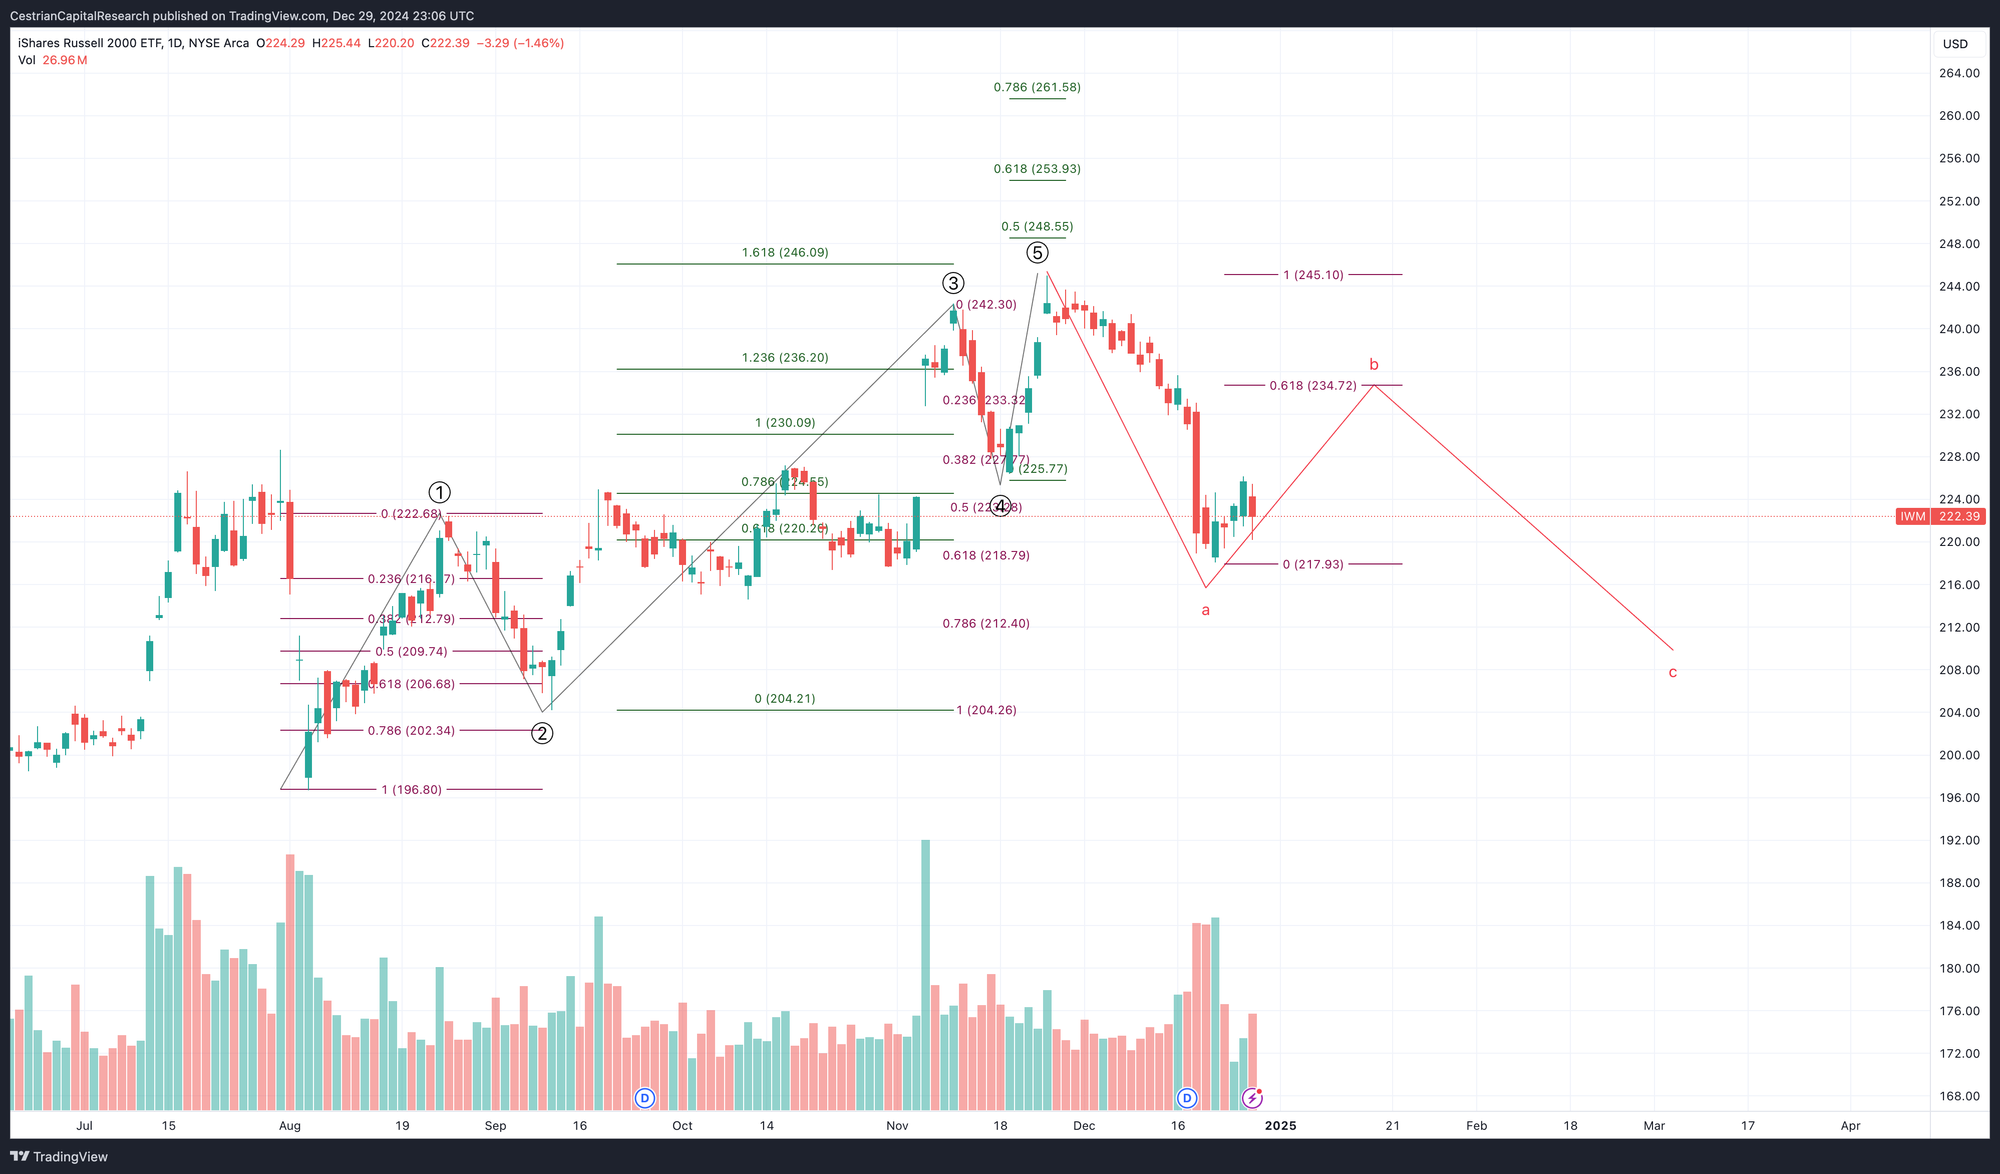
When markets rebound from declines like that suffered by the Russell of late, you always have to be careful to avoid a "b-wave" also known as a headfake or sucker's rally. Here's what an a-b-c move in the Russell might look like. If the rally since the post FOMC lows falters, there could be a deeper drop head. You can measure and predict the probability of such moves, to a degree, if you learn the shapes (waveforms) and amplitudes (Fibonacci levels) of these moves.
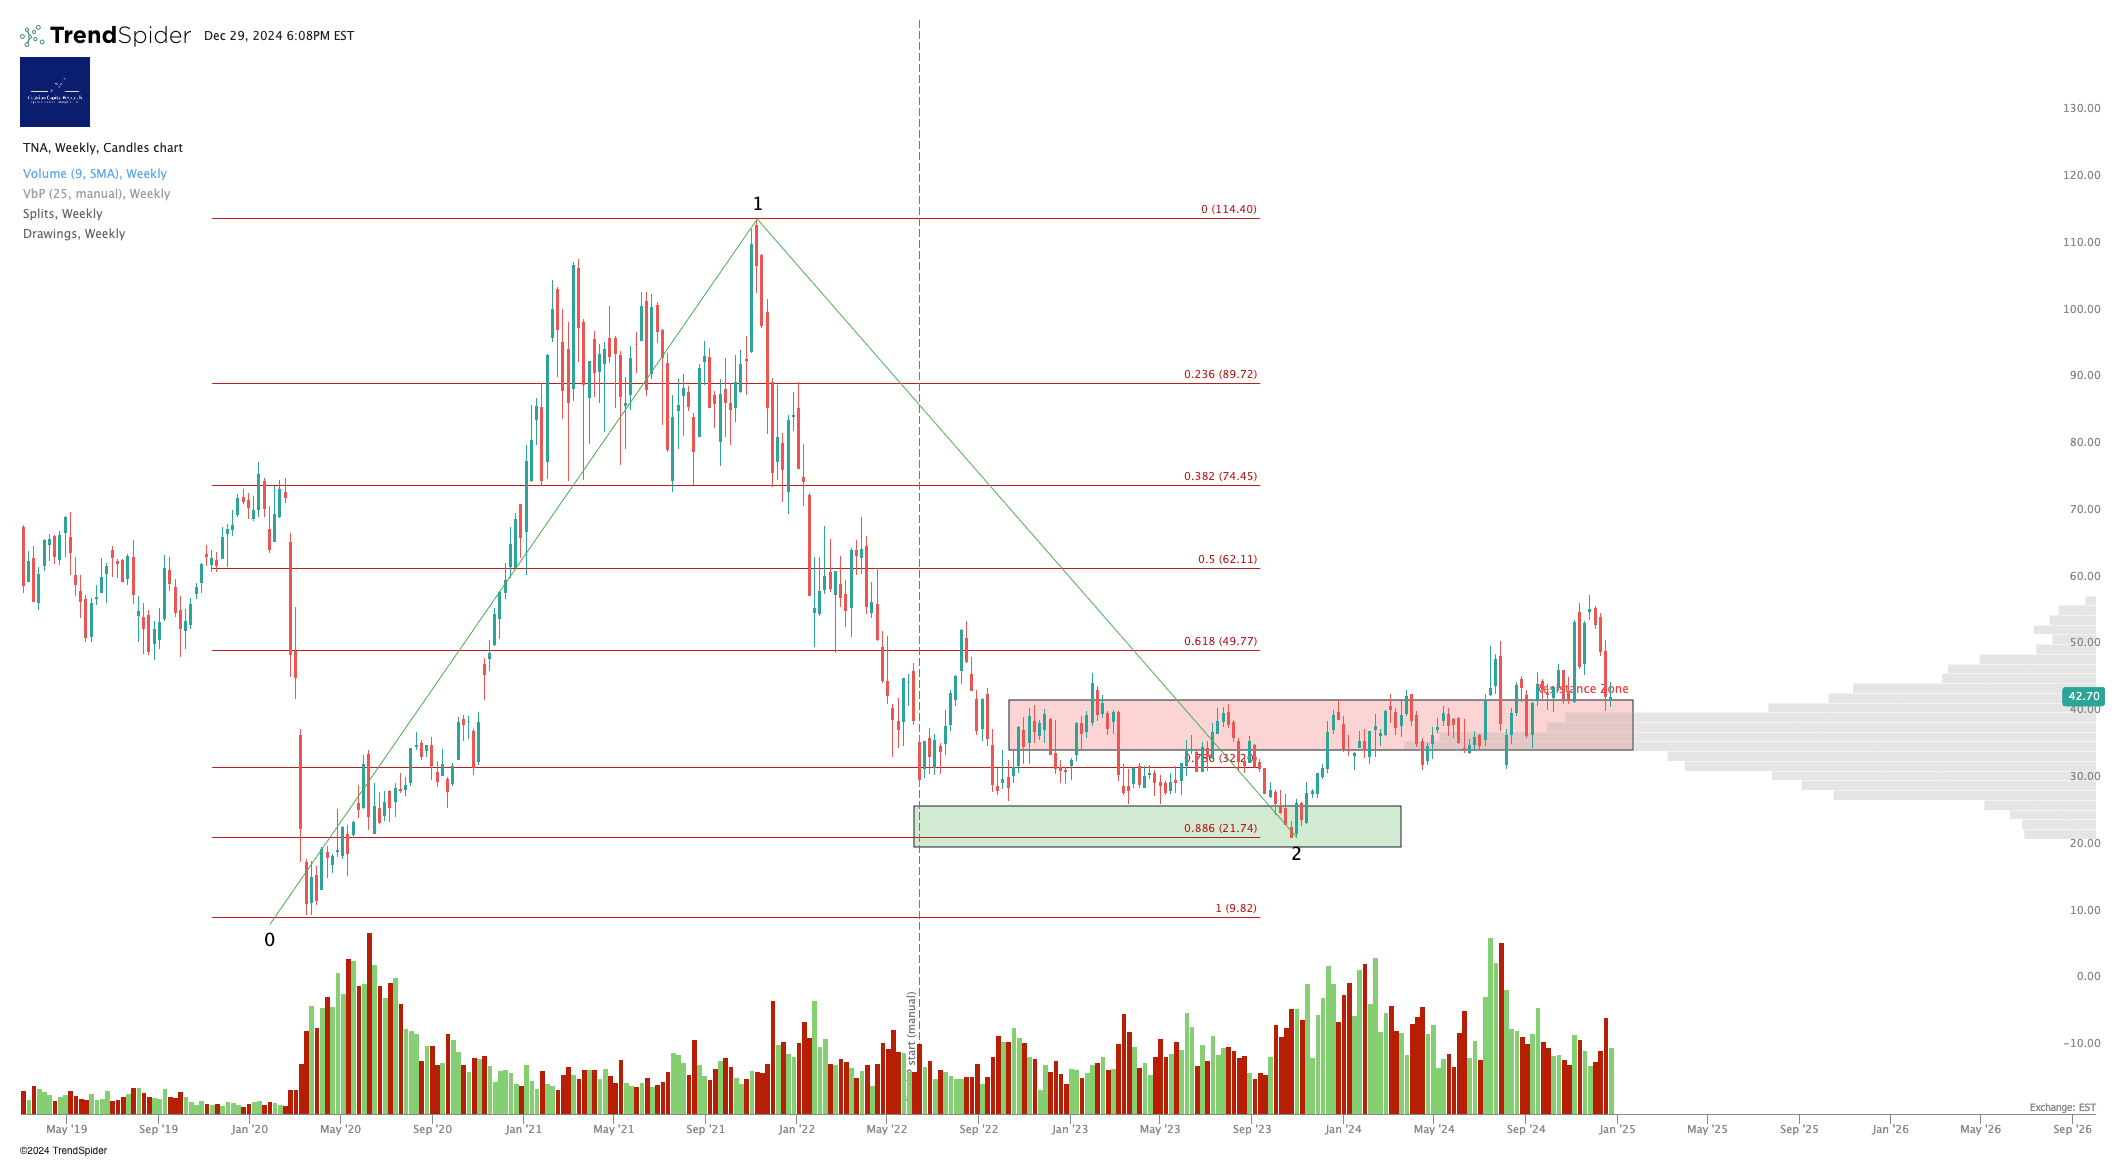
Note - Leveraged ETF. Read the fund documentation if you are considering using this instrument.
That the $40 high volume node in TNA is being defended is at least short-term bullish for the Russell at large.
Disclosure: No position in the Russell.
Sector ETFs
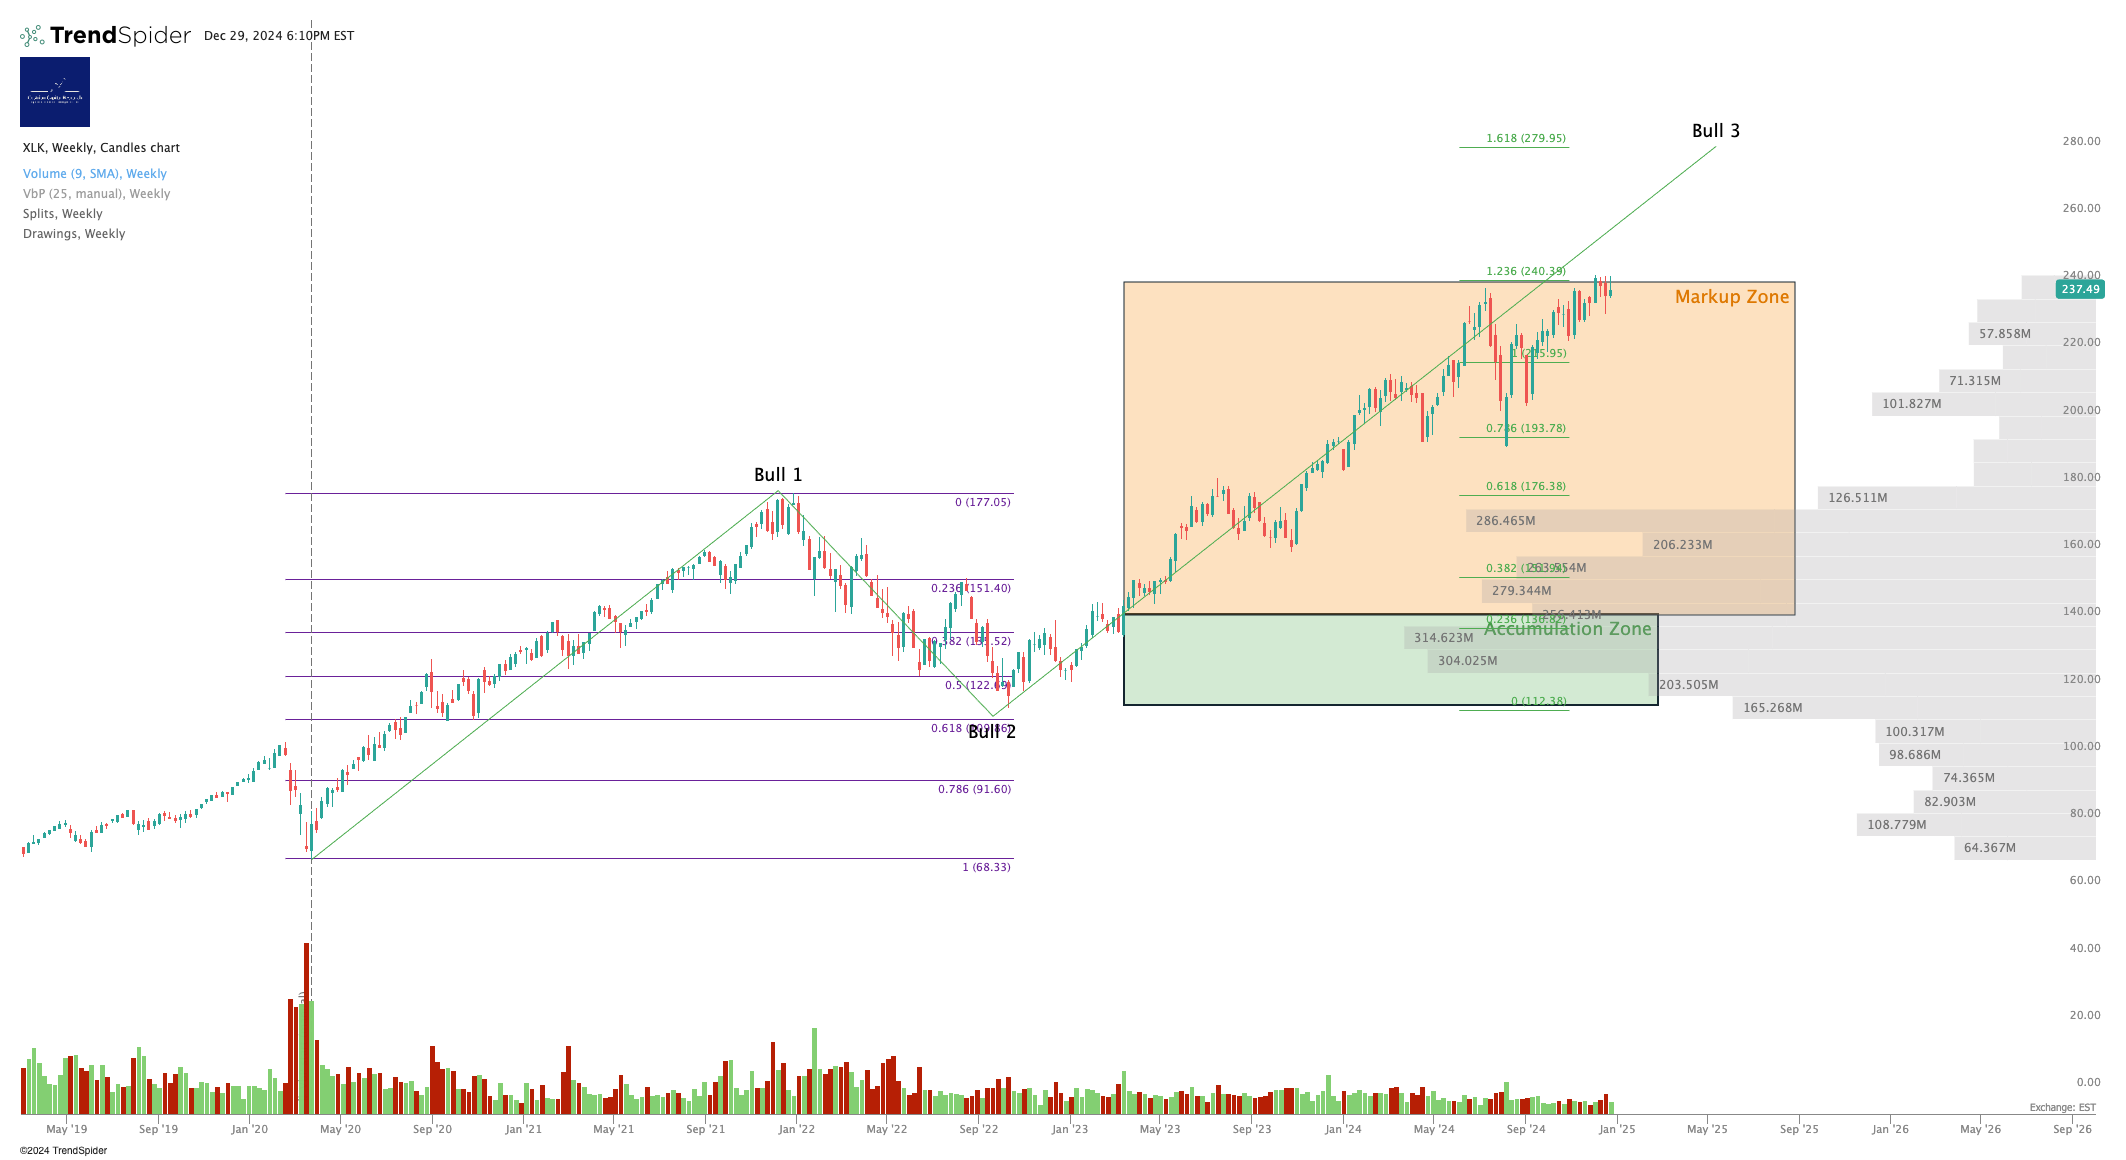
$240 and above, bullish. Below, bearish. If XLK is looking bearish, so too will be the indices, since tech pervades them these days. Yes even the Dow.
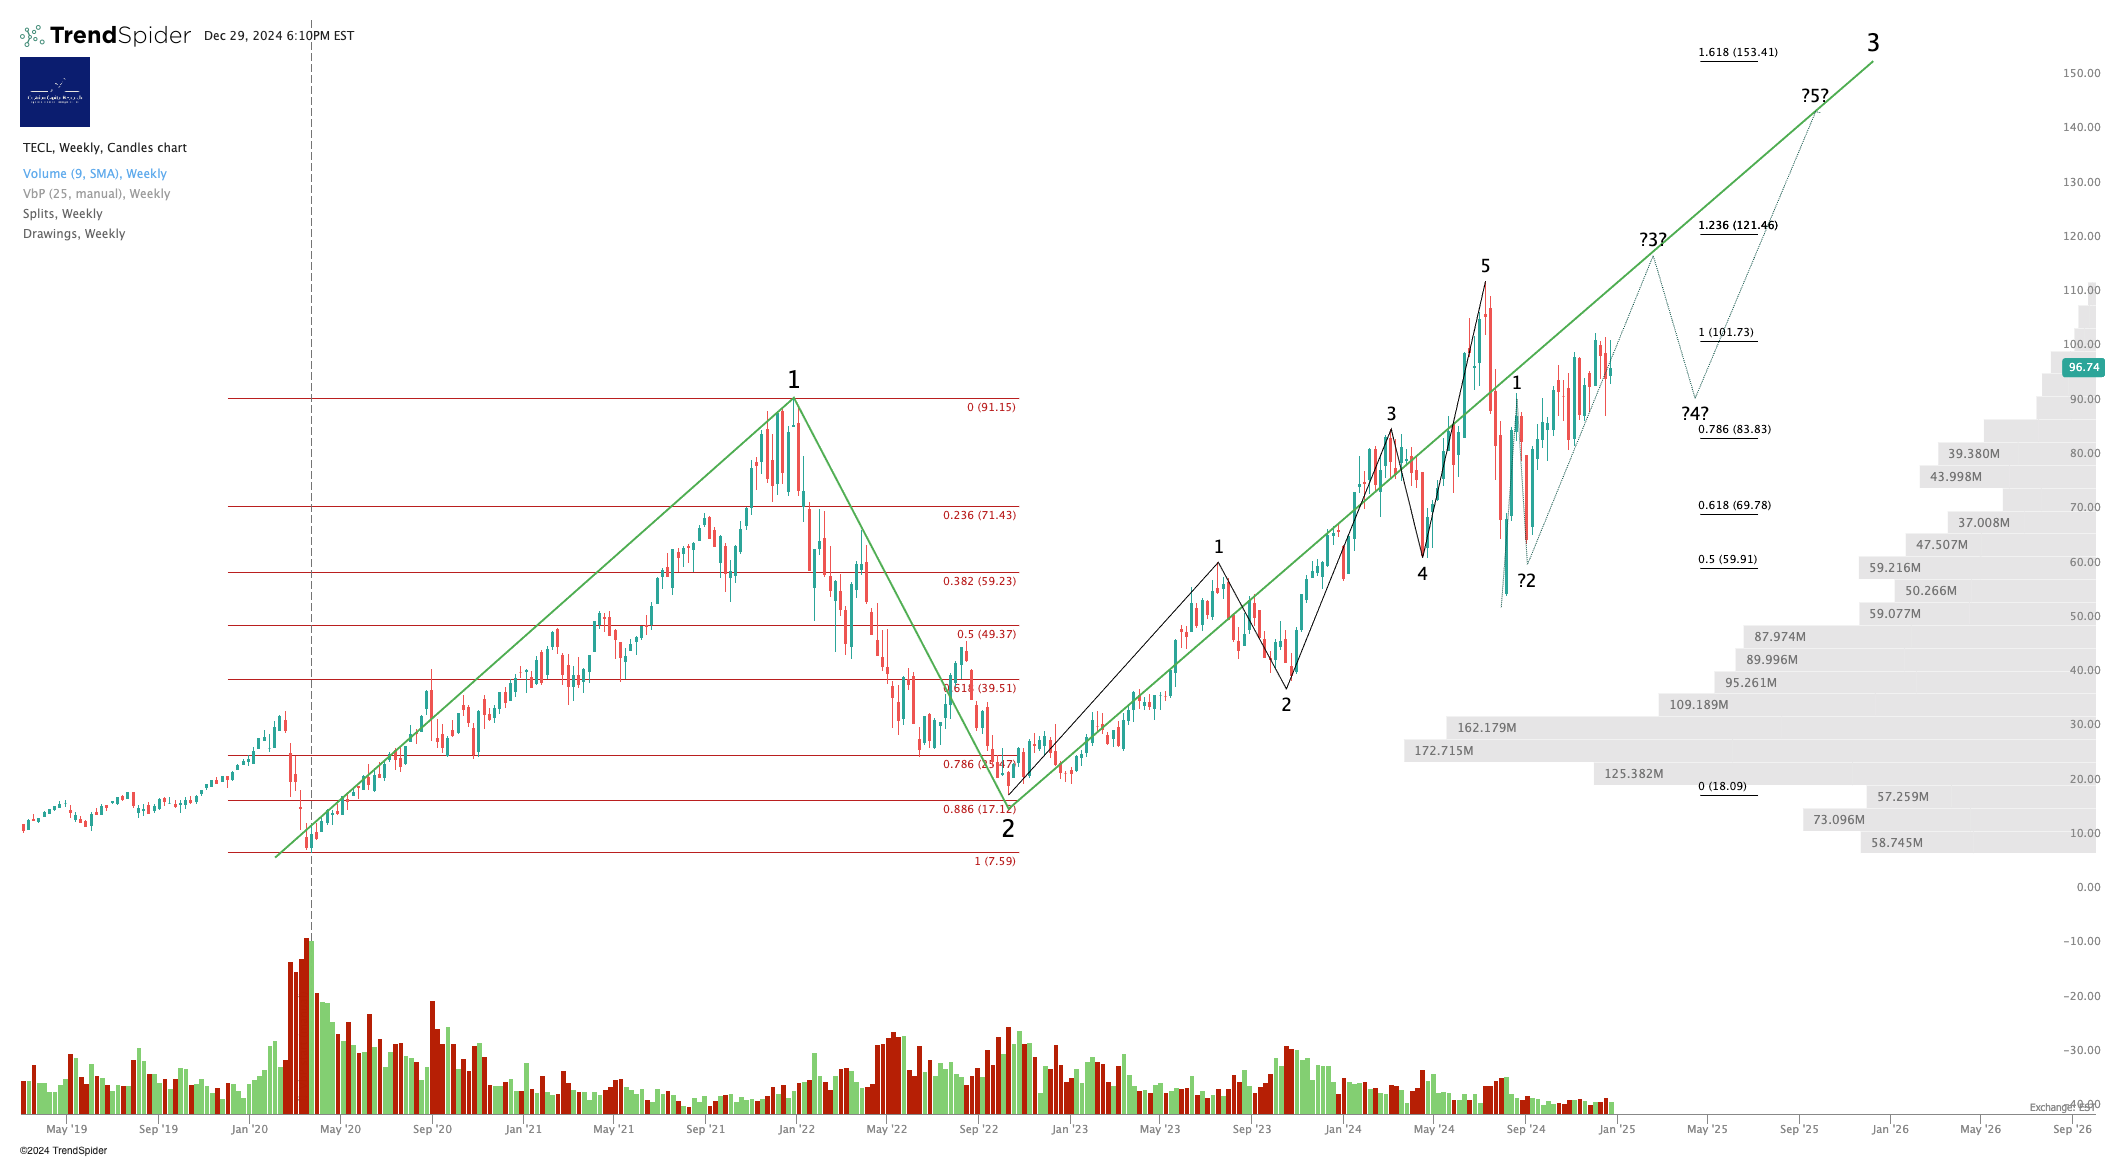
3x Levered Long XLK (Tech) - TECL
Note - TECL and its inverse TECS tend to be illiquid outside RTH with relatively wide bid/ask spreads.
Note - Leveraged ETF. Read the fund documentation if you are considering using this instrument.
Again I would use the XLK chart to trade TECL, personally.
Personal Trading Plan Disclosure: No position in TECL or TECS
SOXX (Semiconductor Sector ETF)
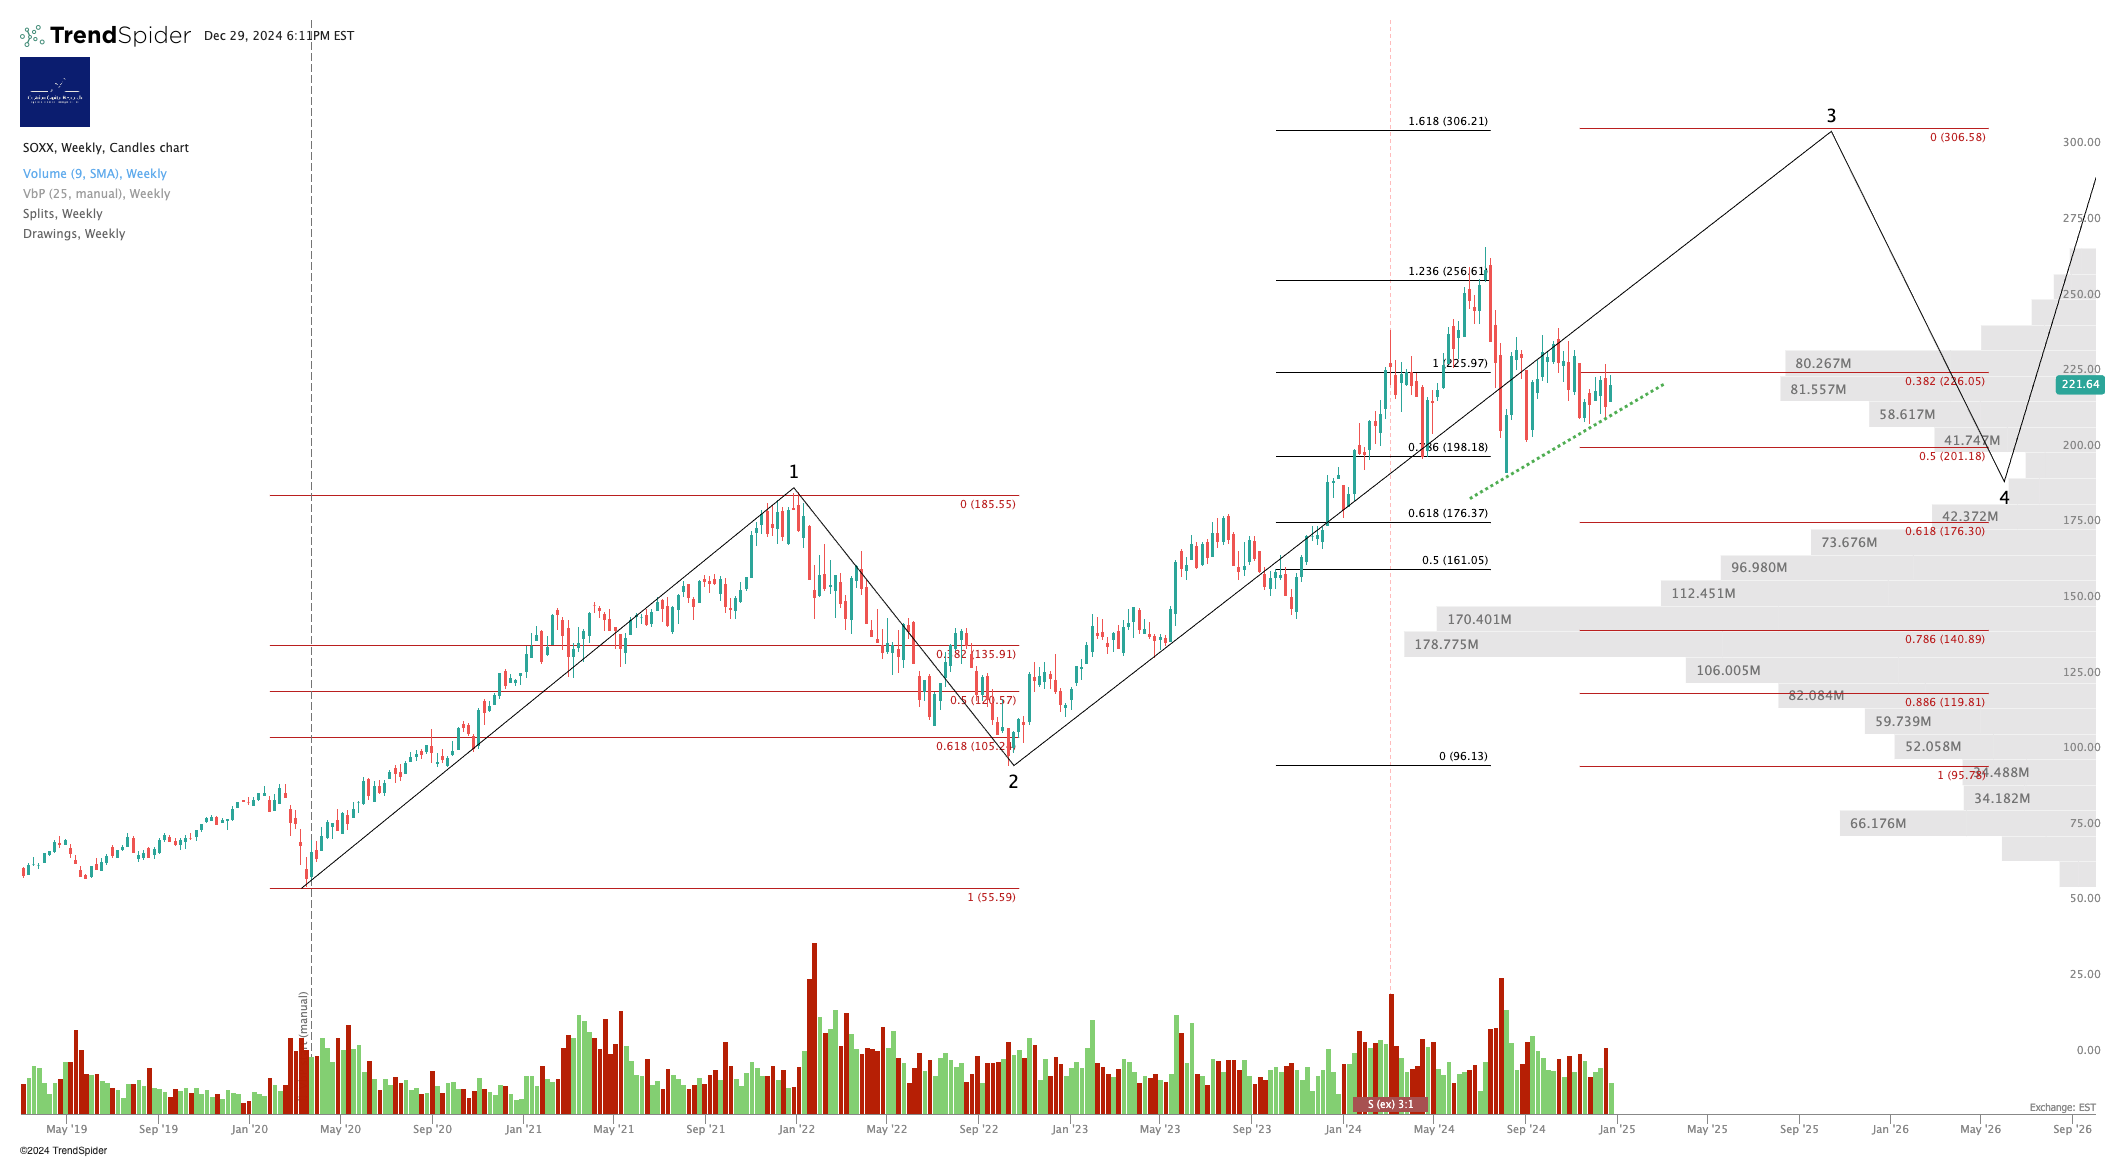
If SOXX <190, bearish. Above $209, bullish. Closed at $221 Friday.
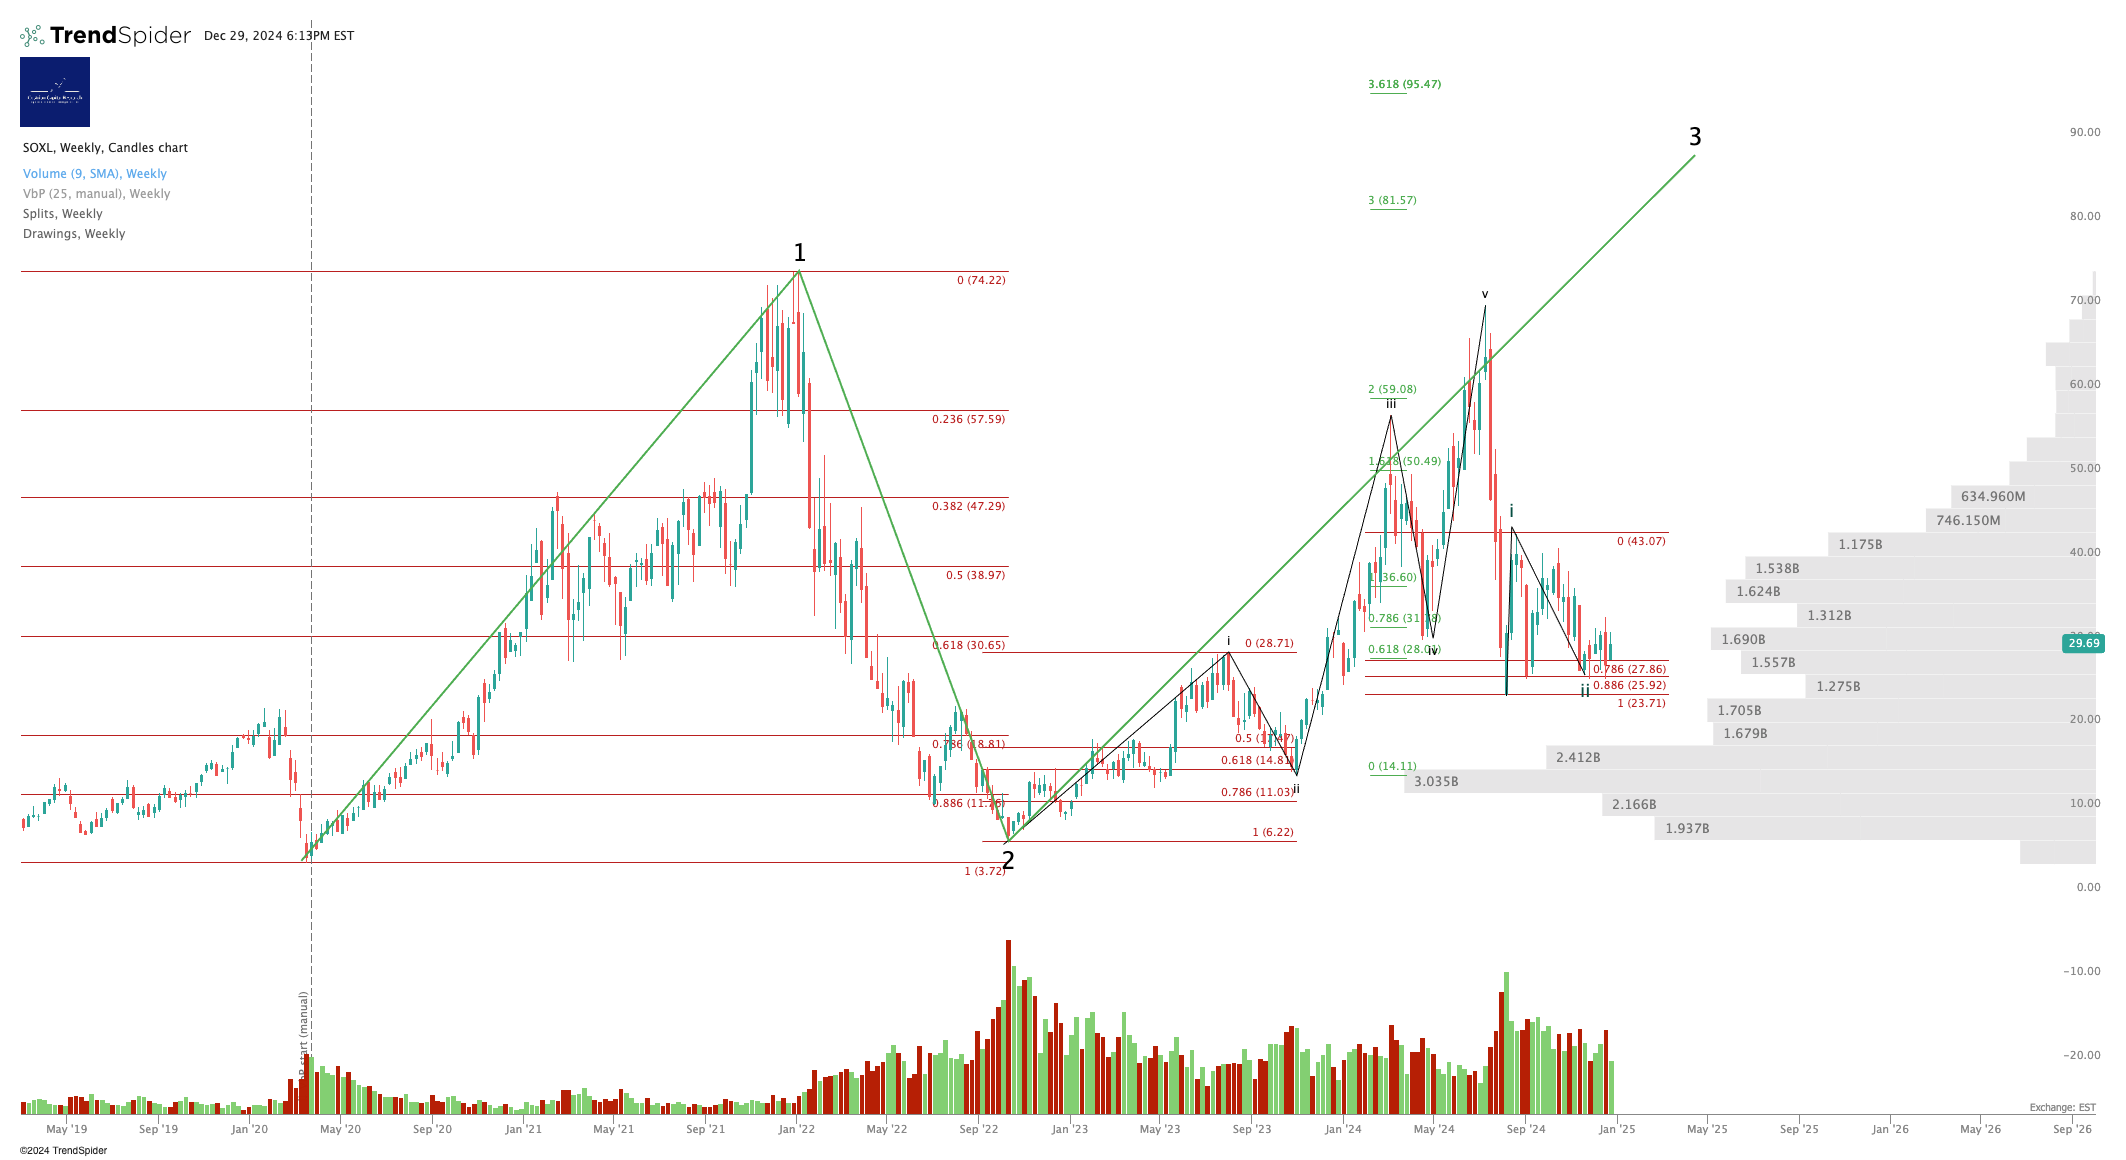
3x Levered Long SOXX (Semiconductor) - SOXL
Note - Leveraged ETF. Read the fund documentation if you are considering using this instrument.
Again - to trade SOXL I personally use the SOXX chart.
Disclosure: I am unhedged long $SOXL and $SMGB.
Alex King, Cestrian Capital Research, Inc - 29 December 2024.
DISCLOSURE - Cestrian Capital Research, Inc staff personal accounts hold long positions in, inter alia, TQQQ, VUAG, SOXL, CNDX, SMGB, TLT, TMF, UDOW.

