
Market On Open - Wednesday 27 March
DISCLAIMER: This note is intended for US recipients only and, in particular, is not directed at, nor intended to be relied upon by any UK recipients. Any information or analysis in this note is not an offer to sell or the solicitation of an offer to buy any securities. Nothing in this note is intended to be investment advice and nor should it be relied upon to make investment decisions. Cestrian Capital Research, Inc., its employees, agents or affiliates, including the author of this note, or related persons, may have a position in any stocks, security, or financial instrument referenced in this note. Any opinions, analyses, or probabilities expressed in this note are those of the author as of the note's date of publication and are subject to change without notice. Companies referenced in this note or their employees or affiliates may be customers of Cestrian Capital Research, Inc. Cestrian Capital Research, Inc. values both its independence and transparency and does not believe that this presents a material potential conflict of interest or impacts the content of its research or publications.
Volatility? What Volatility?
by Alex King
Here’s the Vix, which measures implied volatility in certain expiries of S&P500 index options.
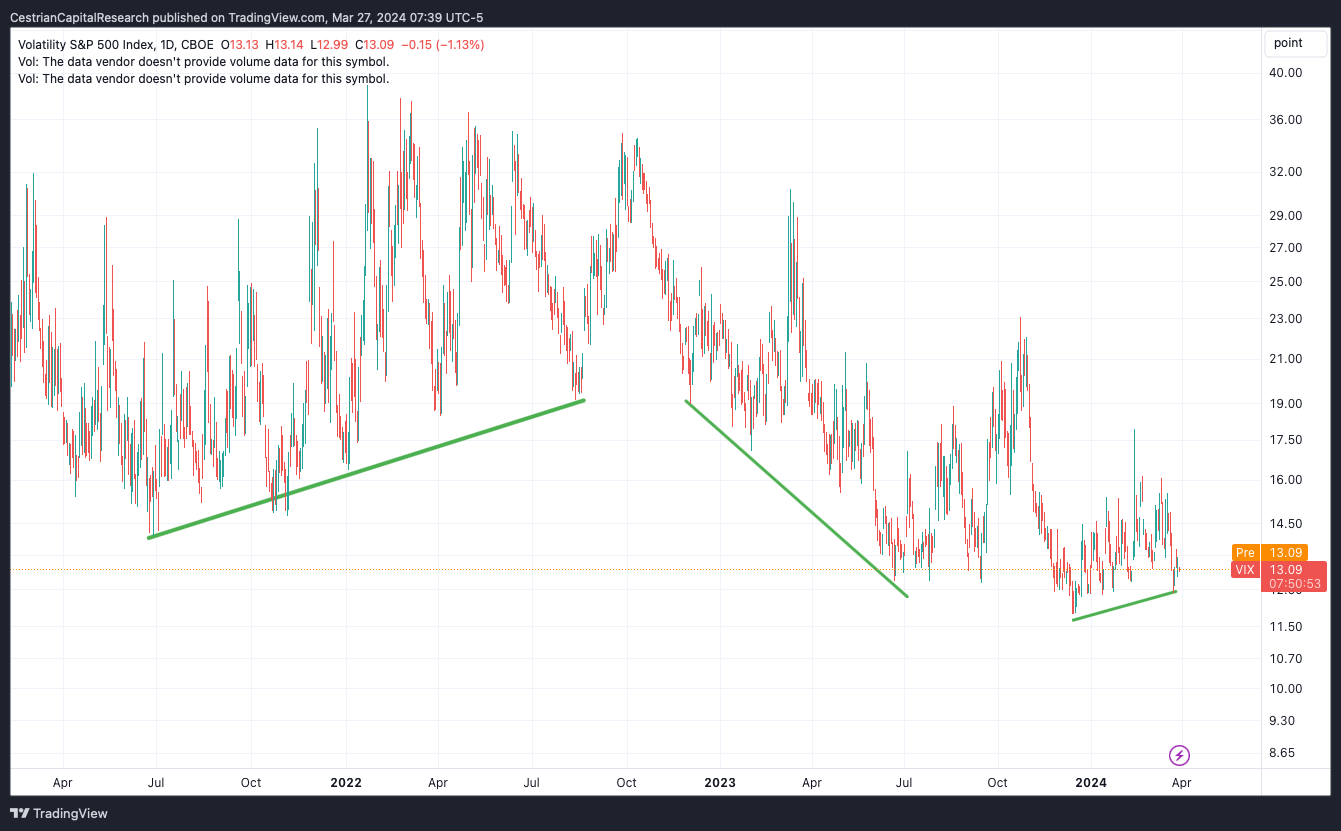
From a low struck at the end of December 2023, it’s been on the rise through 2024, not that you would know it. Right now volatility, at least as measured by the Vix (and it’s not a simple measure - see here), is low, and you can tell this from the fairly boring slow-up nature of markets. Now, boring is good when it comes to investing. Boring means if you have set your course correctly you can just quietly do nothing and get richer most weeks. This is good. Unless you are a dopamine fiend in which case you are actually looking for a little fear in the pit of your stomach. Good luck to you if so! What we’re trying to do here is measure emotion, measure market moves, and try to make money out of other folks’ dopamine quests.
To this end, below we run through our usual charts - we cover the US 10-year yield, the S&P500 in three incarnations (SPY, ES, UPRO), Nasdaq, the Dow and the Russell ditto (unlevered ETF, futures and 3x leveraged ETFs in each case) - plus some sector-specific levered and unlevered ETFs. We do this daily for our paying members here, whether you are a member of the Inner Circle or our Market Insight membership tiers.
If you’ve yet to sign up for one of the paid tiers here? You can do so from the links below. The signup links below will give you the options, but if you have any difficulties signing up, you can reach us right here.