
Market On Open, Tuesday 18 February

DISCLAIMER: This note is intended for US recipients only and, in particular, is not directed at, nor intended to be relied upon by any UK recipients. Any information or analysis in this note is not an offer to sell or the solicitation of an offer to buy any securities. Nothing in this note is intended to be investment advice and nor should it be relied upon to make investment decisions. Cestrian Capital Research, Inc., its employees, agents or affiliates, including the author of this note, or related persons, may have a position in any stocks, security, or financial instrument referenced in this note. Any opinions, analyses, or probabilities expressed in this note are those of the author as of the note's date of publication and are subject to change without notice. Companies referenced in this note or their employees or affiliates may be customers of Cestrian Capital Research, Inc. Cestrian Capital Research, Inc. values both its independence and transparency and does not believe that this presents a material potential conflict of interest or impacts the content of its research or publications.
Probably Nothing
by Alex King, CEO, Cestrian Capital Research, Inc
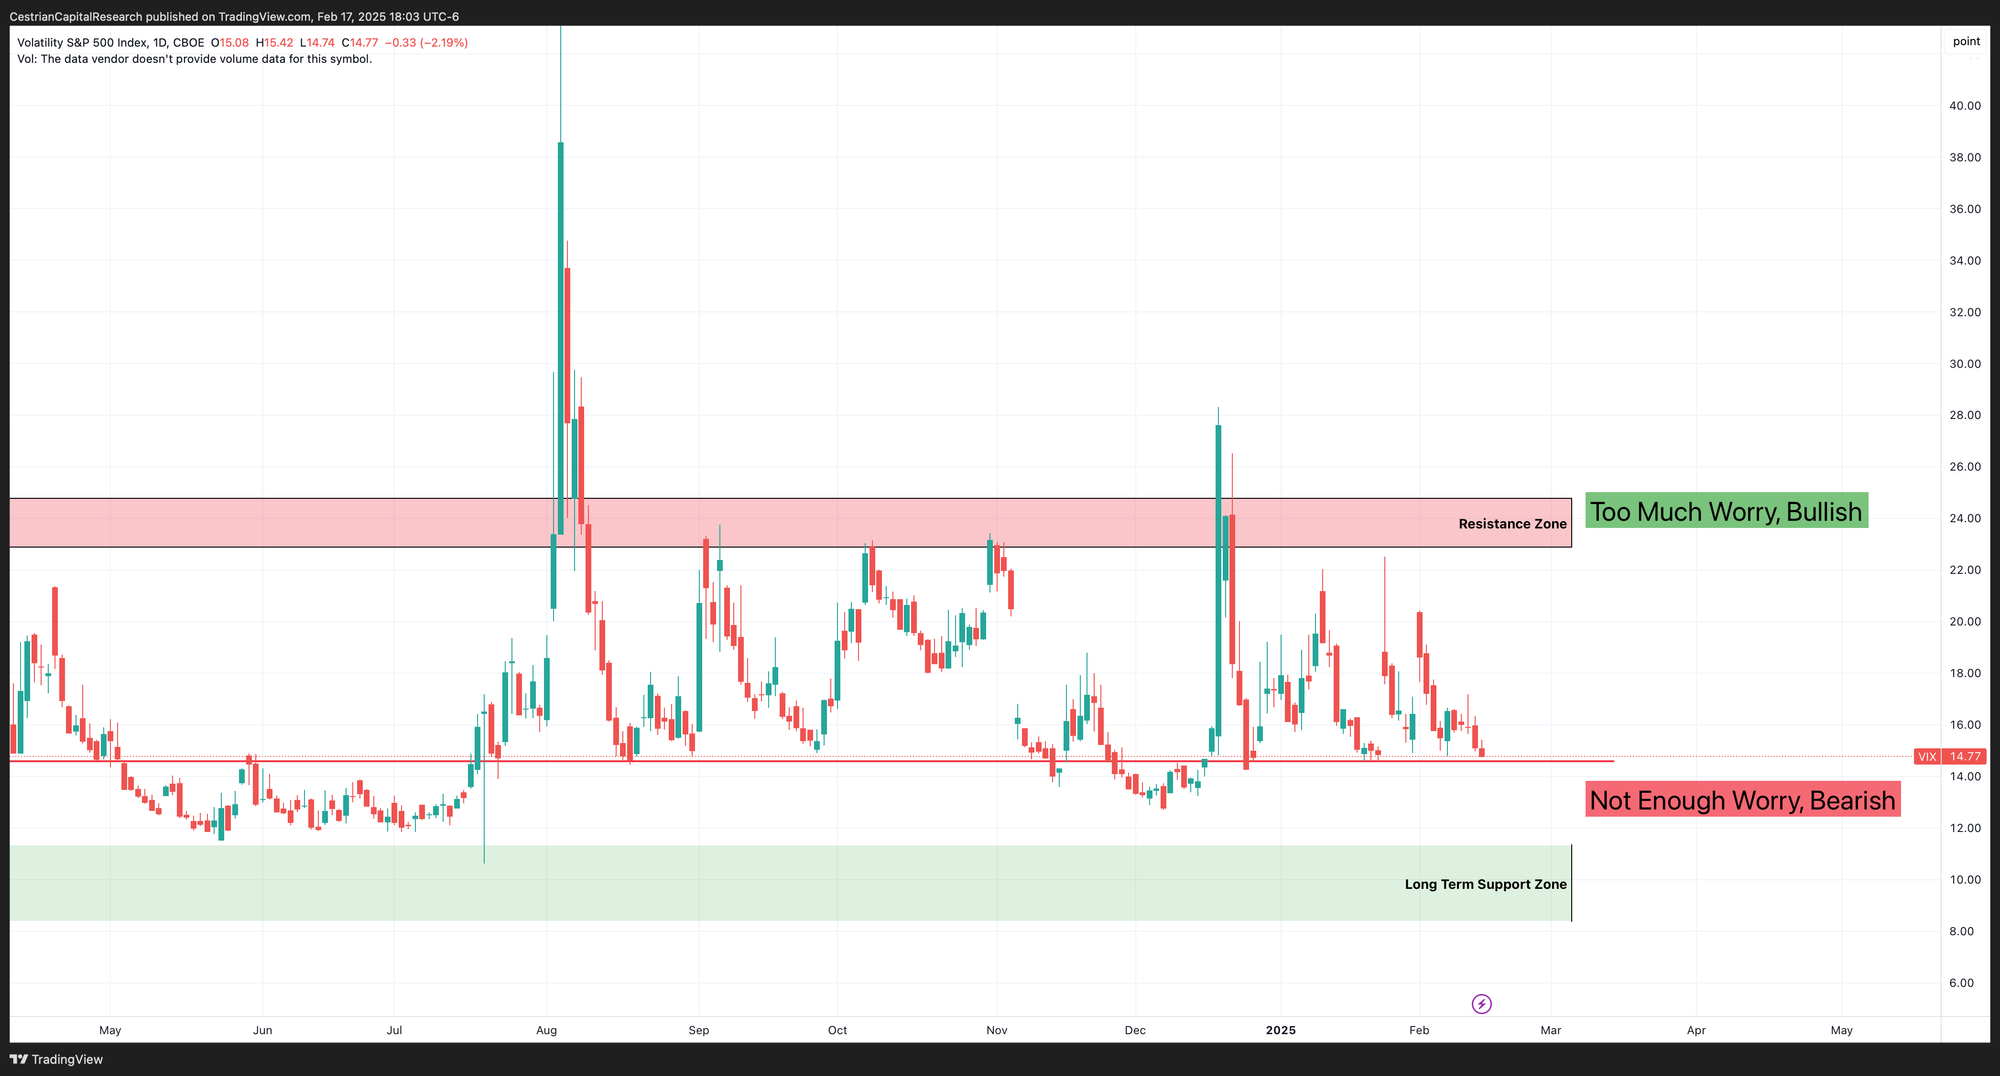
Here’s a really simple and boring chart which I find pretty useful as a touchstone of where things stand on any given day. This is the Vix index, a measure of demand for S&P500 puts with 30 days or more to expiry. You can open a full page version of this chart, here.
As a very rough rule of thumb, when the Vix is on the floor, markets are too convinced of their own bullishness which usually means there is a pothole ahead. And when the Vix moons it usually means that sellers are becoming intoxicated or perhaps depressed by their own worldview. Neither position sustains, neither boom nor bust. One always gives way to the other, in the end. Whilst no method is perfect, this Vix chart is pretty useful to me at the moment. When the Vix is at the lows I find that is a good time to wind on some downside protection - last week I did so in the form of some March-dated SPY and QQQ puts, sized so that if they go to zero it doesn’t keep me awake at night but if they moon the gains will be worth having. I also hedged two meaningful levered-long ETF positions, being TQQQ and SOXL, with their inverse pairs SQQQ and SOXS, to mitigate against any kind of long-weekend malarkey. This leaves me net long but with some protection against any near-term weakness. If the market moons I shall have to wrestle those hedges a little bit. I can live with that.
So, we'll see how this plays out in the next few days but at present it looks like this Vix on the floor moment may give rise to a selloff of sorts in equities. We shall see.
By the way if you want real-time alerts for Cestrian staff personal accounts, and you want to be able to discuss those trades, join our Inner Circle service - you can read all about it here.
Let’s get into it.
Short- And Medium-Term Market Analysis
If you want this daily dose of pattern recognition, and you aren’t yet a subscriber of course, you can read about and choose from all the subscription services that include this note, here.