
Market On Open - Monday 22 April
DISCLAIMER: This note is intended for US recipients only and, in particular, is not directed at, nor intended to be relied upon by any UK recipients. Any information or analysis in this note is not an offer to sell or the solicitation of an offer to buy any securities. Nothing in this note is intended to be investment advice and nor should it be relied upon to make investment decisions. Cestrian Capital Research, Inc., its employees, agents or affiliates, including the author of this note, or related persons, may have a position in any stocks, security, or financial instrument referenced in this note. Any opinions, analyses, or probabilities expressed in this note are those of the author as of the note's date of publication and are subject to change without notice. Companies referenced in this note or their employees or affiliates may be customers of Cestrian Capital Research, Inc. Cestrian Capital Research, Inc. values both its independence and transparency and does not believe that this presents a material potential conflict of interest or impacts the content of its research or publications.
If It Was Easy, Anyone Could Do It
by Alex King
There’s a reason Mr Buffett says that for most investors, the best idea is to dollar-cost-averaging into the S&P500 using low-cost tracker fund that re-invests dividends, oh, and, never sell. The reason is that he is correct. It means that Fright Night events like last week aren’t really very stressful at all, if (1) your timeline is forever (2) you steadily buy regardless of the weather and (3) you don’t spend all day watching charts and/or CNBC.
If you choose a more active investing life, however, then the rollercoaster is a feature not a bug, and it’s one that you have to set yourself up to deal with. This means financially (which speaks to allocation levels vs. cash holdings, and it speaks to the use of hedging) and it means emotionally (which speaks to expecting the unexpected and being unmoved when it happens).
No-one knows whether last week signalled that we have seen a general market top already, and doom awaits us. If it does, one should be unafraid if one is set up correctly. Because if doom, then $SQQQ and $SPXU. If it doesn’t - ie. it’s just a bump in the road - then you have to decide whether to just do nothing and continue to ride the train to Boomtown, or, whether to buy any of these dips.
Before we get into the weeds below (for our paying members only) I’m happy to declare my own prejudice here. As I mentioned in Slack Chat last Friday, the fact that the Dow had held a key technical support level for four days straight, and then moved up on Friday, is a signal that this move is more likely a rotation from former leaders to former laggards than it is a race to zero. Evidence from the Russell 2000 also supports that argument, albeit with less strength. It may be some time before semiconductor stocks regain their highs but I would be surprised if the major indices weren’t making new all time highs before too long; and I think the Dow might be the first to claim a new ATH.
Now, let’s get into the detail. Below we walk through our daily take on all four major US equity indices, plus treasury bonds, oil, volatility (via the Vix) and sector ETFs.
If you’ve yet to sign up? You can do so from the links below. Choose “Market Insight” if you want our investment notes only; choose “Inner Circle” if you want investment notes, real-time trade alerts, live weekly webinars and recorded videos, and of course a live 24x7 investor community chat service. Monthly and annual subscriptions available - right here.
Short- And Medium-Term Market Analysis
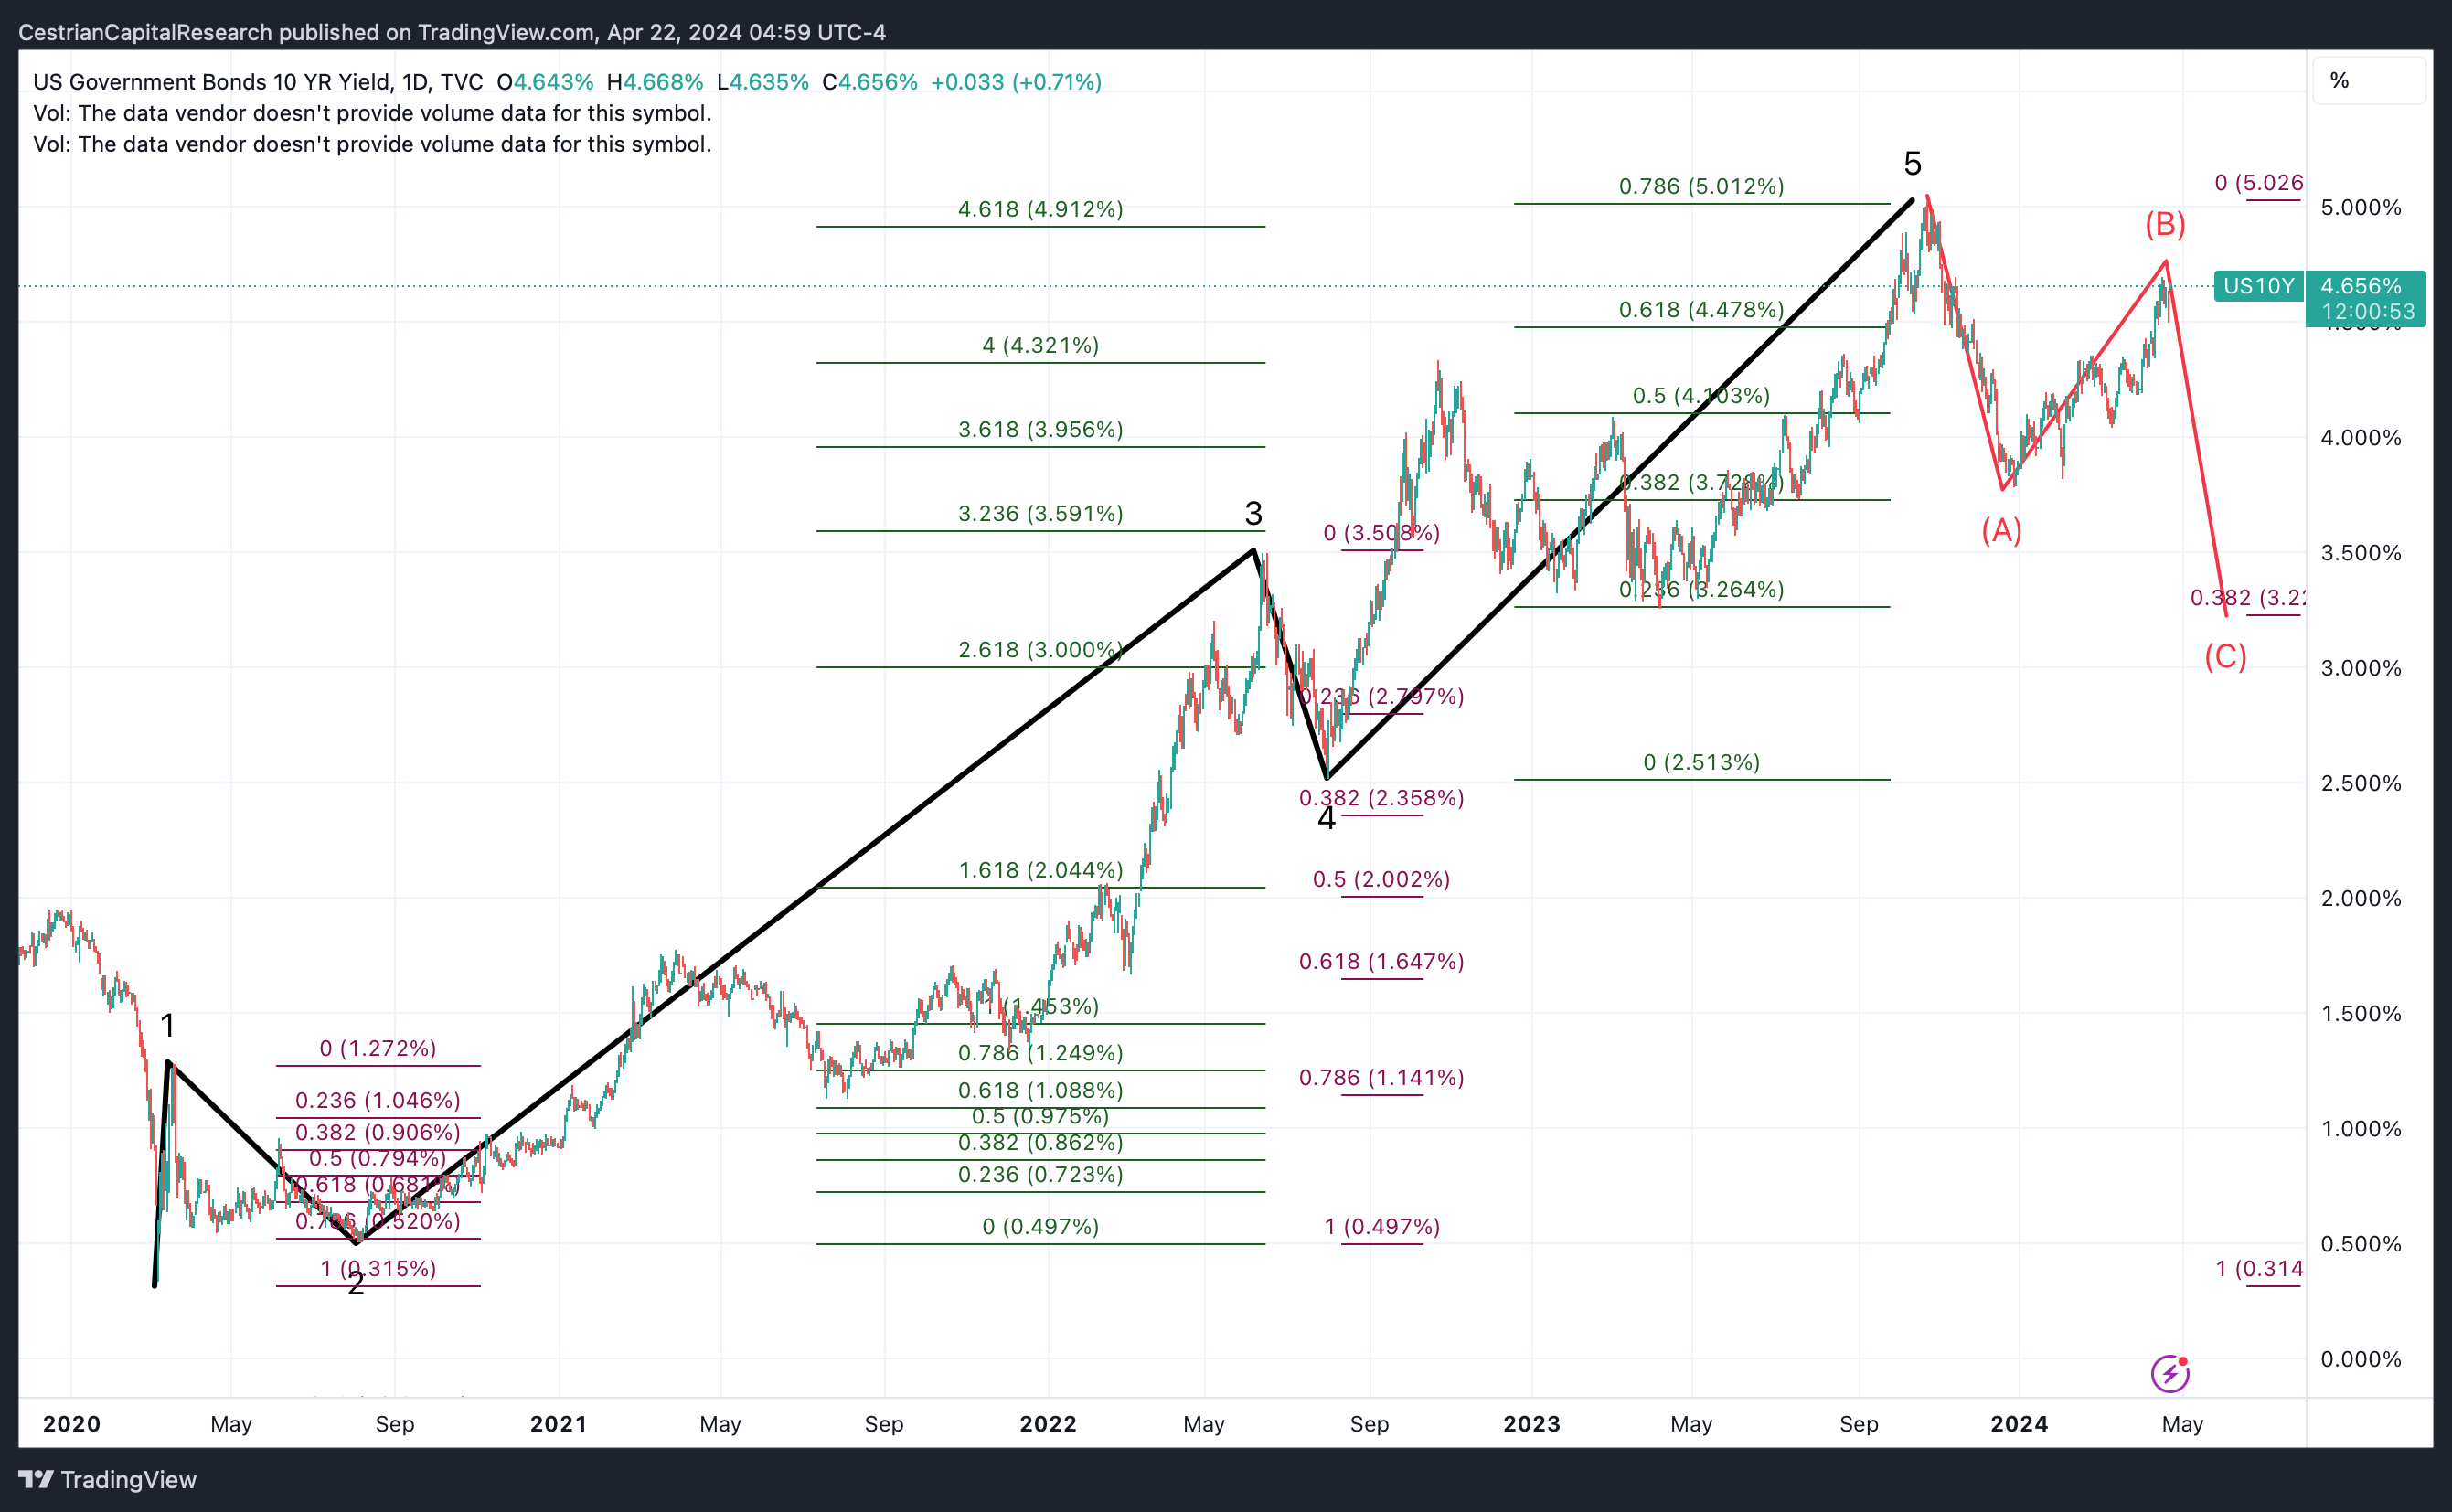
US 10-Year Yield
Still threatening to climb on the delayed rate-cut sentiment.
Equity Volatility
The Vix remains elevated by local standards; today’s close is important.
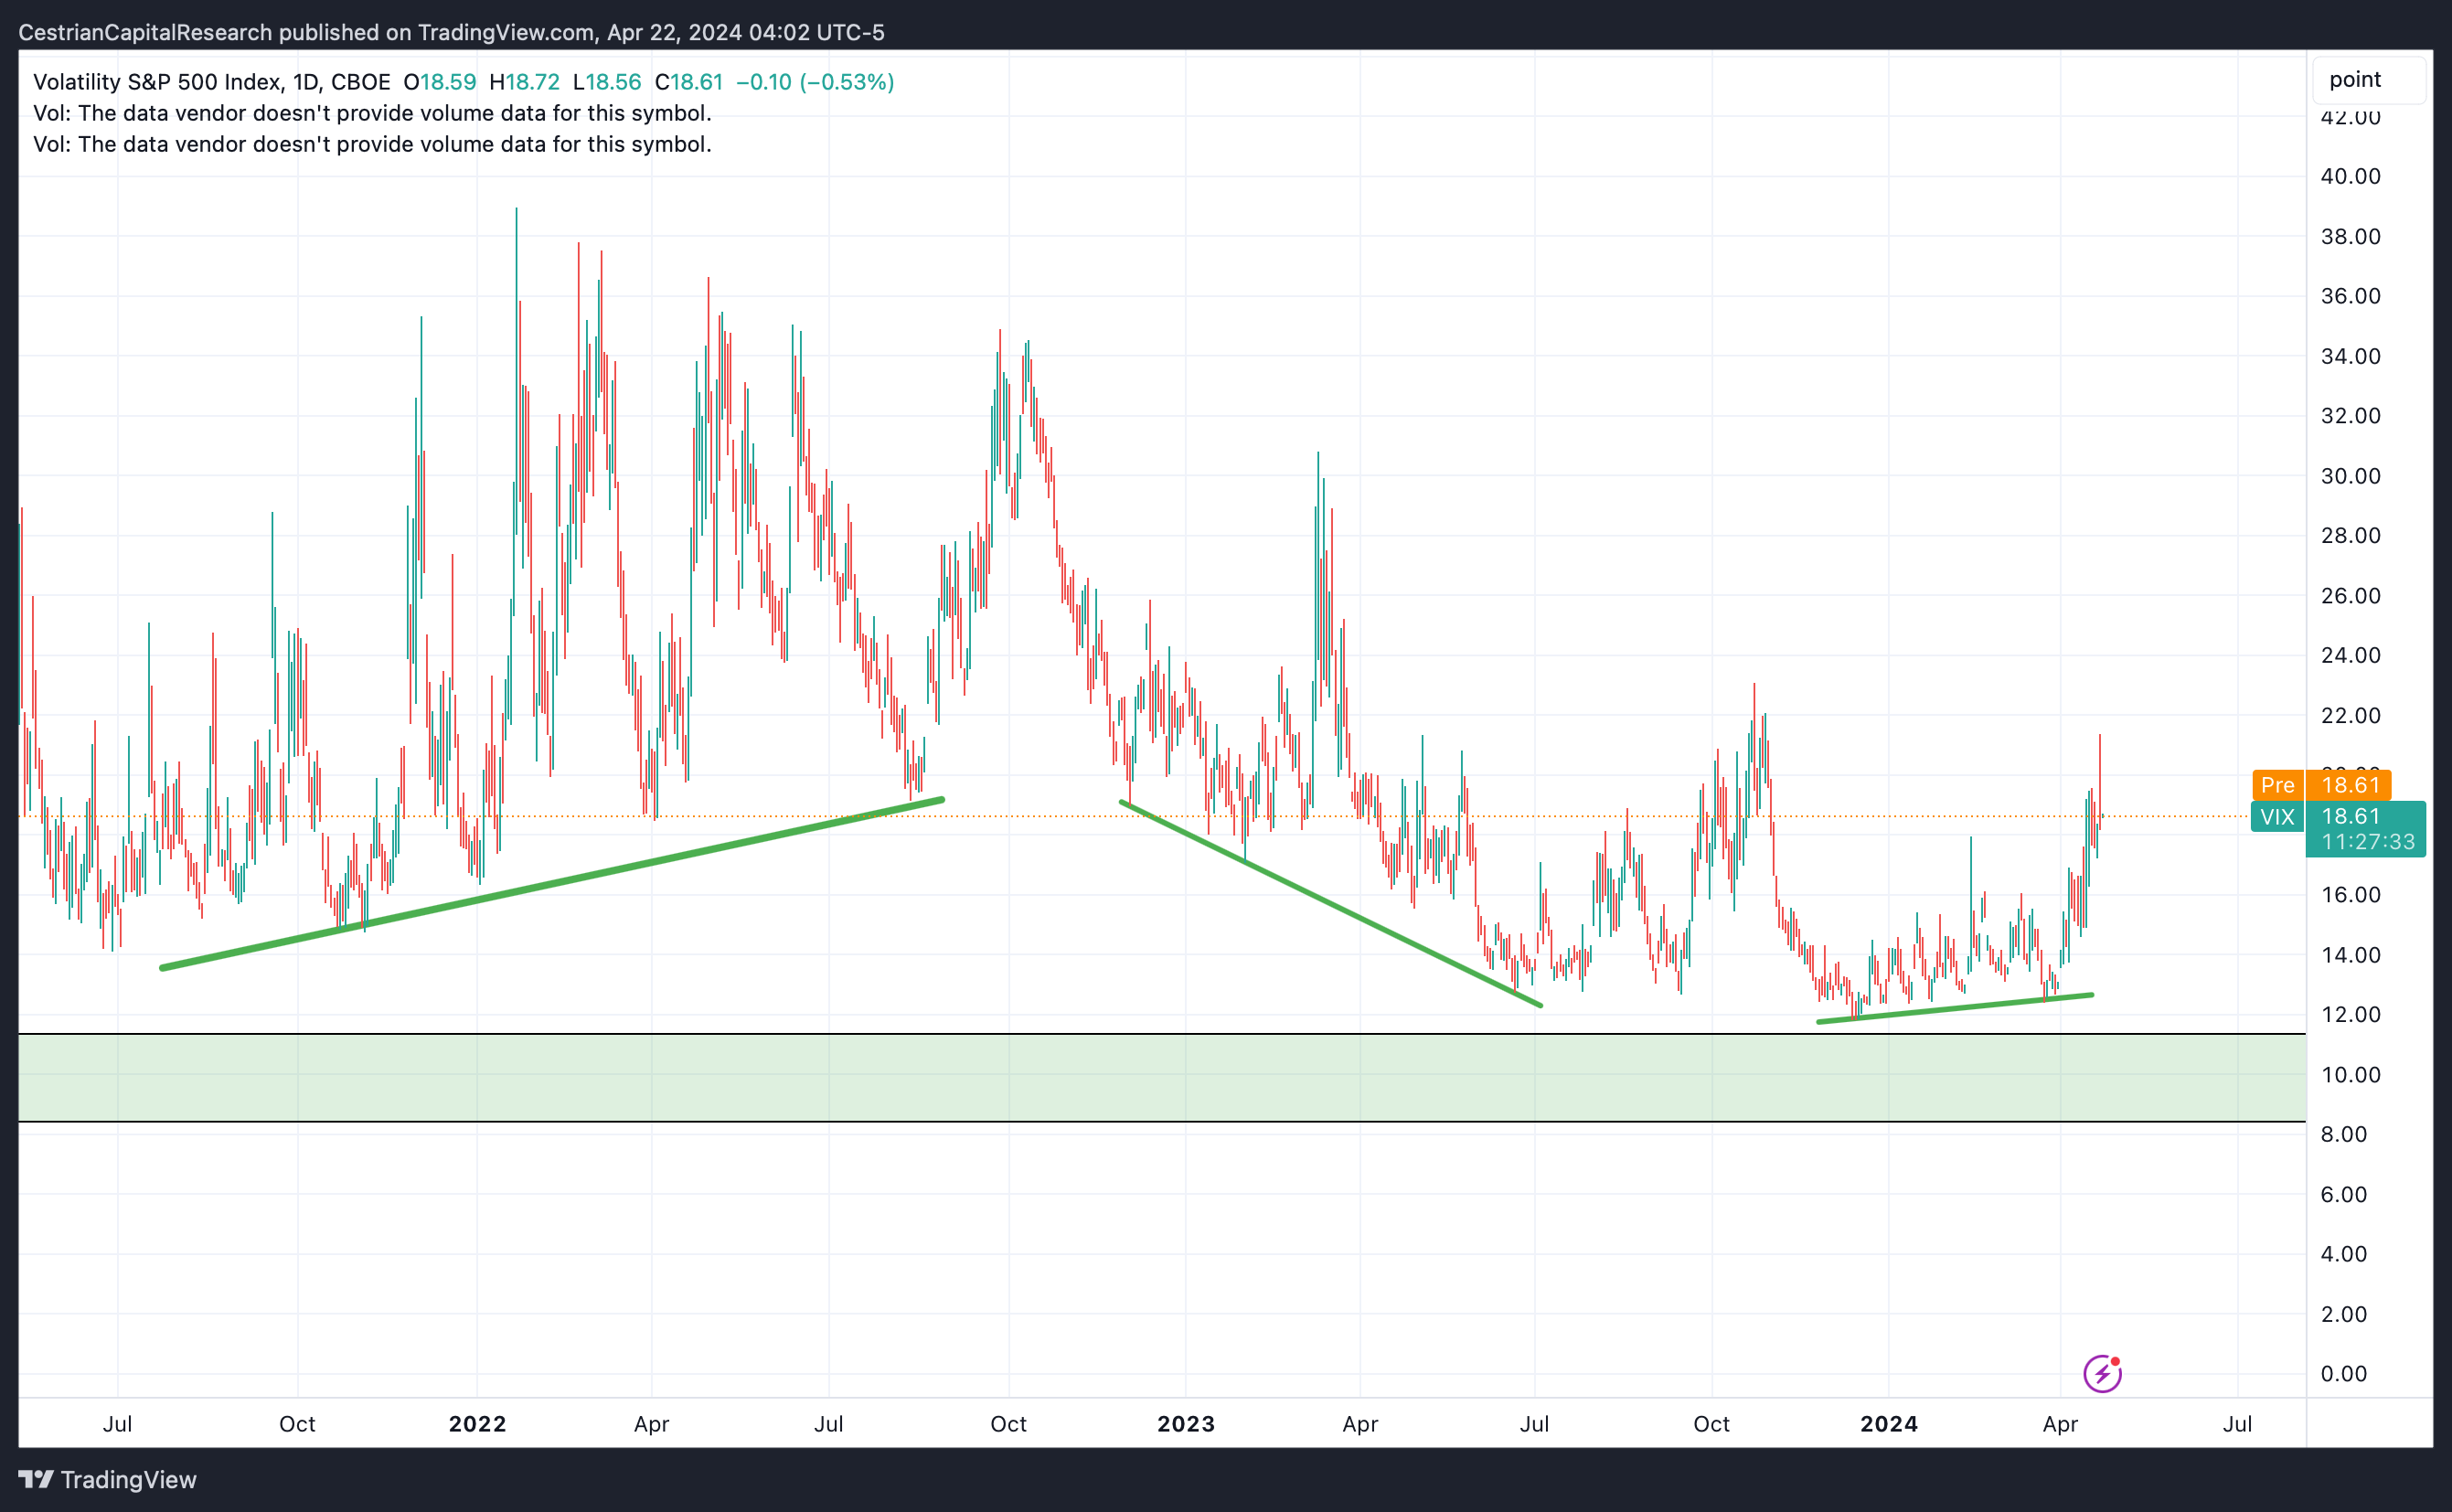
Disclosure: I am unhedged long SVXY.
Longer-Term Treasury Bonds (TLT / TMF)
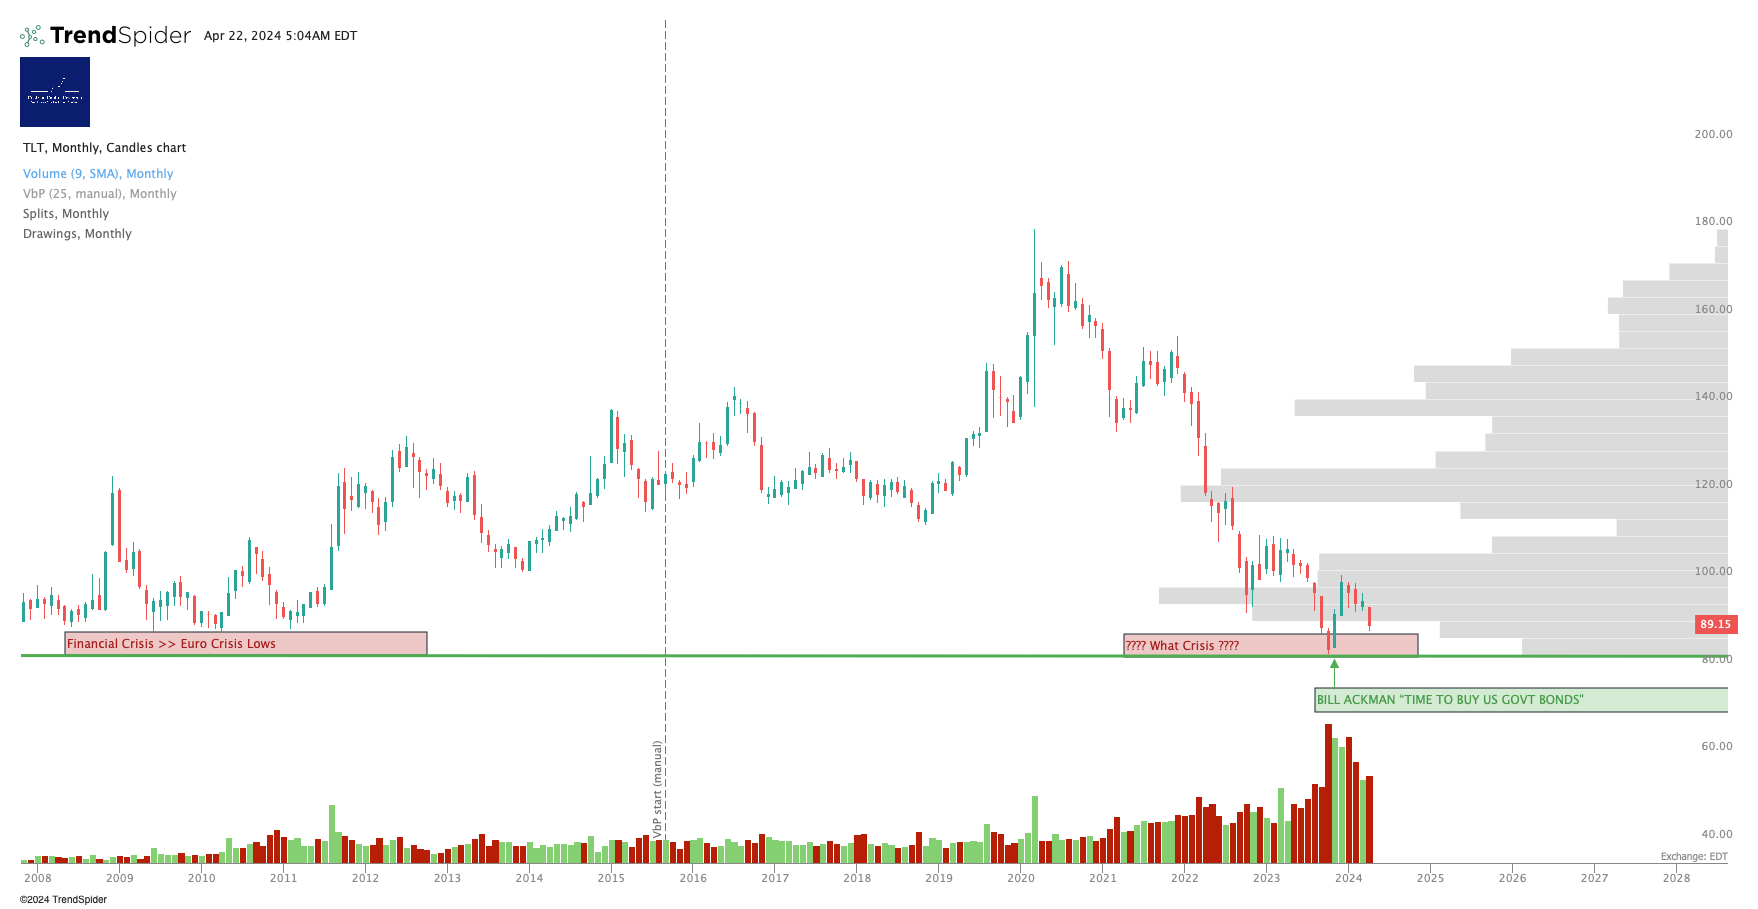
This continues to look like a 1,2 low until proven otherwise. Parameters in the chart below.
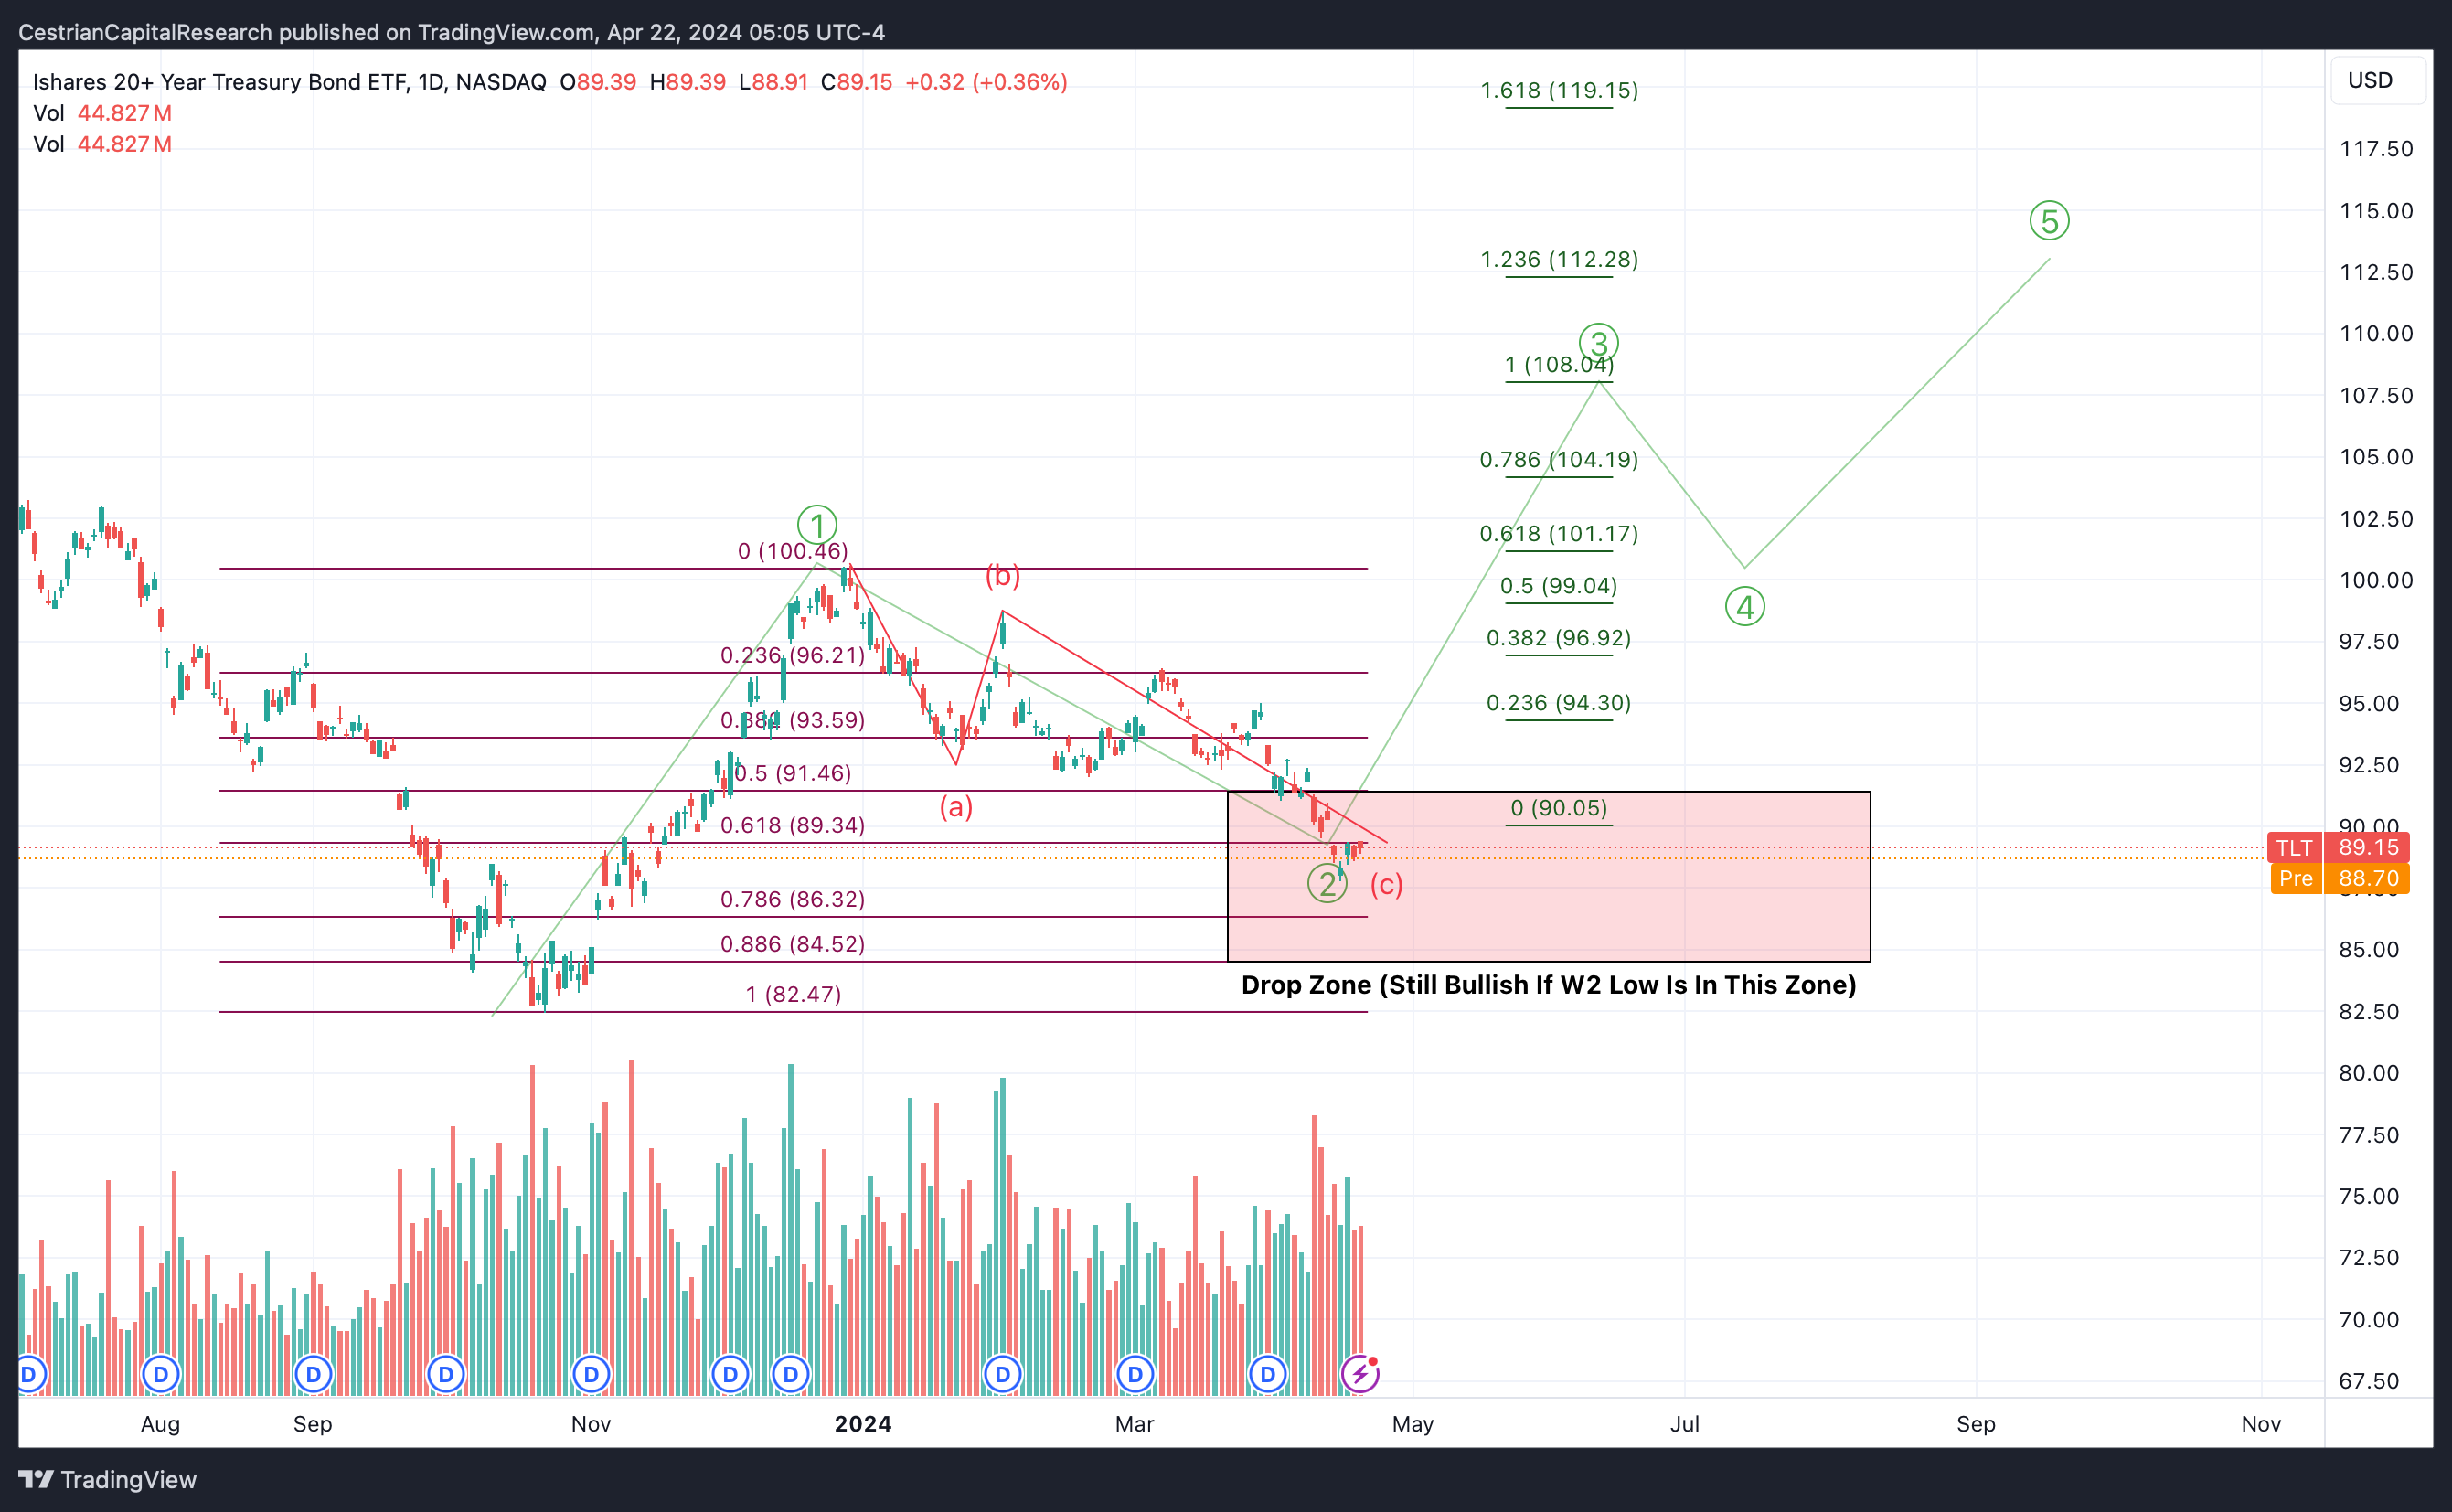
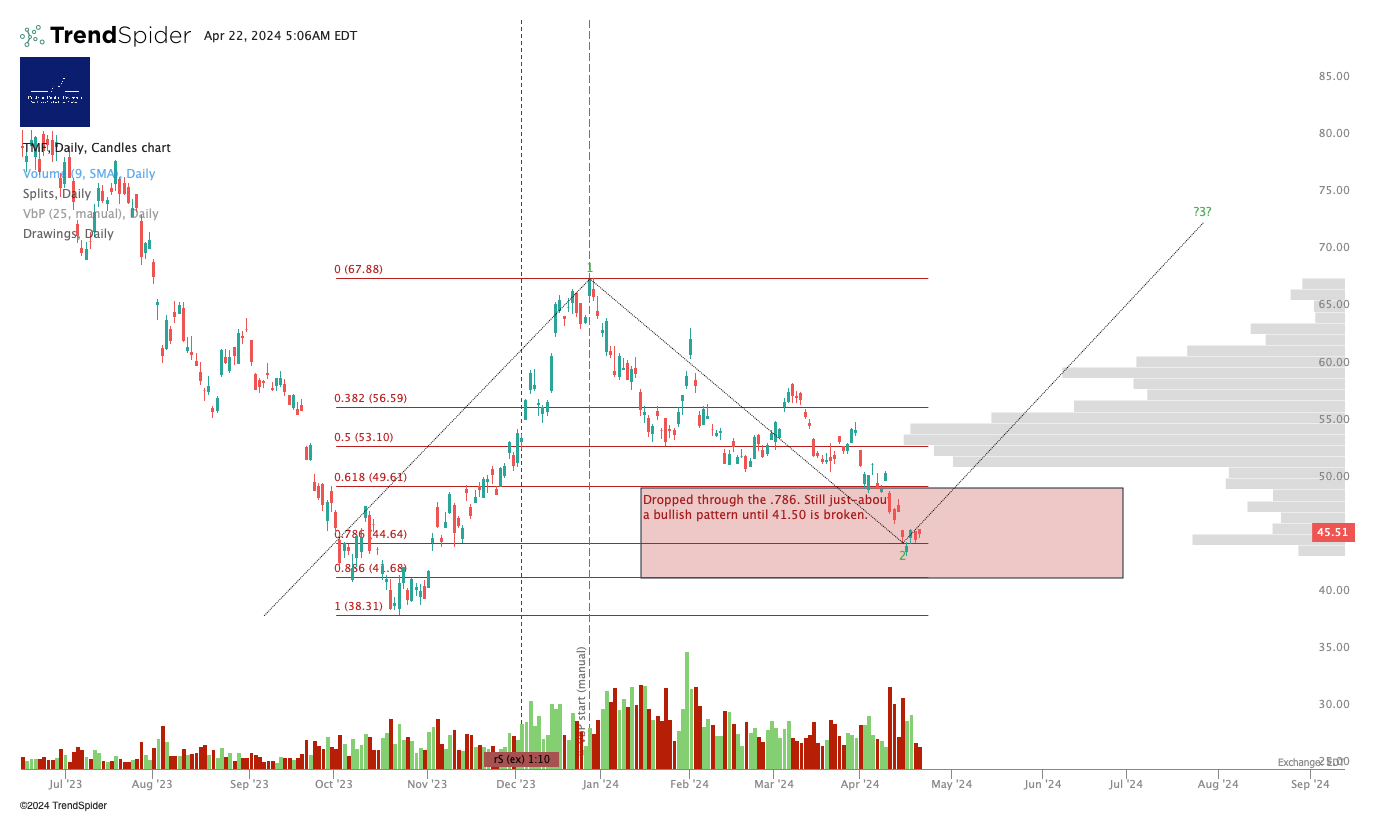
Disclosure: I am unhedged long $TMF.
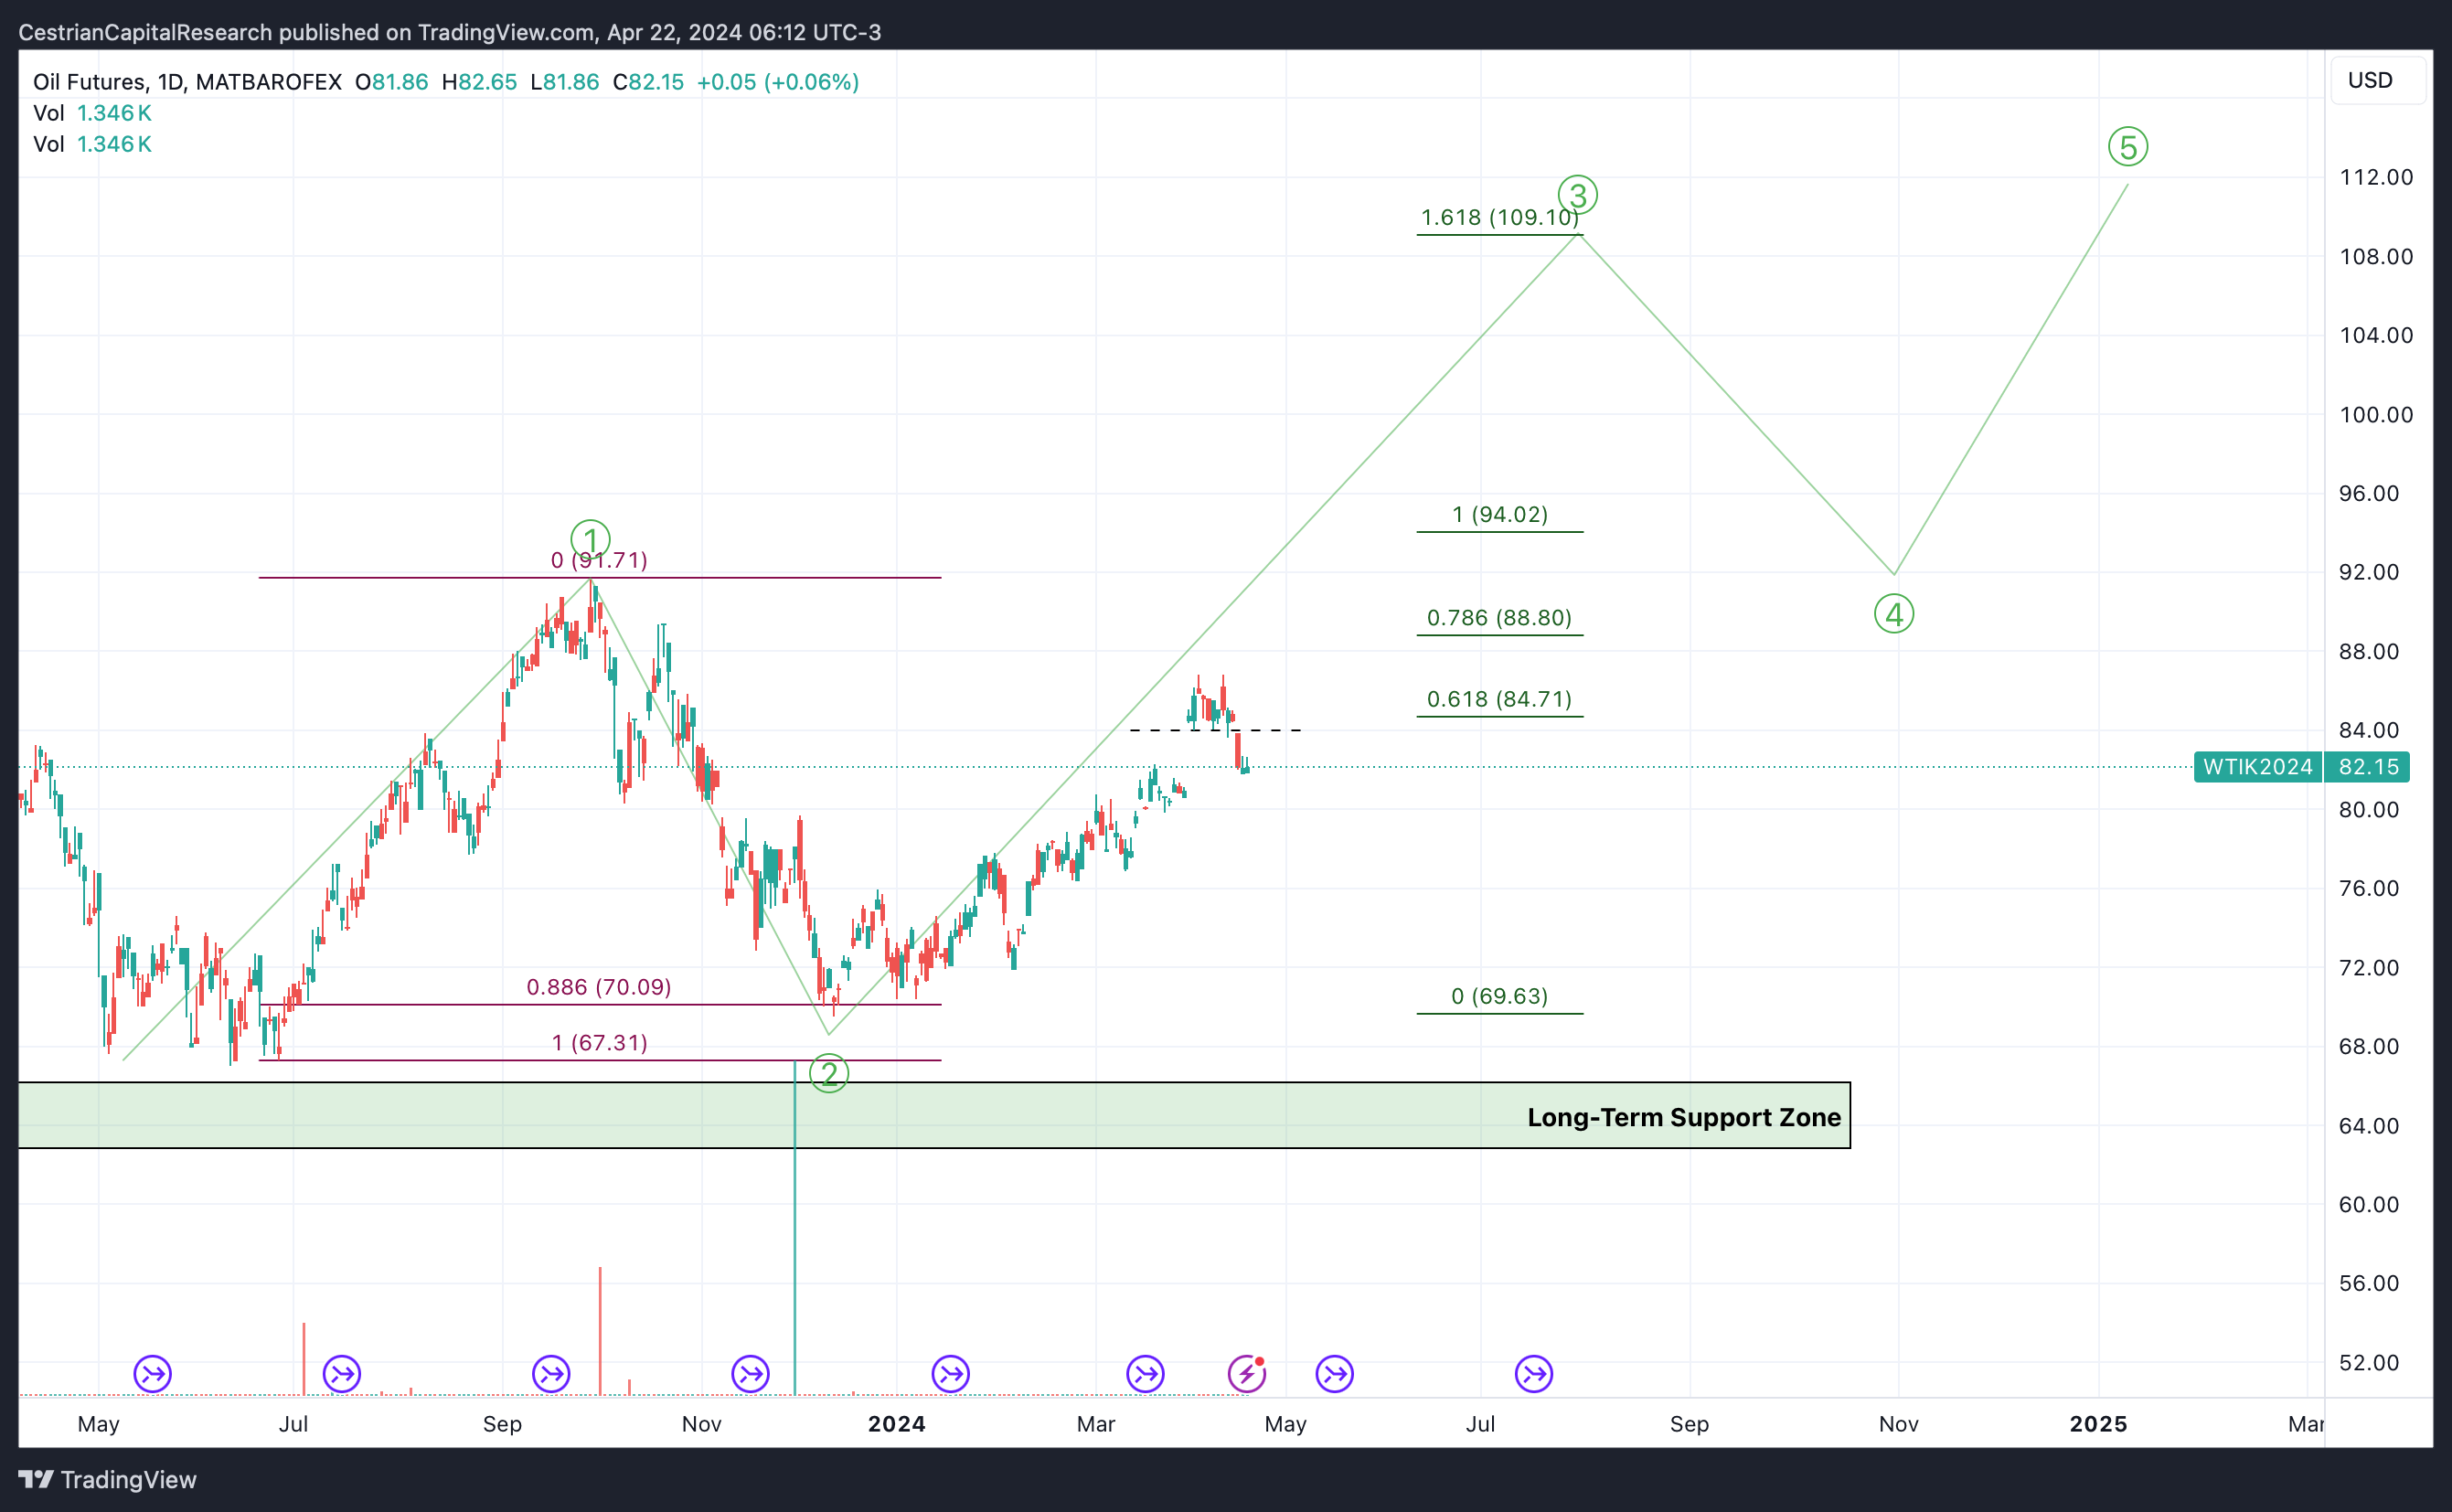
Oil (USO / WTI / UCO)
Above $84, bullish, below, bearish.
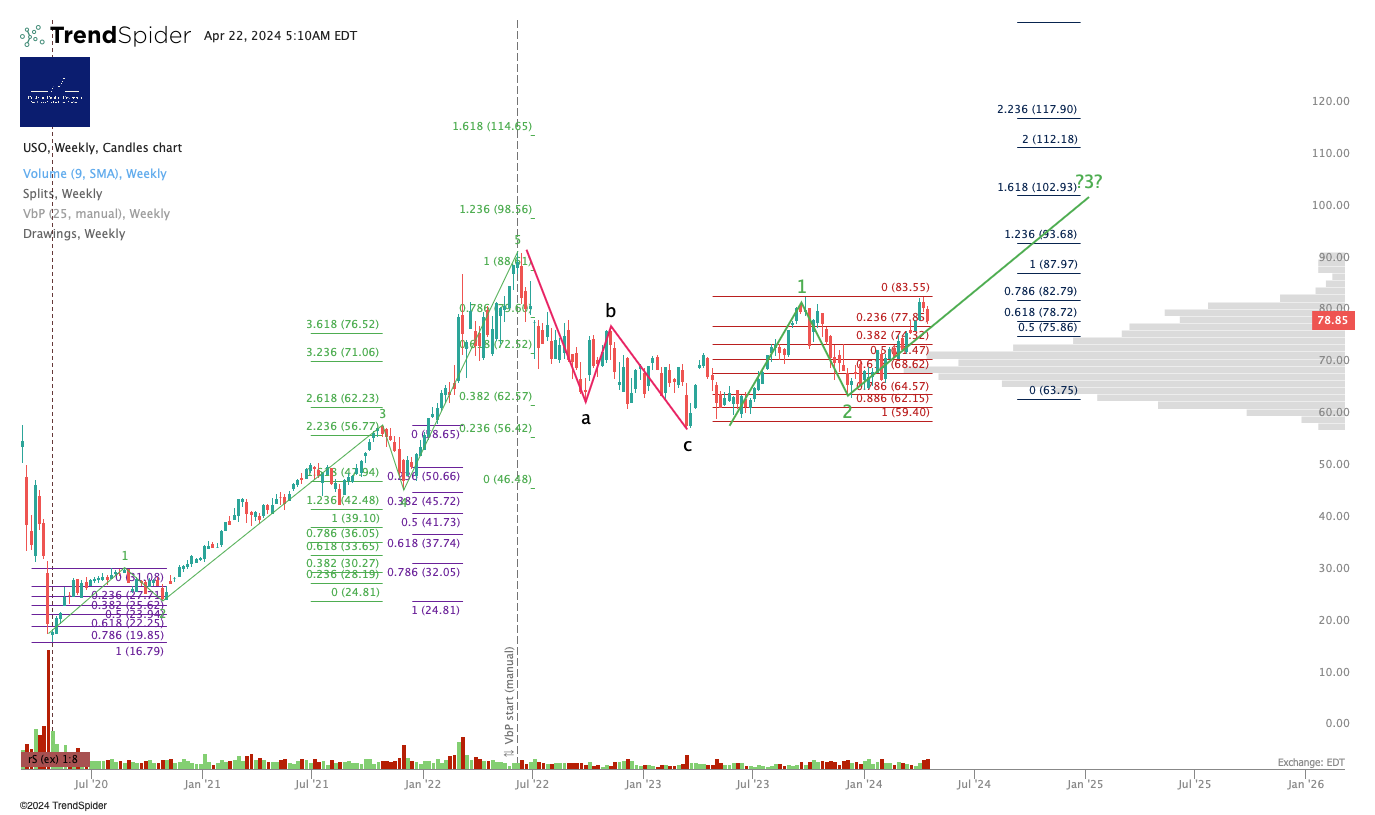
Gap filled and support potentially found.
Below $37, bearish; above, bullish. Currently $32.
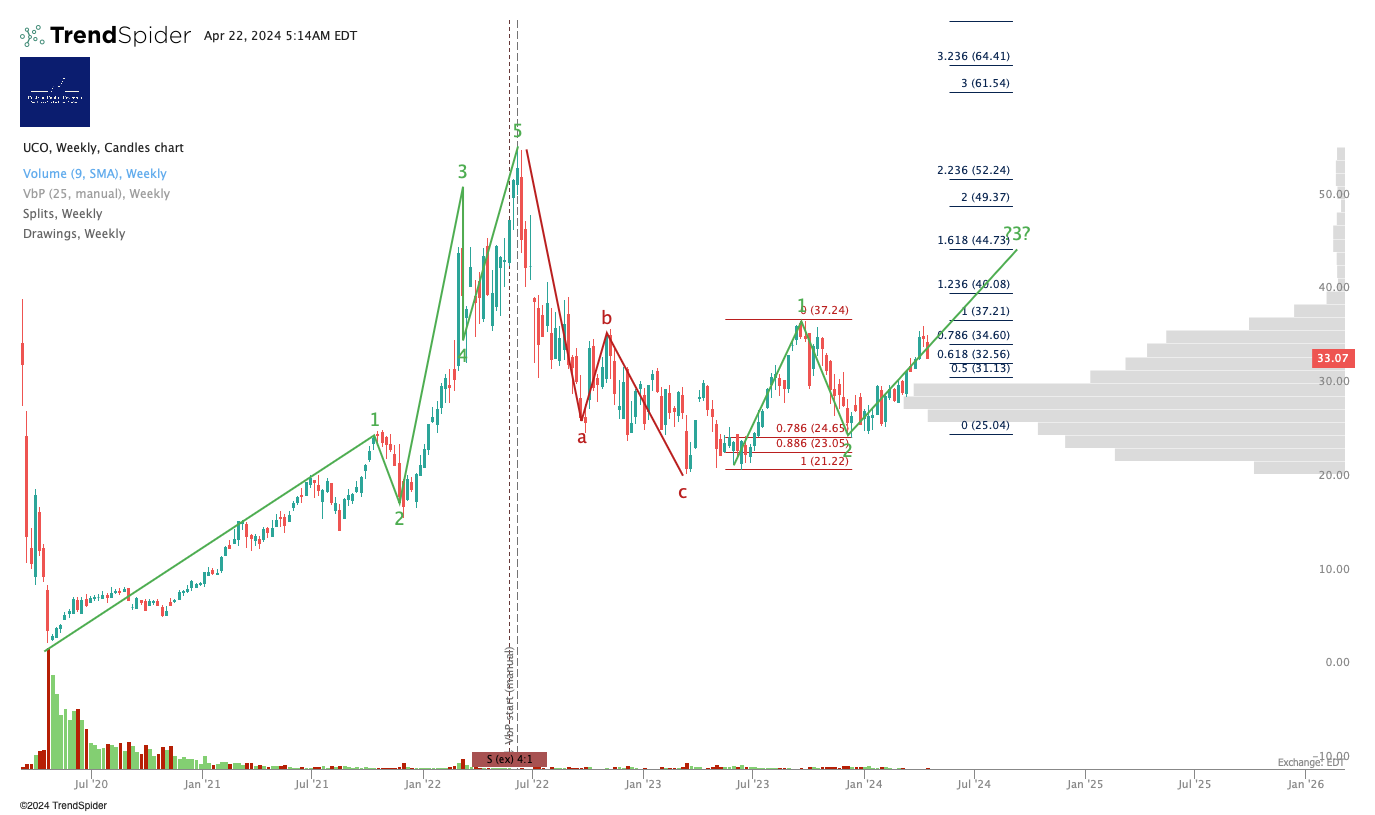
Disclosure: Long UCO. Sold SCO today to bank gains, per Slack alerts.
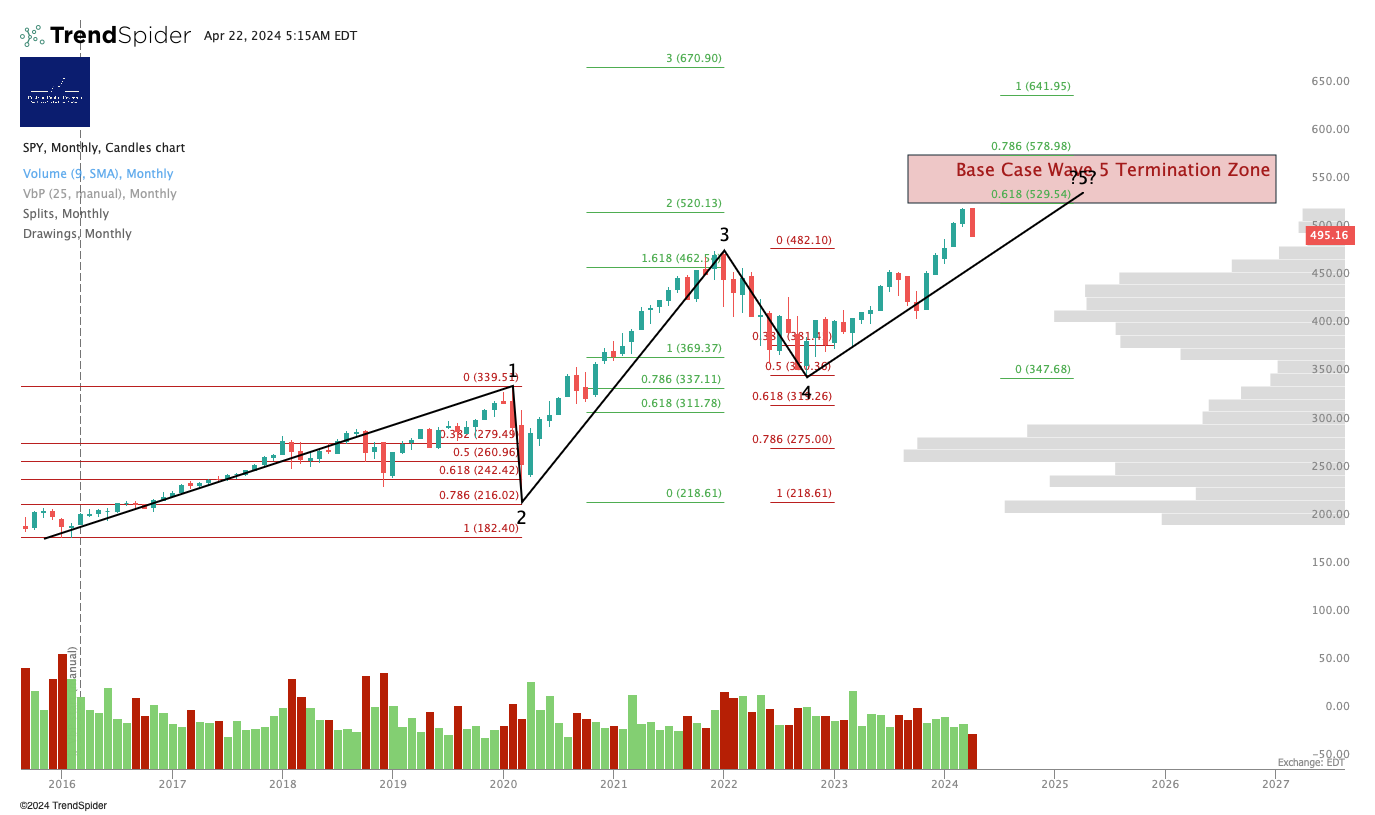
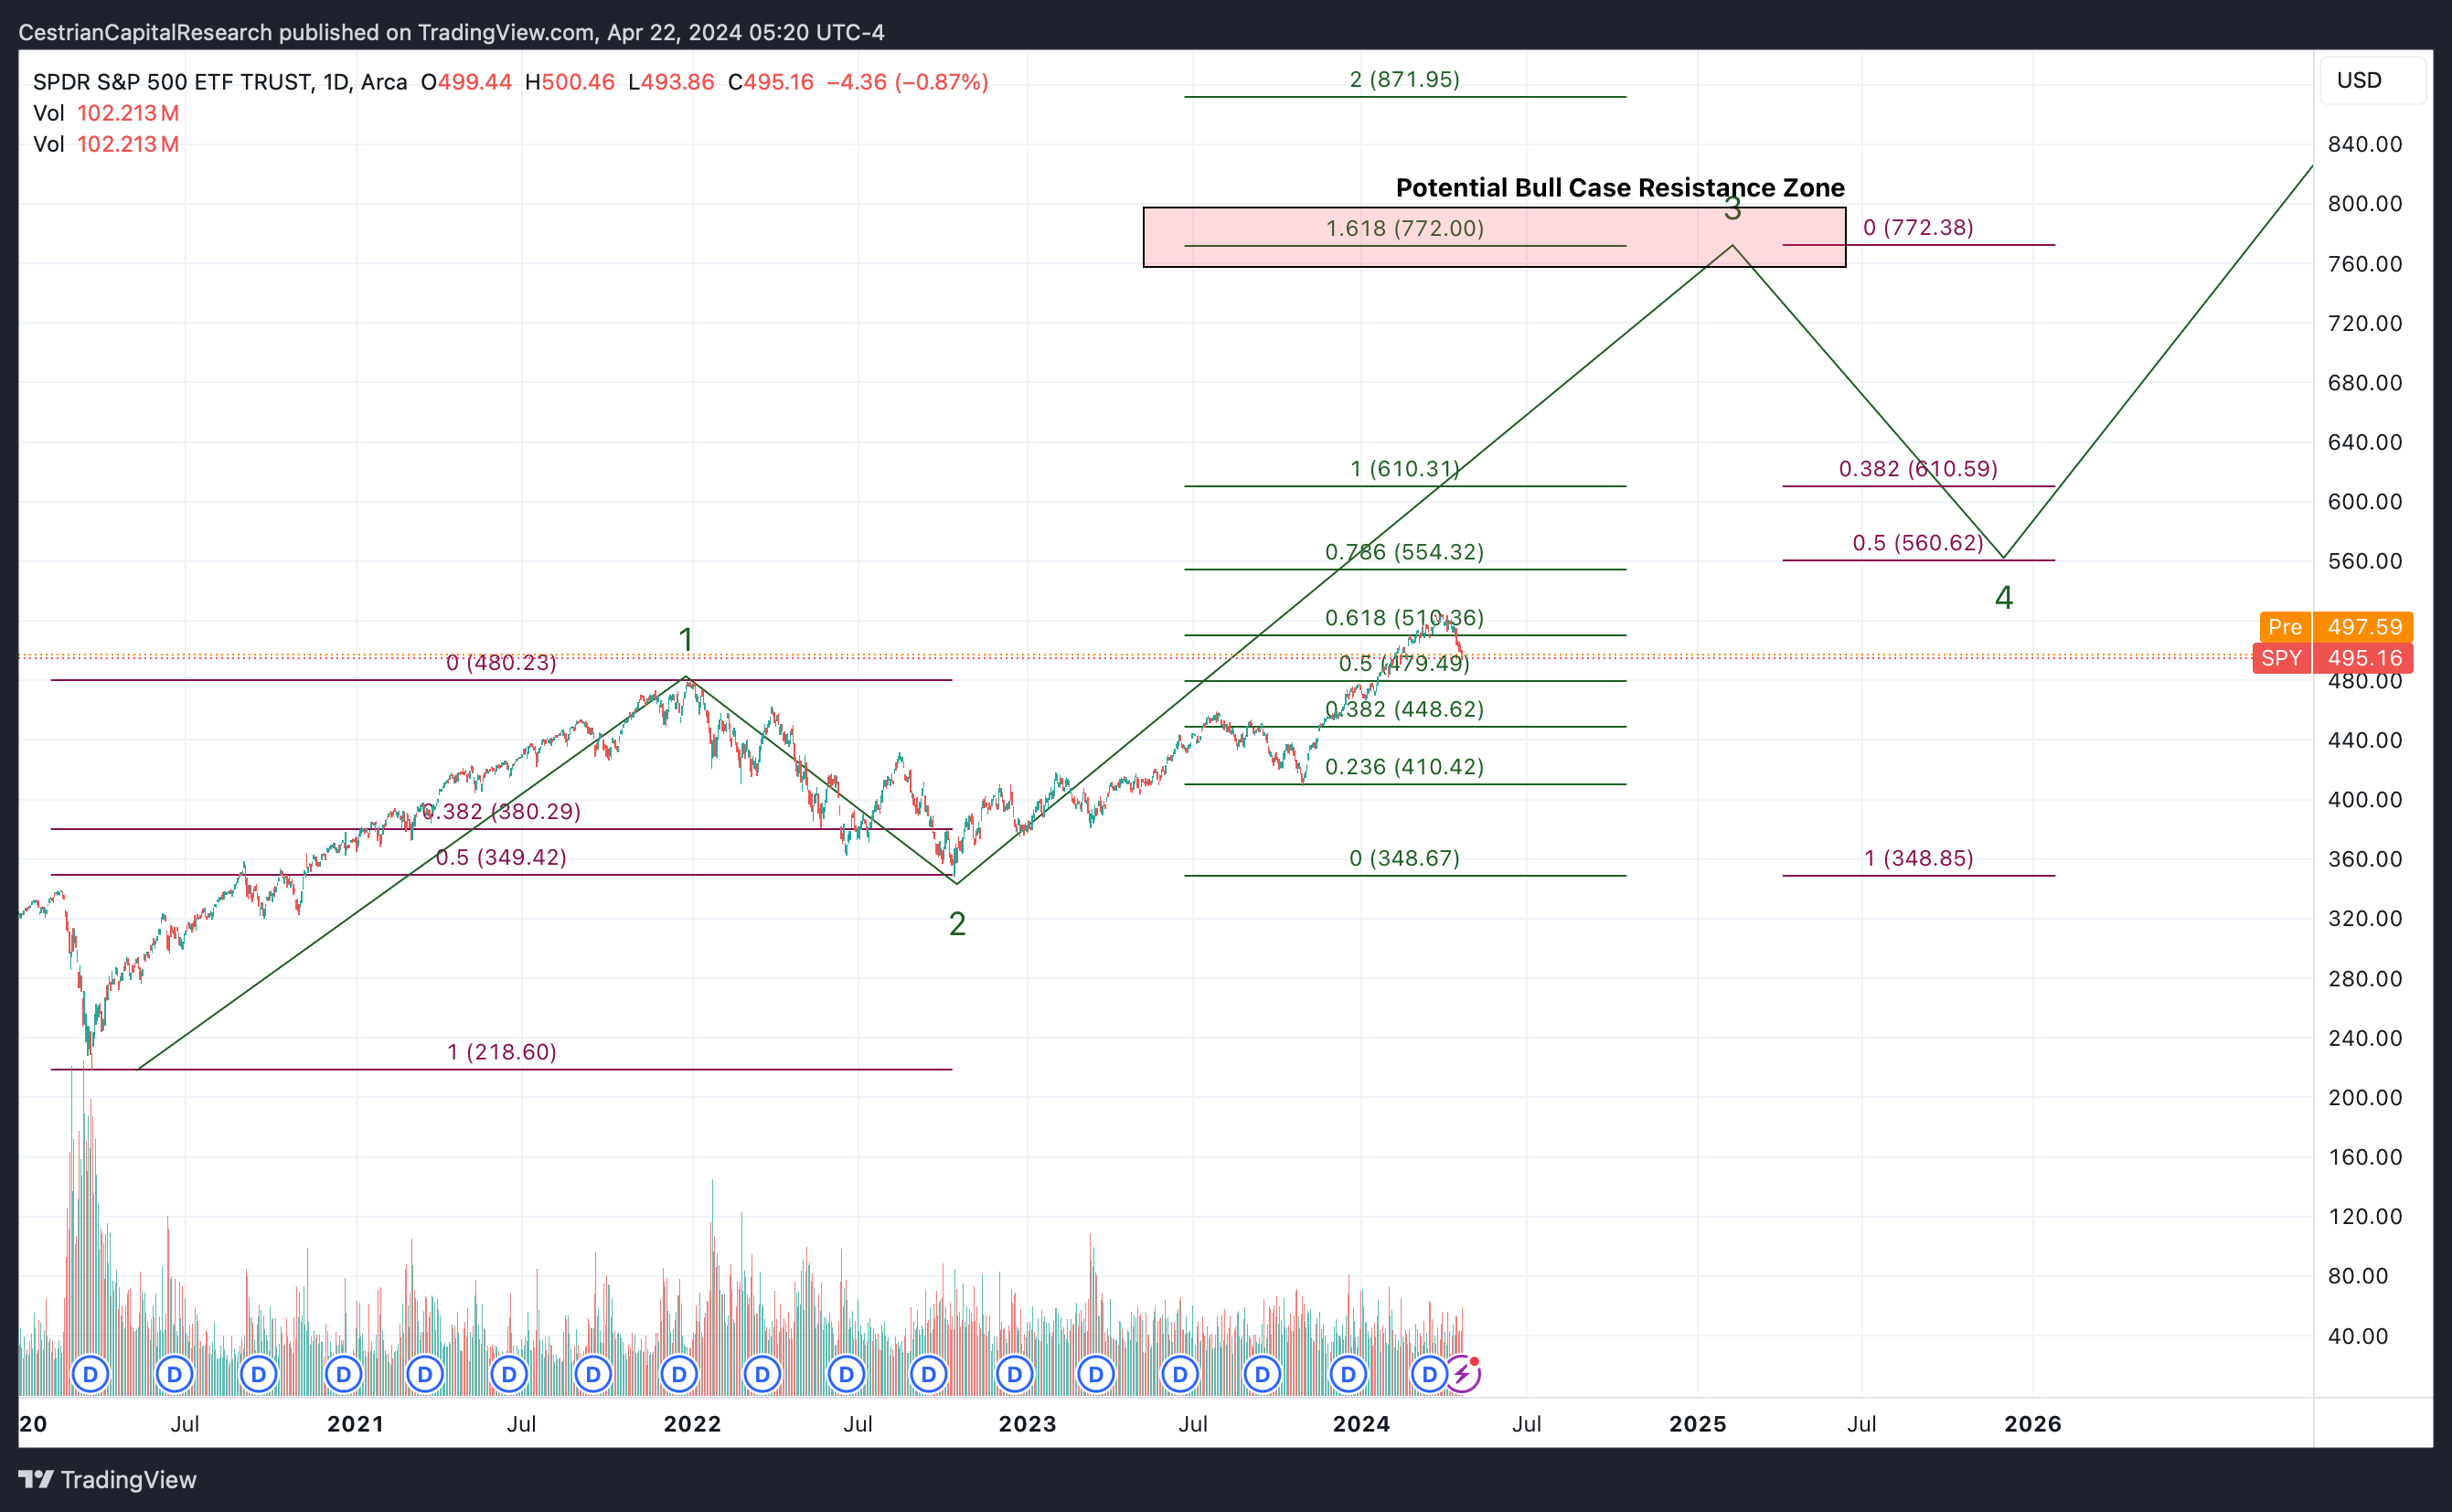
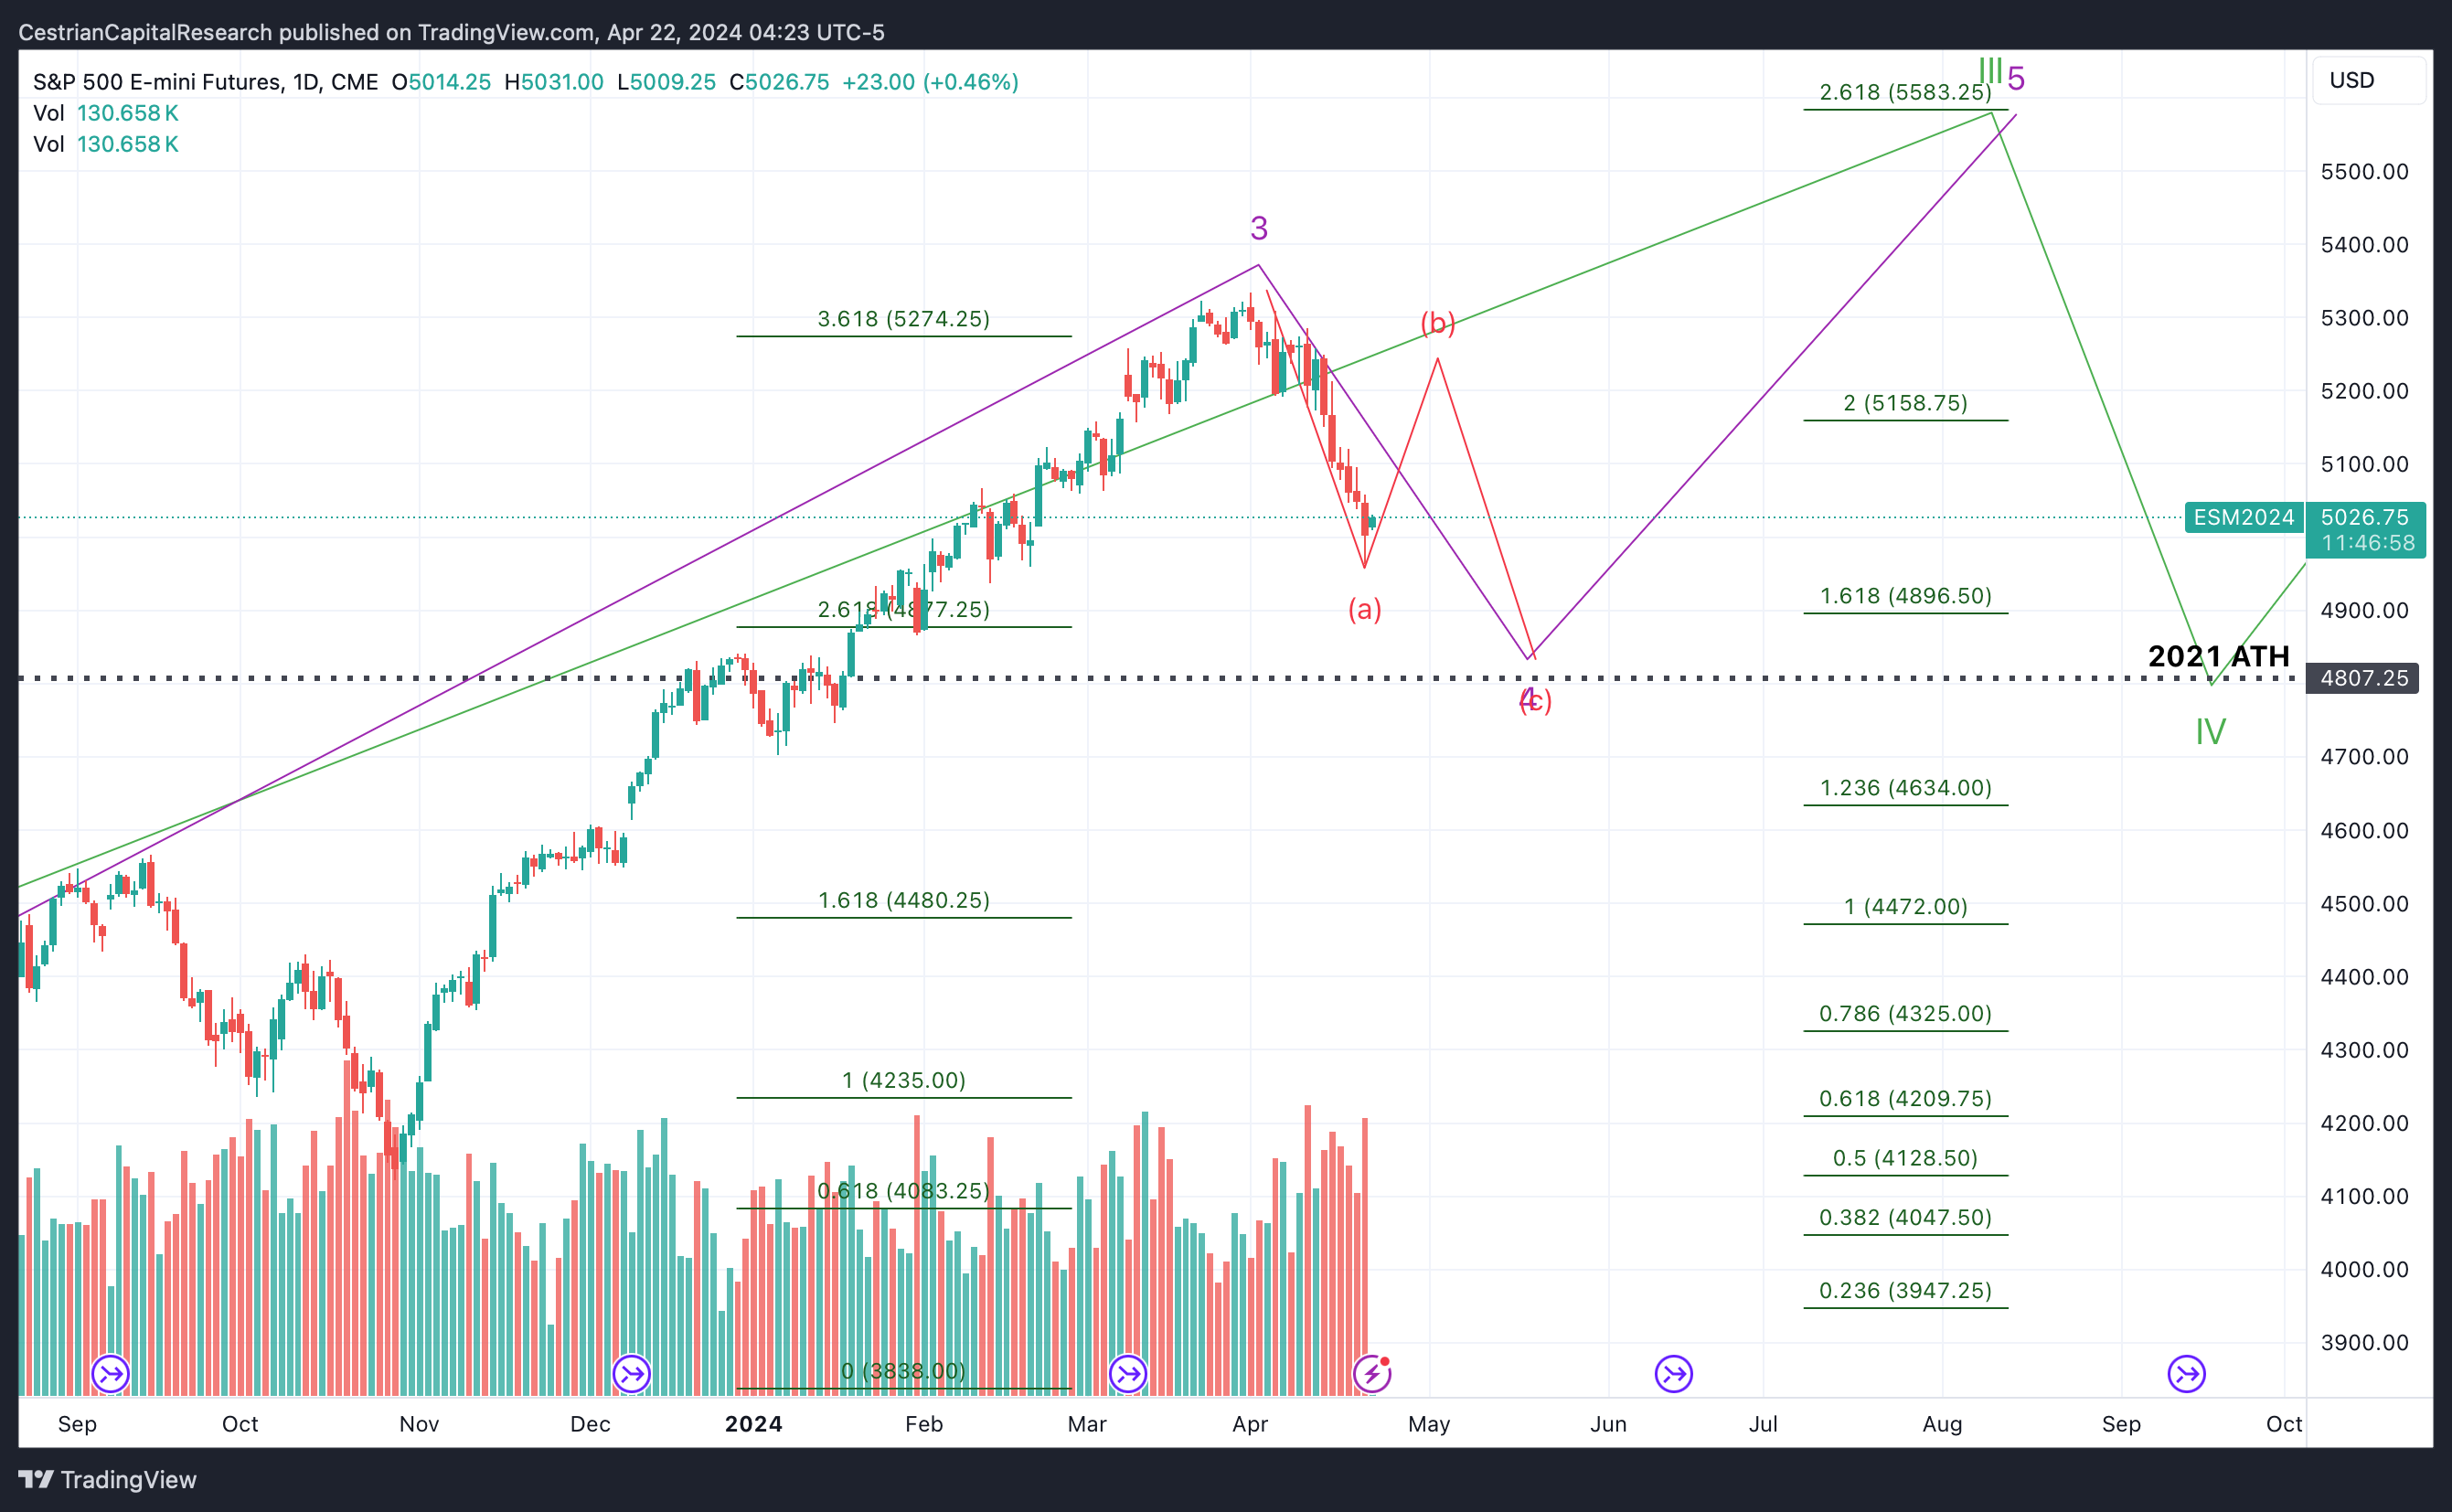
S&P500 / SPY / ES / UPRO
I continue to believe this outlook is too bearish; but we keep it as our base case for now.
My own expectation is to see a B-wave up, then a further C-wave down to lower levels than now. But this is just conjecture. One must watch price to see what price is doing.
Downside to $52 and upside to $76. Currently $60.
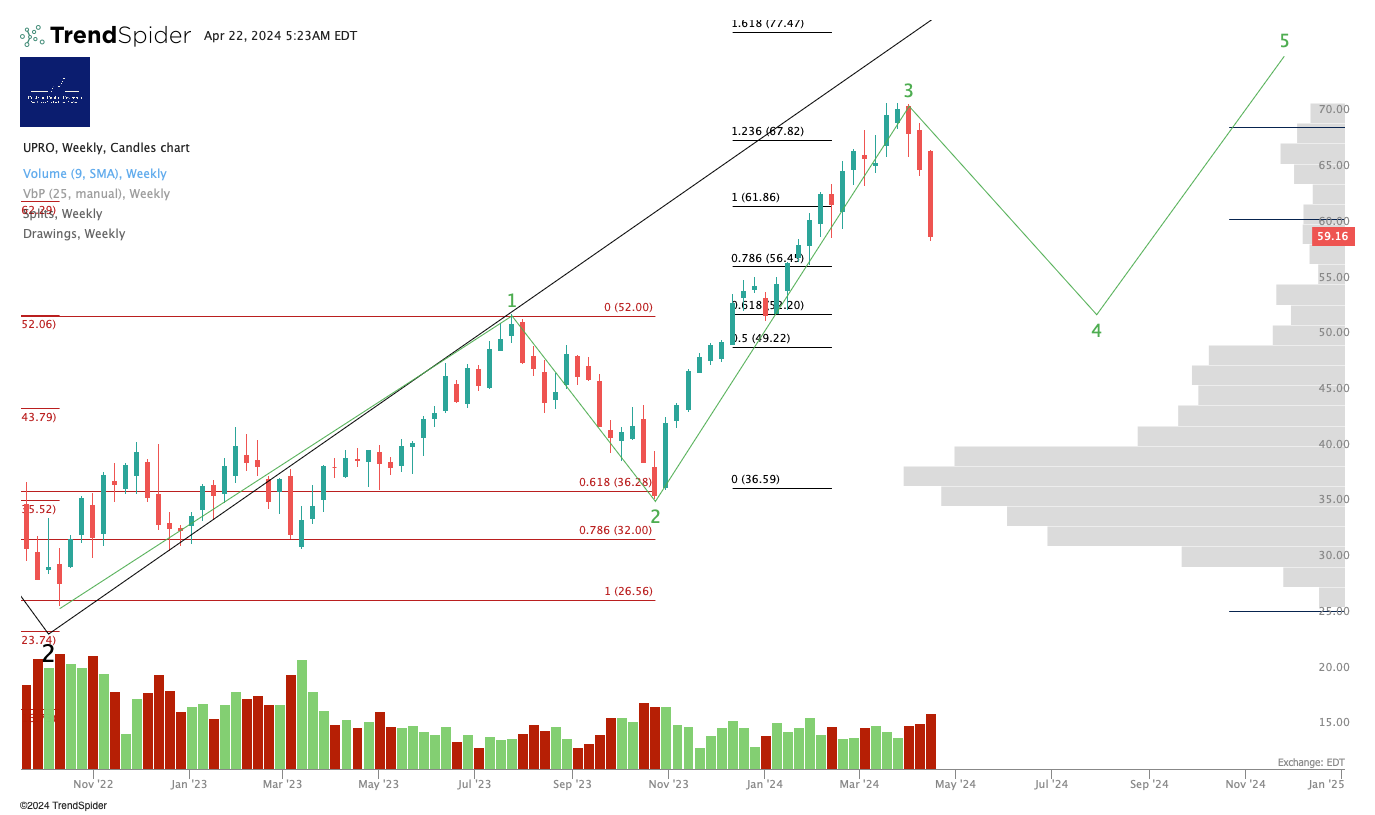
Disclosure: I am unhedged long the S&P via $UPRO and $3USL (an EU UCITS equivalent to UPRO).
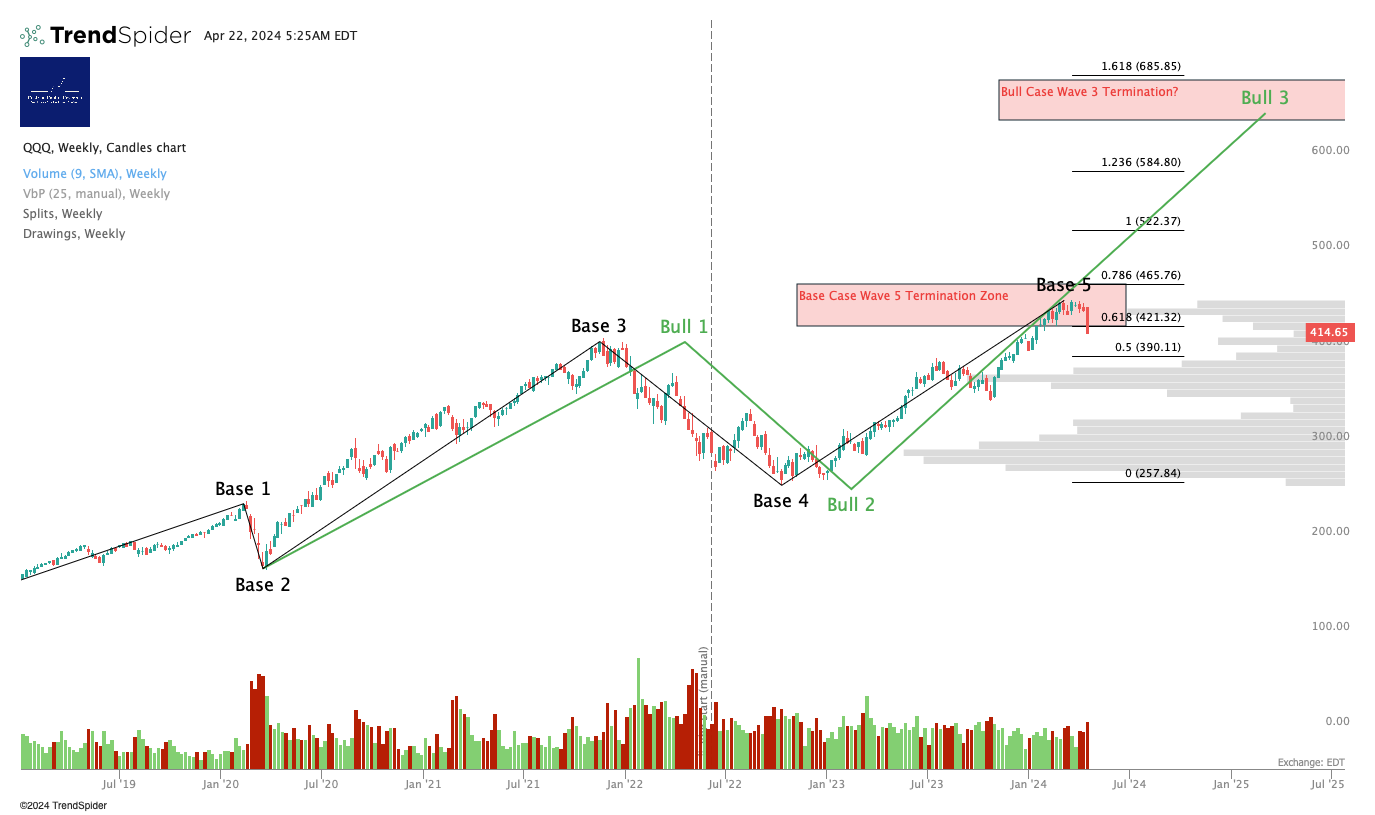
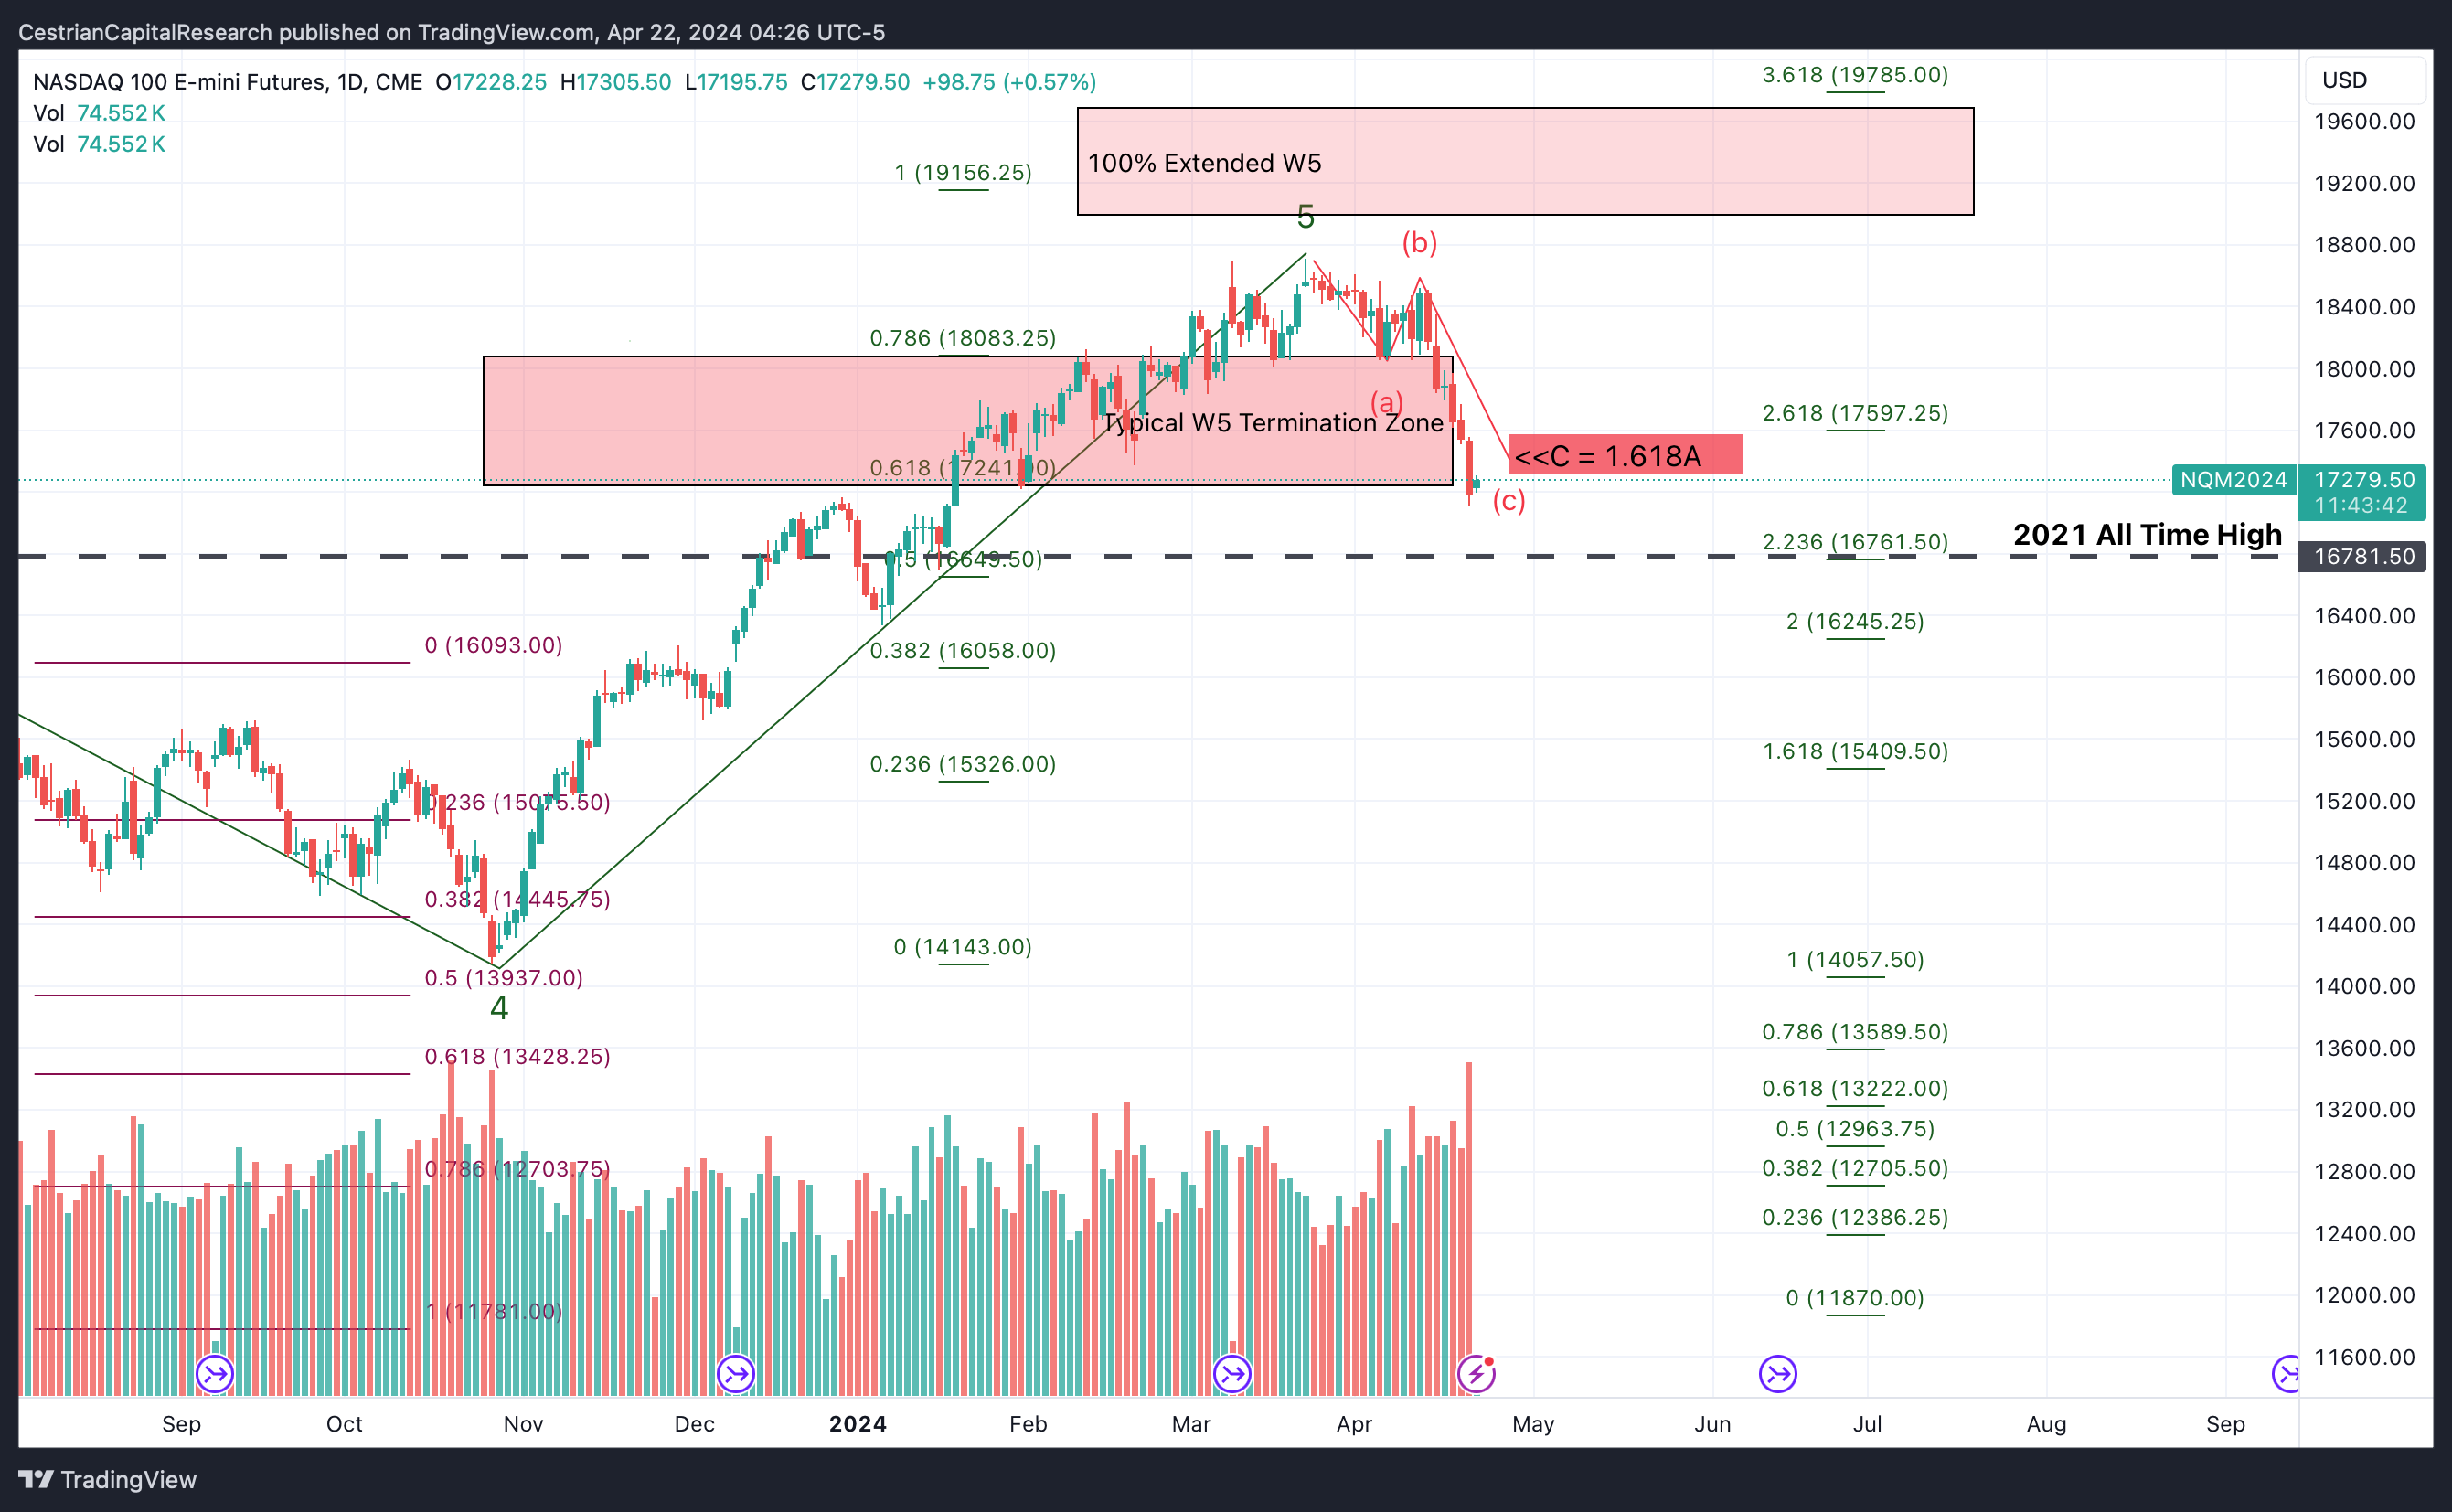
Nasdaq-100 / QQQ / NQ / TQQQ
Base vs Bull Case - Larger degree:
Absent free-er money from the Fed, solid tech earnings are likely needed to push the Qs upwards from here. I think it’s all about Microsoft, personally. Big earnings week this week so, anything can happen.
Thursday I flagged the breakdown past C=A and said that C=1.618A was the next level to watch. Well, that got blown through too!
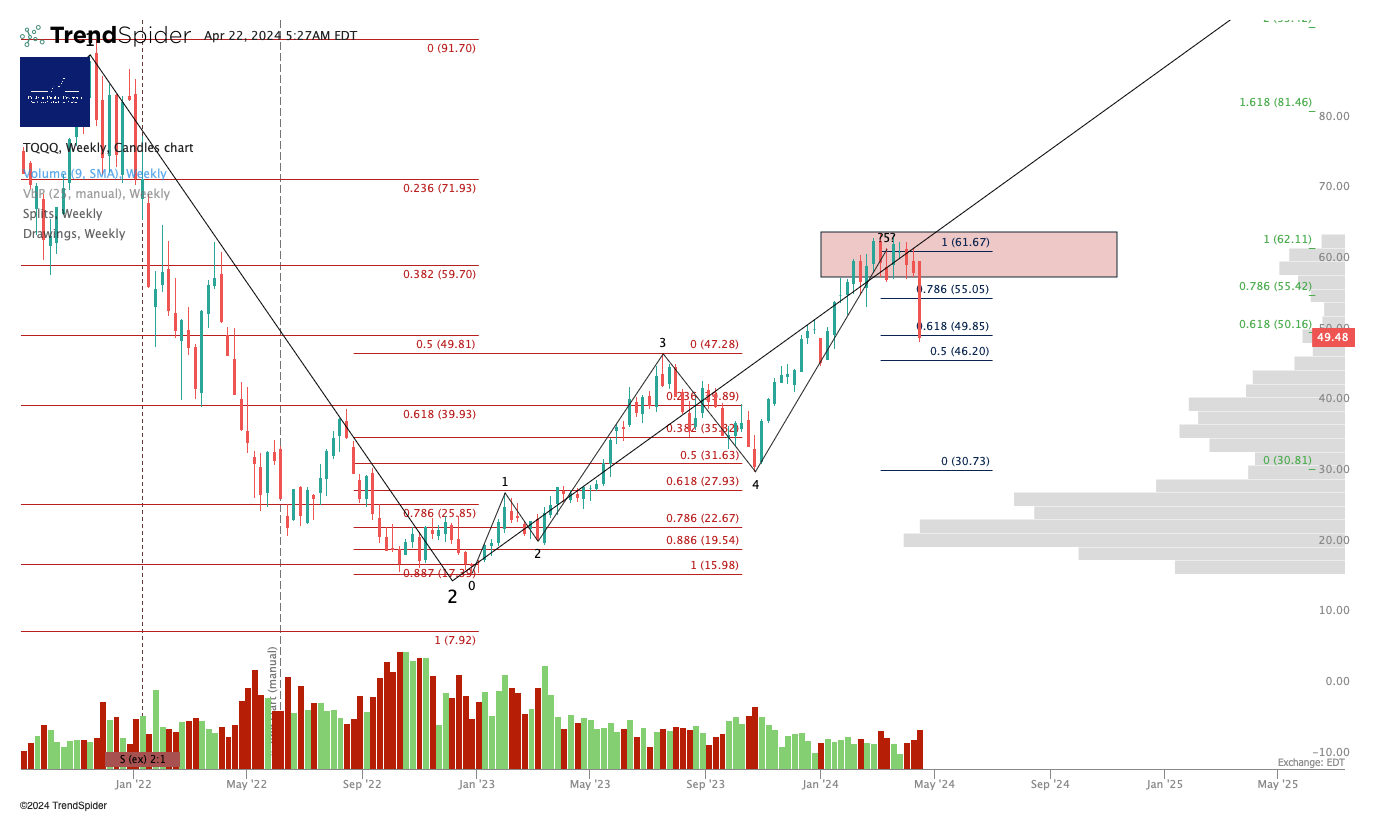
Disclosure: I am unhedged long TQQQ and also long the Nasdaq in long term accounts using $QQQ3 (an EU UCITS equivalent to TQQQ).
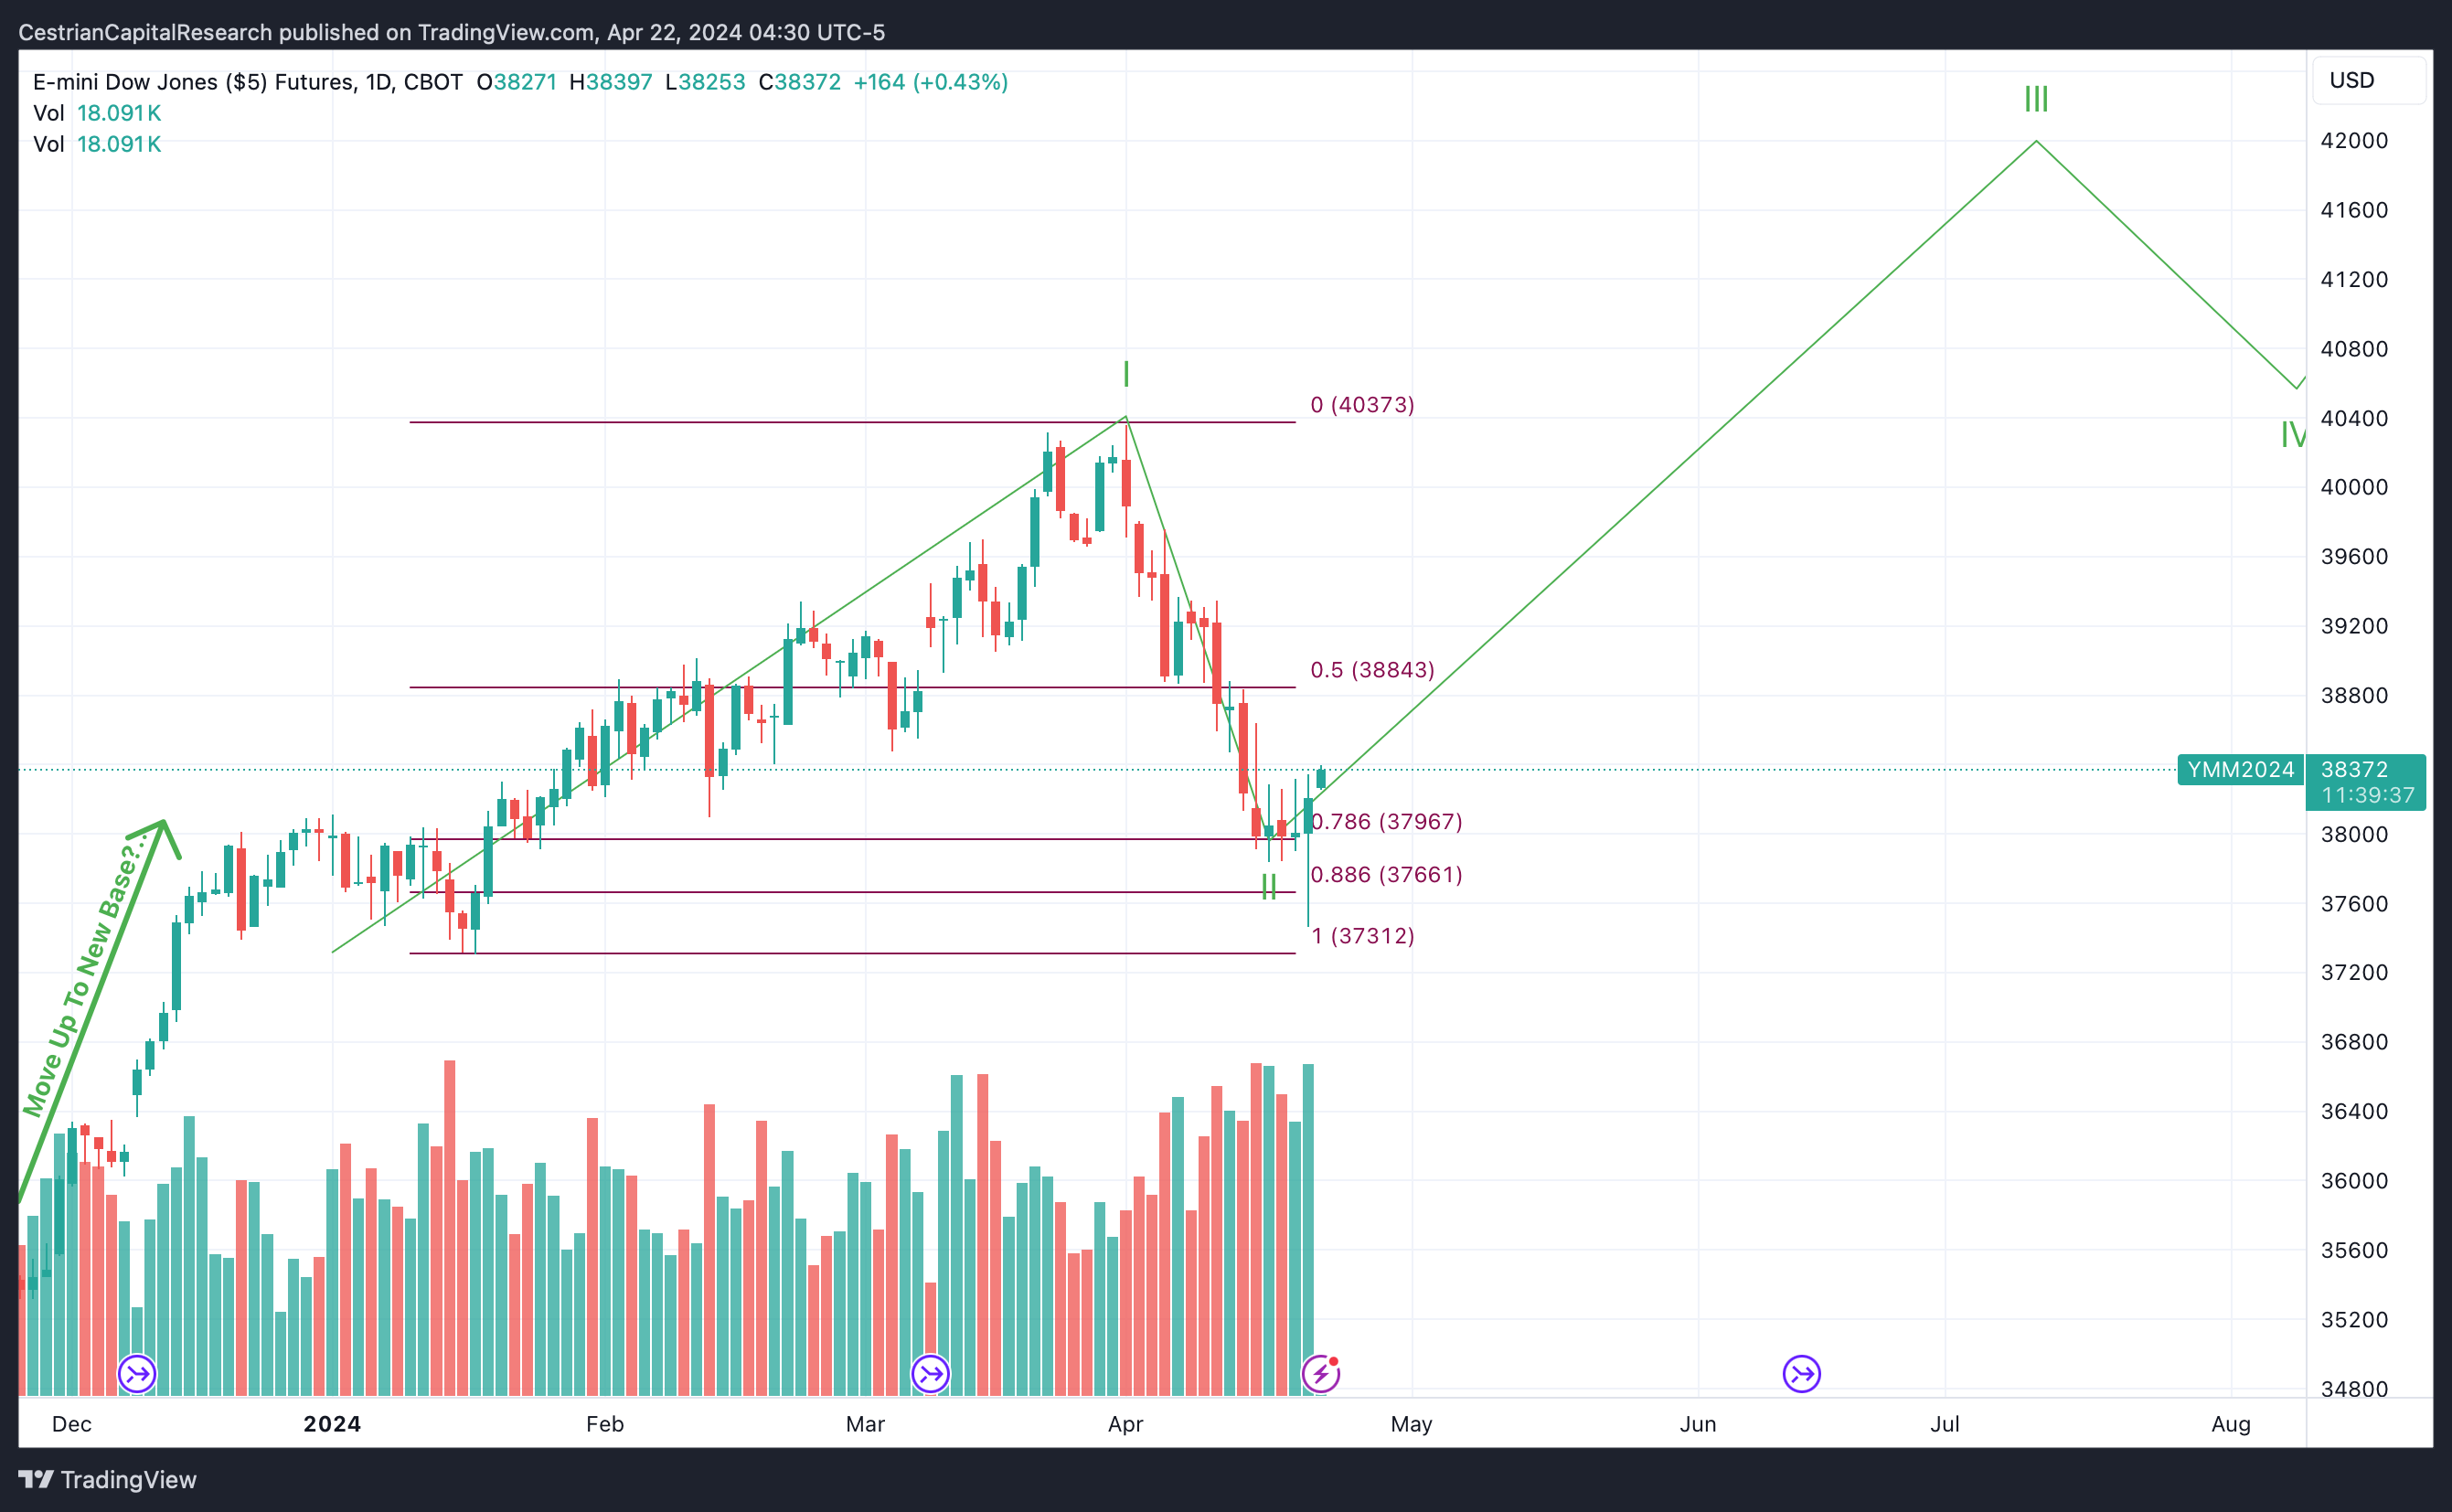
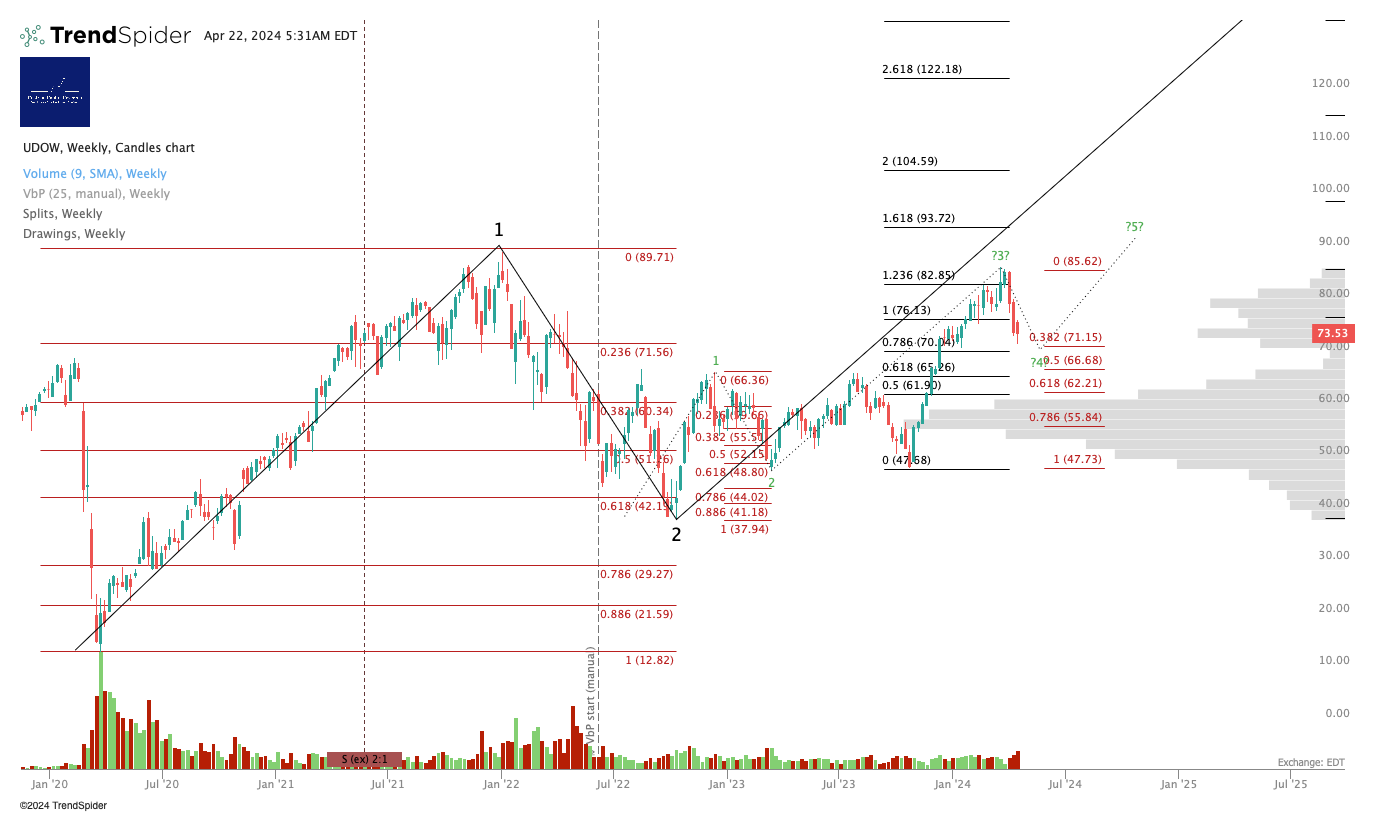
Dow Jones / DIA / YM / UDOW
Base vs. Bull Case - Larger Degree
The Dow is looking very constructive at present, for the reasons noted above.
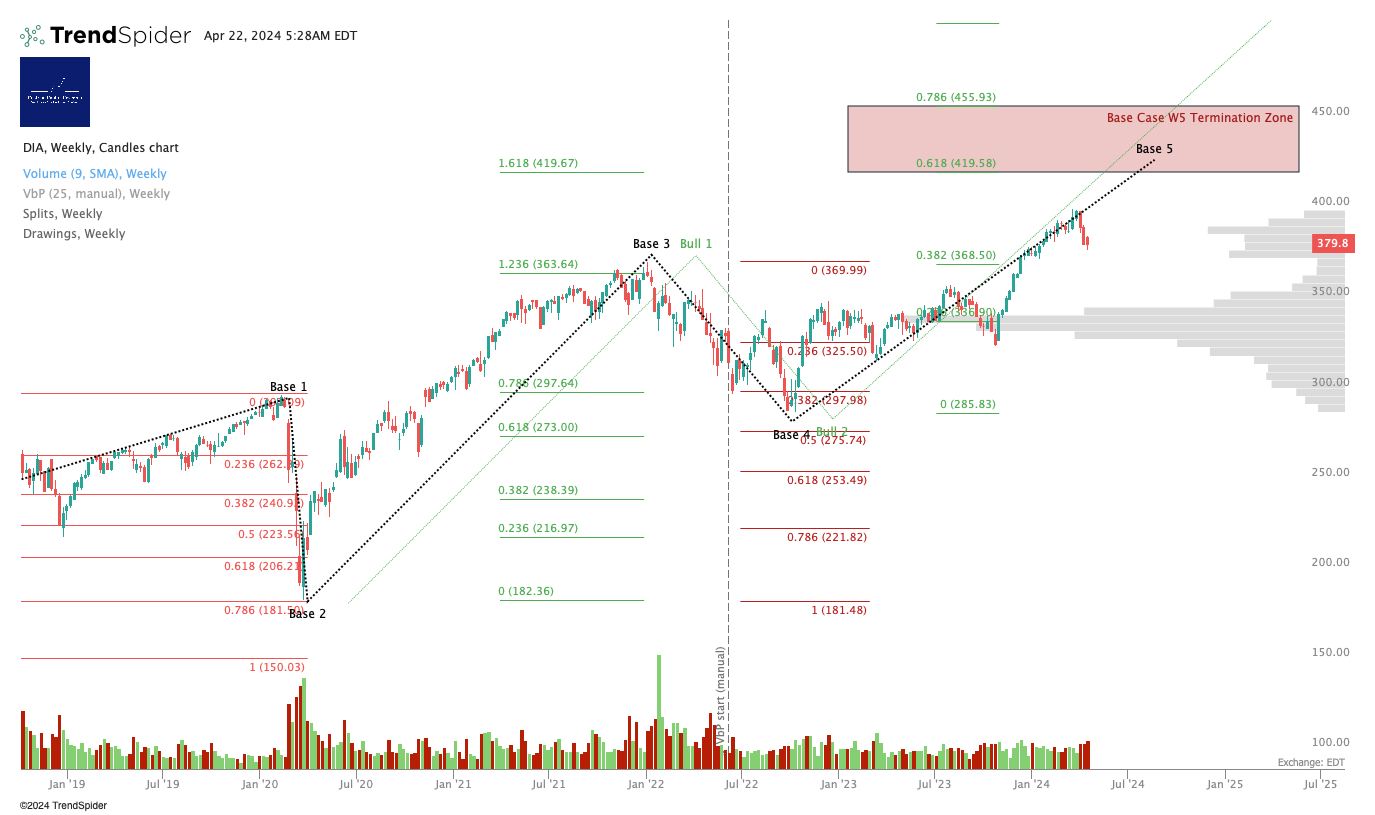
So far that .786 retrace has held for four days, which is bullish; the Dow was up Friday, which is more bullish!
Personal Trading Plan Disclosure: I am unhedged long $UDOW.
Russell 2000 / IWM / RTY / TNA
The Russell short term chart is very bullish, but recapturing $200 remains the key level for long-term up-moves.
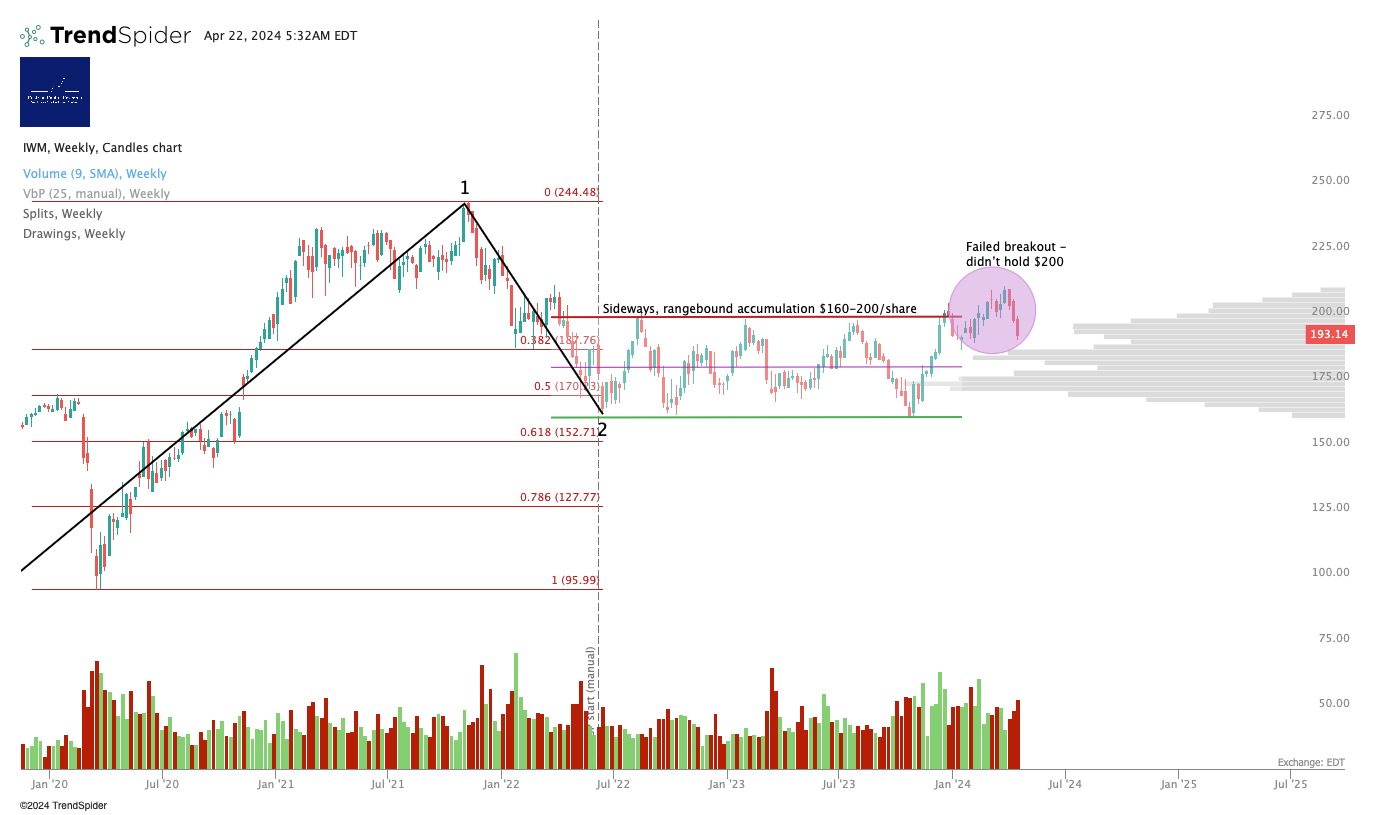
Most likely RTY is in a new Wave 1 up.
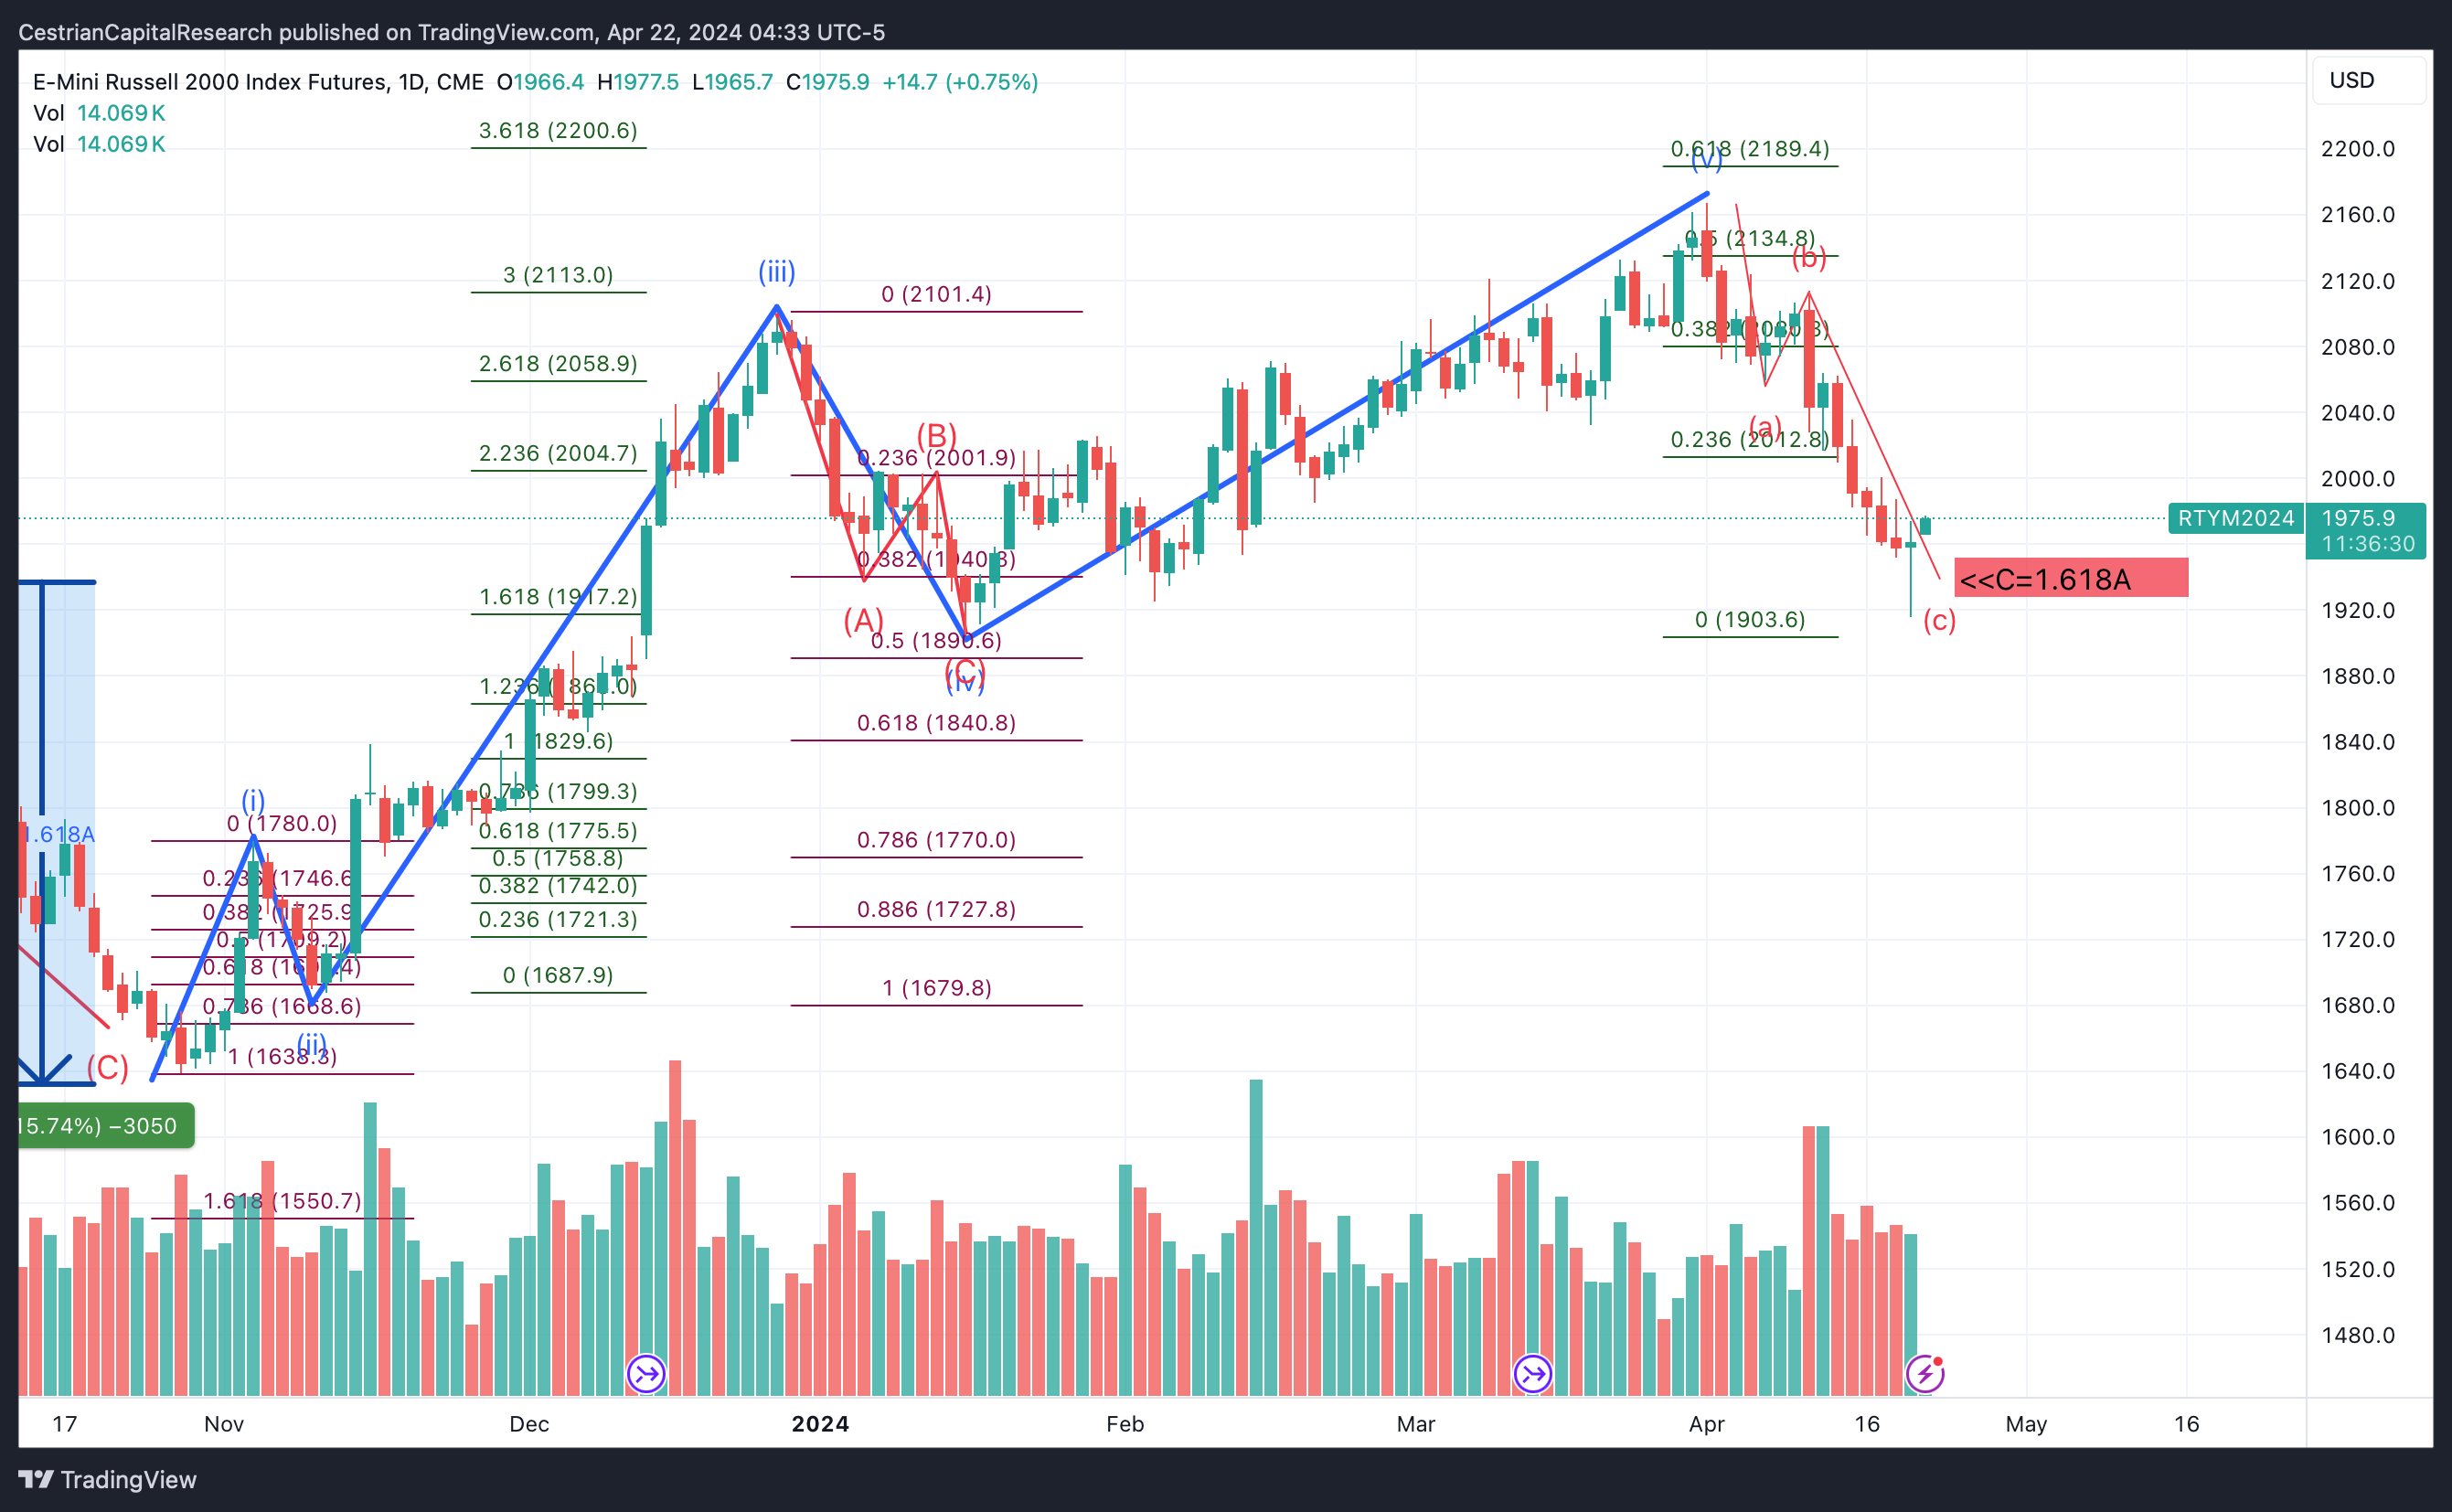
This has some work to do. Below $42, risk to the downside. Above $42 and $42 turned into support, looking to the upside. Now $33.
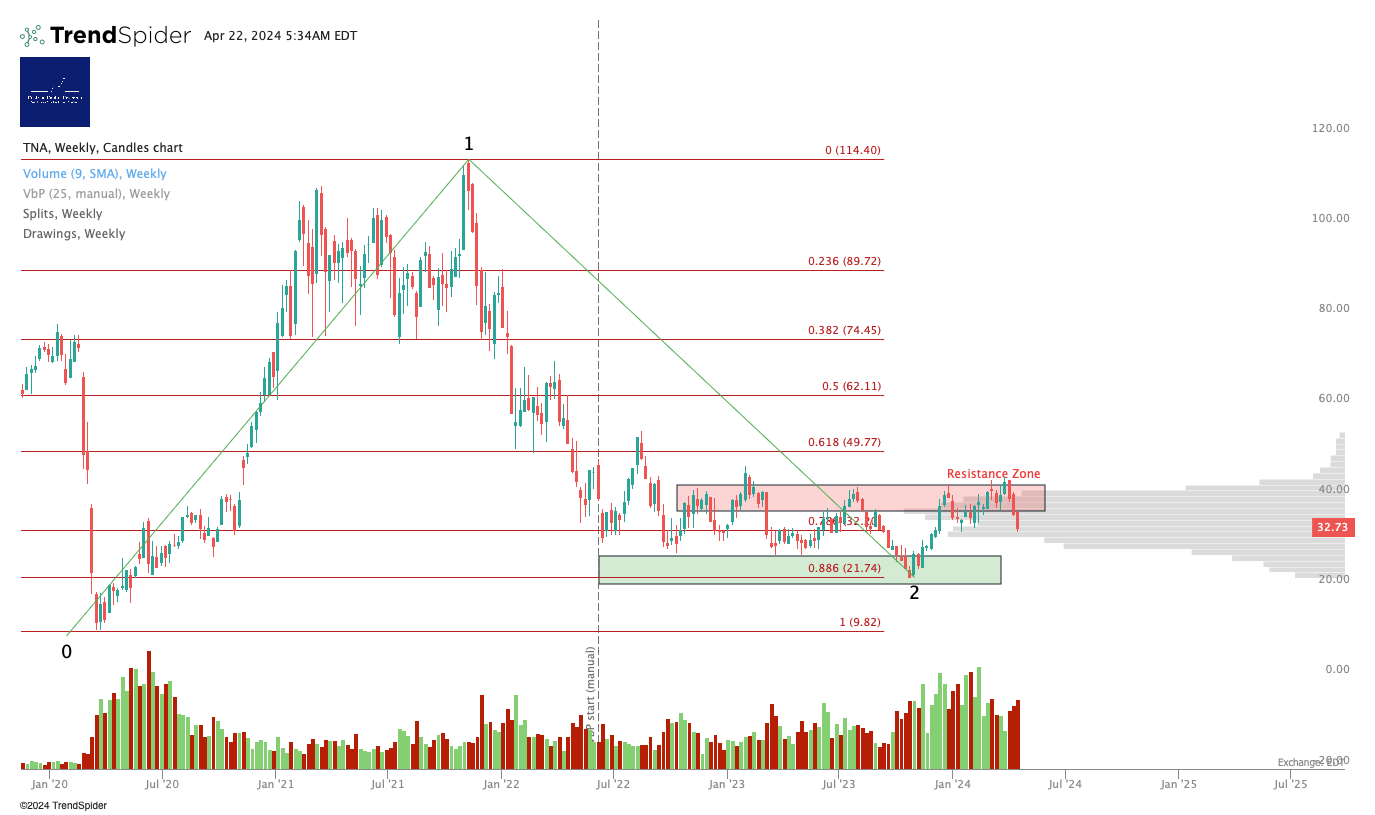
Personal Trading Plan Disclosure: I am unhedged long TNA.
3x Levered Long XLK (Tech) - TECL
Look for a b-wave bounce.
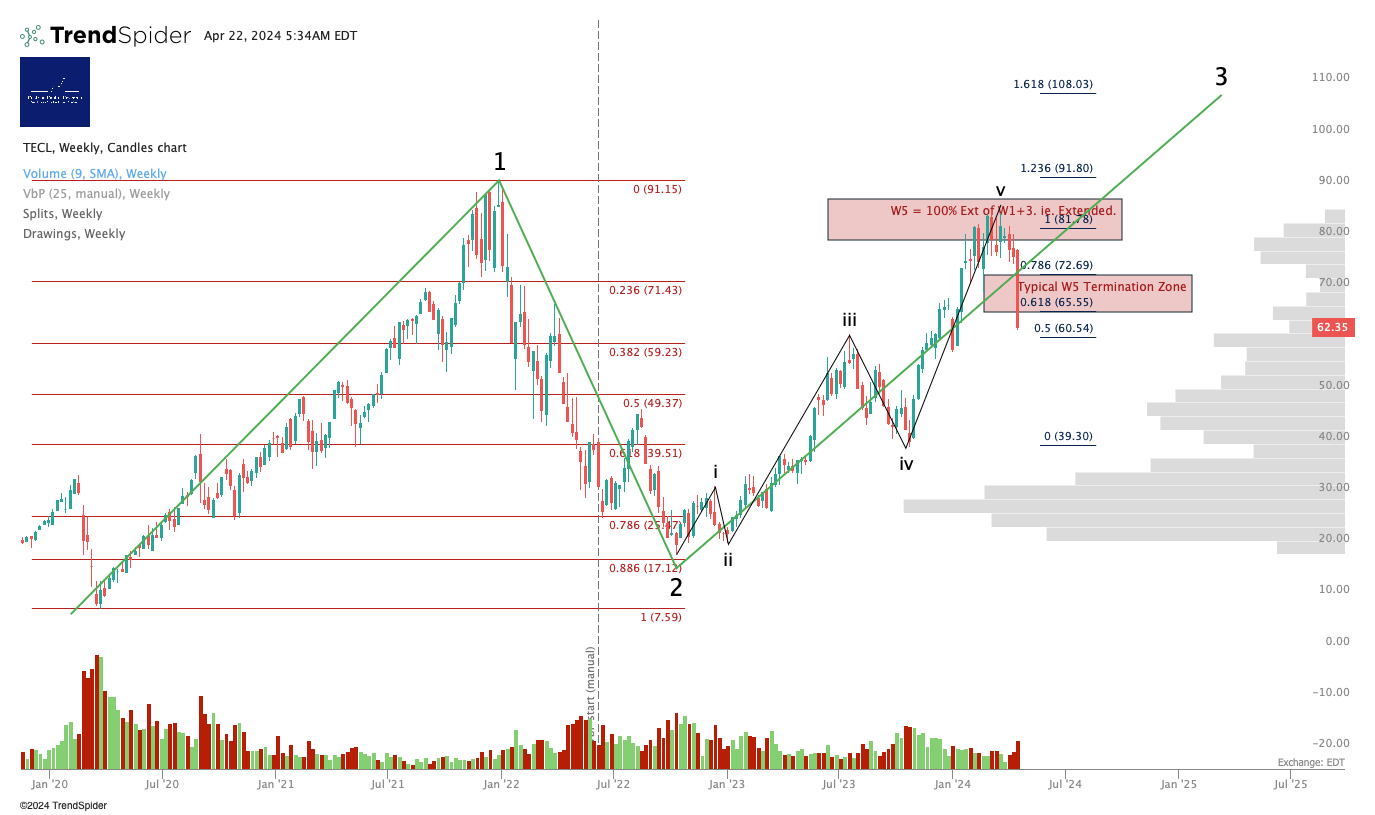
Personal Trading Plan Disclosure: No position in TECL or TECS.
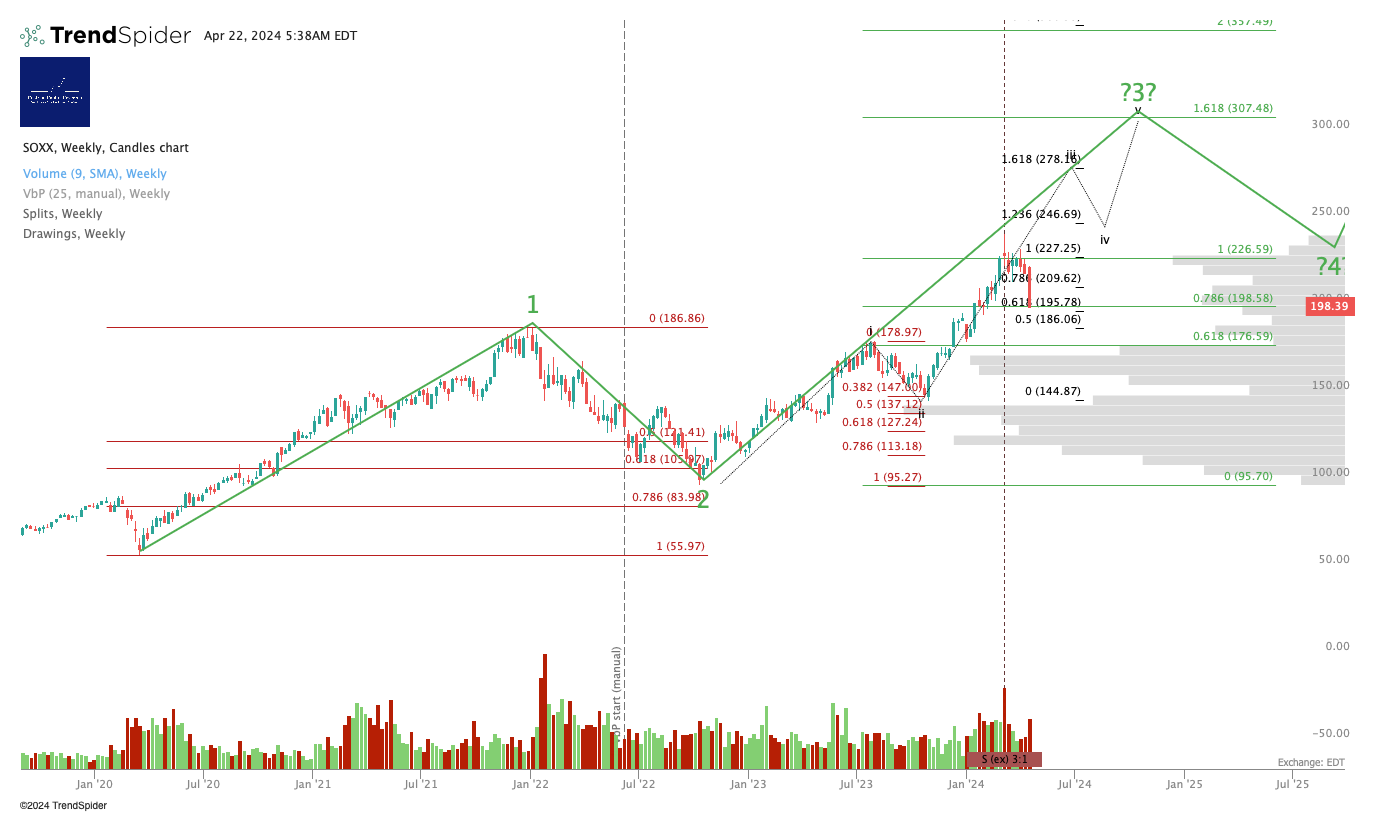
SOXX (Semiconductor Sector ETF)
May take awhile to recover but I remain long-term bullish on this one.
3x Levered Long SOXX (Semiconductor) - SOXL
Thursday I said, SOXL broke. Friday, it broke some more! Has to hold $28.
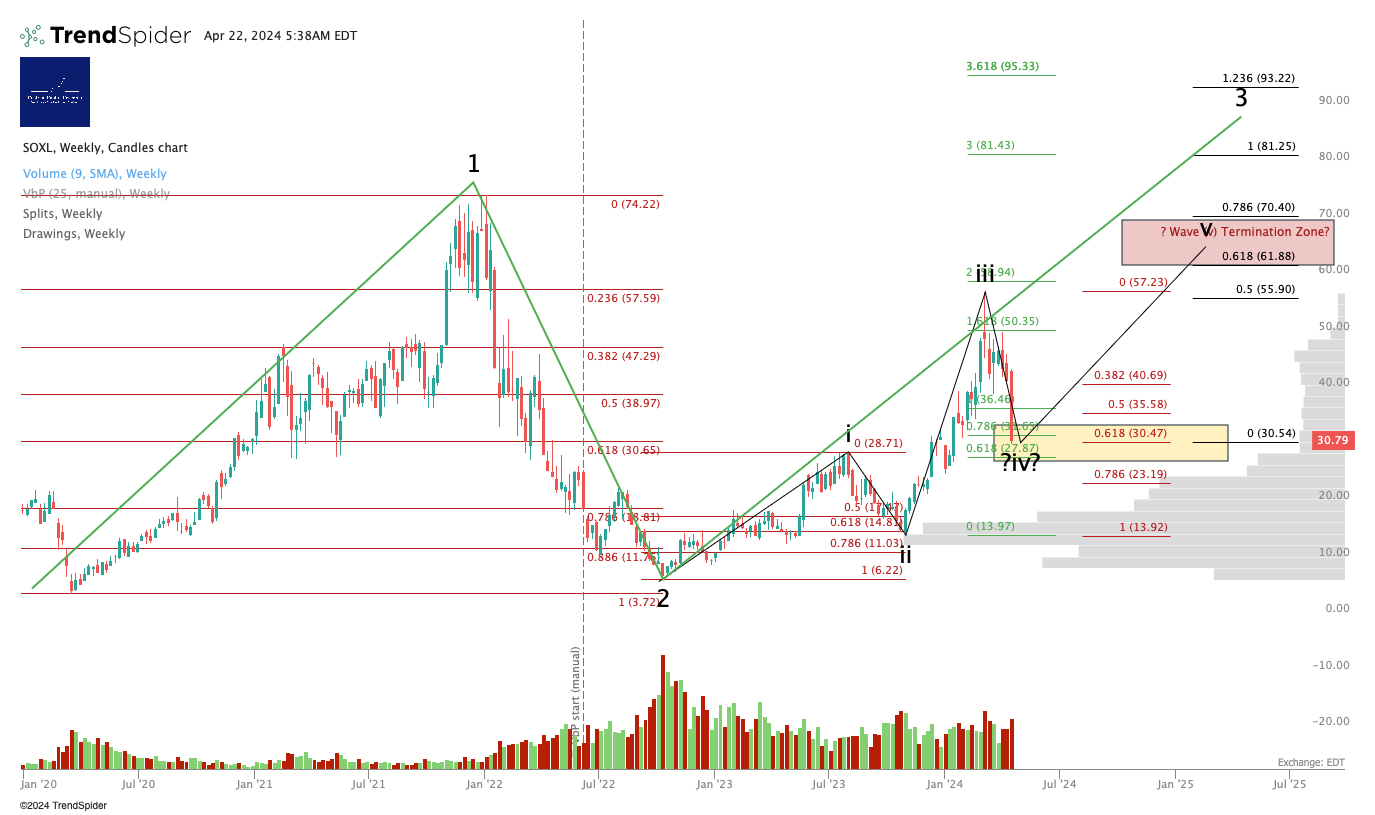
Personal Trading Plan Disclosure: I am unhedged long SOXL.
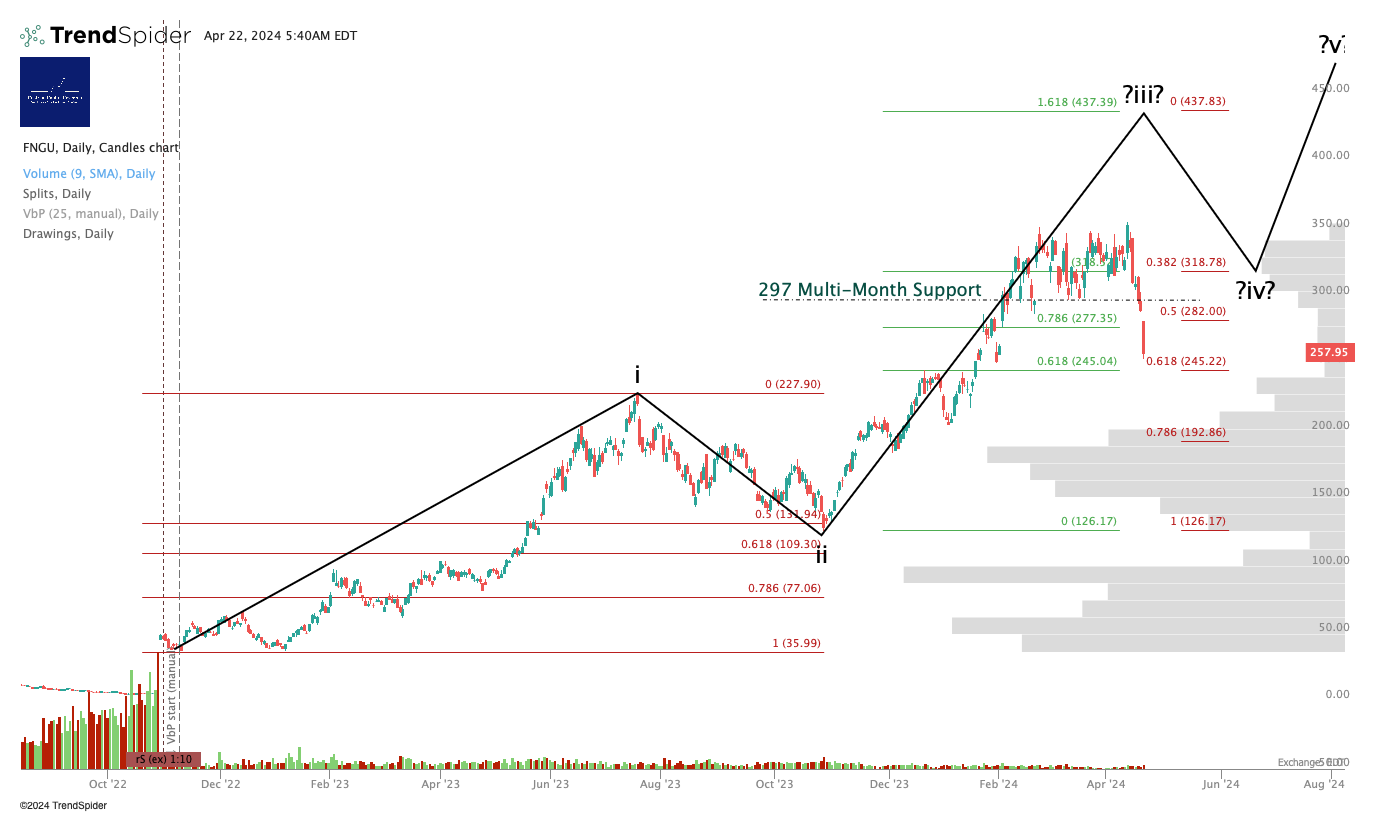
3x Levered Long Megacaps - FNGU
Broke the $297 key level I flagged Thursday. I think it will hold $240 - first high volume node is there.
Personal Trading Plan Disclosure: No position in FNGU or FNGD.
Alex King, Cestrian Capital Research, Inc - 22 April 2024. DISCLOSURE - Cestrian Capital Research, Inc staff personal accounts hold long positions in, inter alia, TQQQ, UPRO, SOXL, TNA, TMF, UDOW, UCO, SVXY plus 3USL and QQQ3 (EU UCITS equivalent to UPRO and TQQQ respectively).