
Market On Open - Tuesday 16 April
DISCLAIMER: This note is intended for US recipients only and, in particular, is not directed at, nor intended to be relied upon by any UK recipients. Any information or analysis in this note is not an offer to sell or the solicitation of an offer to buy any securities. Nothing in this note is intended to be investment advice and nor should it be relied upon to make investment decisions. Cestrian Capital Research, Inc., its employees, agents or affiliates, including the author of this note, or related persons, may have a position in any stocks, security, or financial instrument referenced in this note. Any opinions, analyses, or probabilities expressed in this note are those of the author as of the note's date of publication and are subject to change without notice. Companies referenced in this note or their employees or affiliates may be customers of Cestrian Capital Research, Inc. Cestrian Capital Research, Inc. values both its independence and transparency and does not believe that this presents a material potential conflict of interest or impacts the content of its research or publications.
Now What?
by Alex King
Here’s what our Market On Open note said yesterday when faced with a flat to up-looking market!
"The rider for all this is (1) events may take a turn for the worse and (2) the close today will be a lot more important than the open as far as price discovery goes."
As you know our moniker is, don’t bother watching the news, stocks run ahead of the news not vice versa. Well, not yesterday it seems. Price action was constructive across most names in the morning; volatility dropped; all starting to look up. That all changed when the news broke that Israel was intending to respond forcefully to the weekend strike by Iran. For now, all quiet as regards what that counter will look like, and markets are also treading water.
Now, the timing of this is confused and mushed up by the fact that yesterday was also tax day ie the day when a lot of folks are selling securities to replenish funds paid over to the IRS and state tax authorities. It’s always easy to see headlines as driving prices when in fact money flows are usually more powerful.
This is why, in the end, technical analysis is the superior form of stock analysis, rather than trying to predict how stocks will react to events on the news or actually happening live on TV. If Israel responds with aggression, will stocks rise because the tension is then over? Or drop because of escalation? Or rise because of new inflows from dip-buyers? Who can say in advance? Pattern recognition - which is all technical analysis really is - remains our preferred method.
So with that in mind we refresh all our charts below - equities, oil, bonds.
As always, this is for our paid tiers here. If you’ve yet to sign up? You can do so from the links below. Choose “Market Insight” if you want our investment notes only; choose “Inner Circle” if you want investment notes, real-time trade alerts, live weekly webinars and recorded videos, and of course a live 24x7 investor community chat service. Monthly and annual subscriptions available - right here.
Short- And Medium-Term Market Analysis
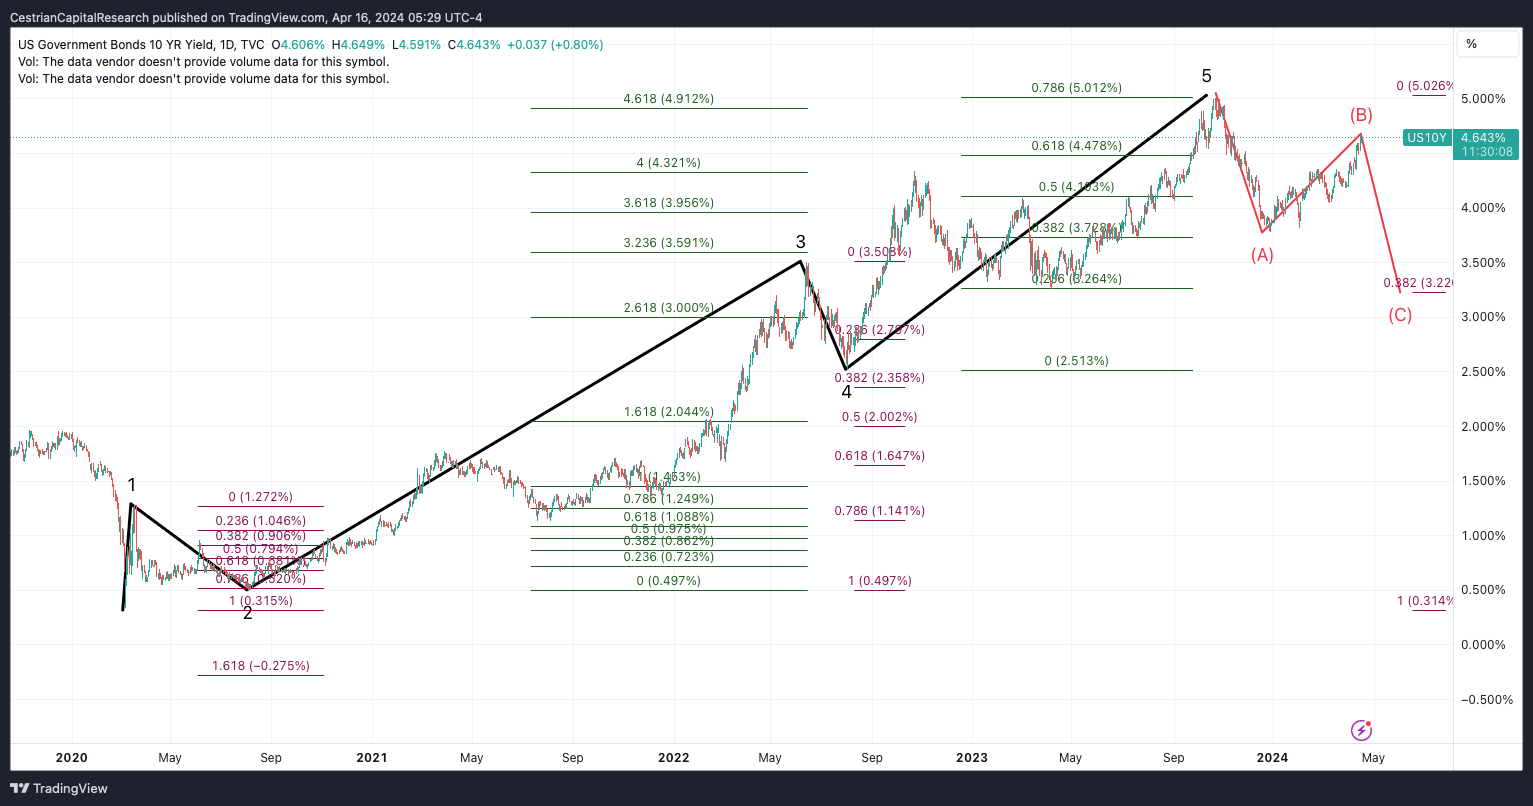
US 10-Year Yield
The yield is still climbing this morning, which isn’t a good look for equities in the short term in my view.
Set against that, volatility, at least as measured by the Vix, is dropping.
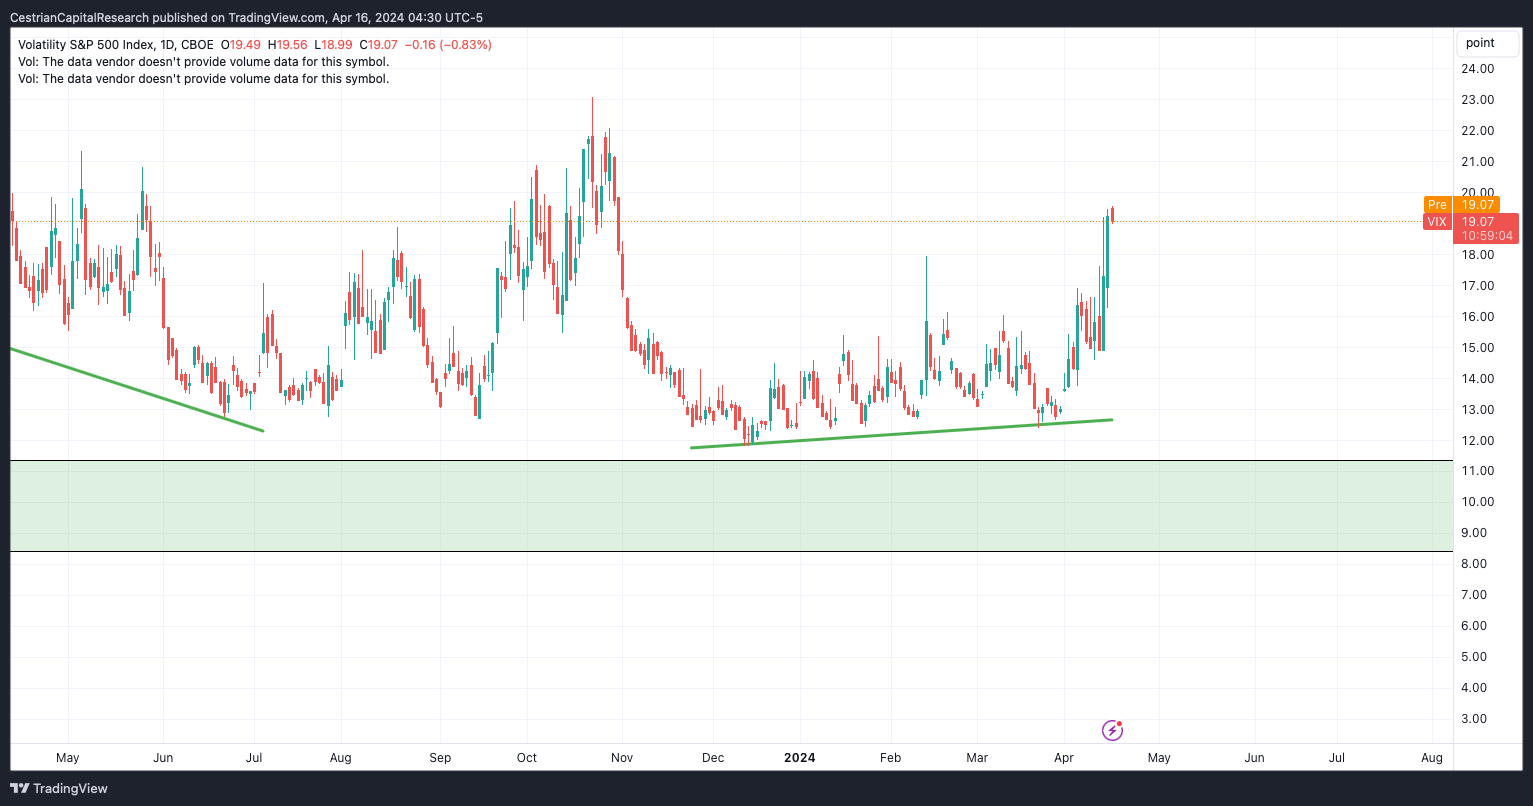
Personal Trading Plan Disclosure: I am unhedged long $SVXY (small position only).
Longer-Term Treasury Bonds (TLT / TMF)
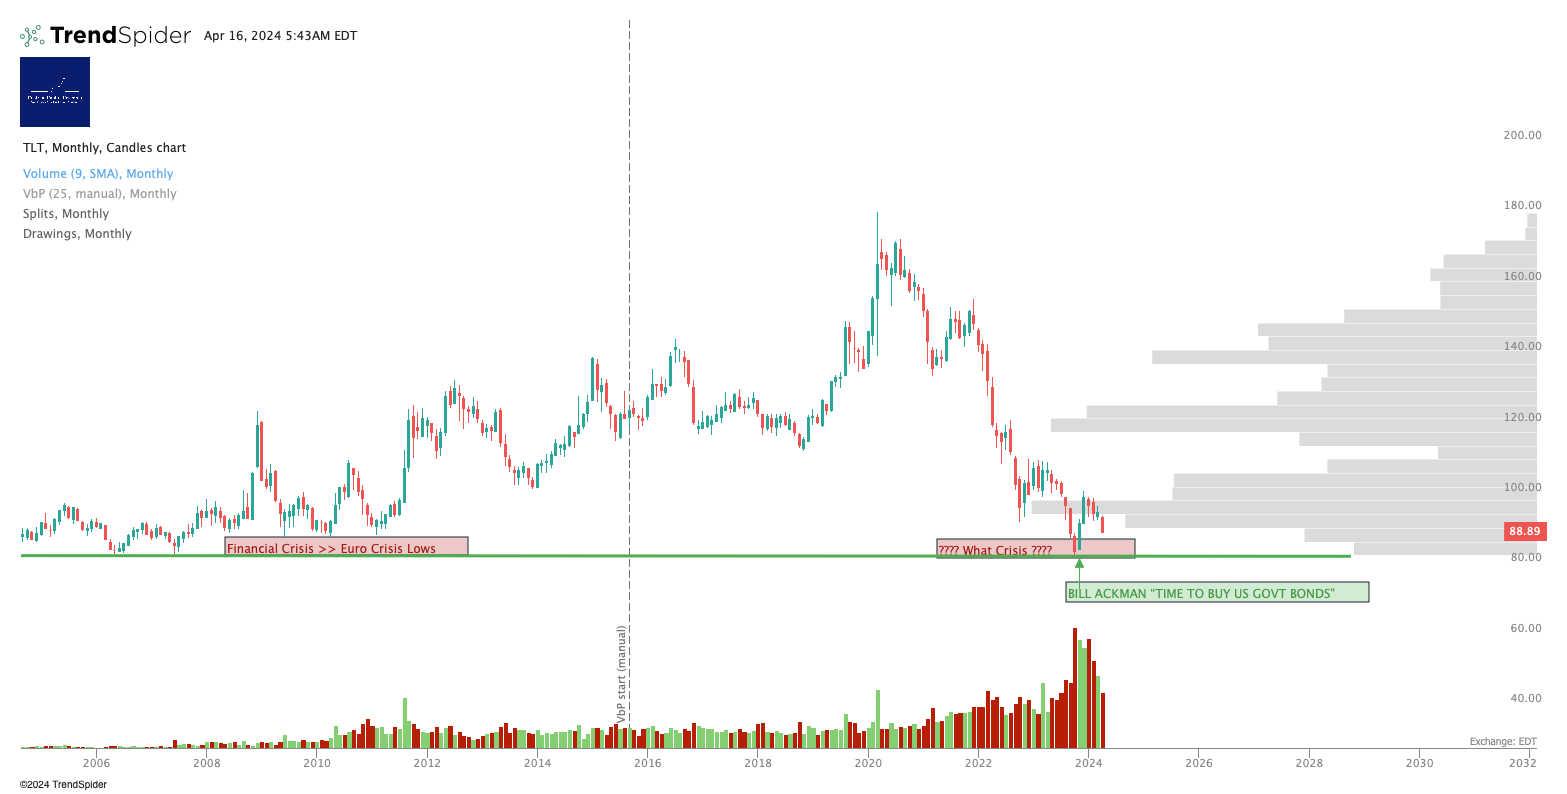
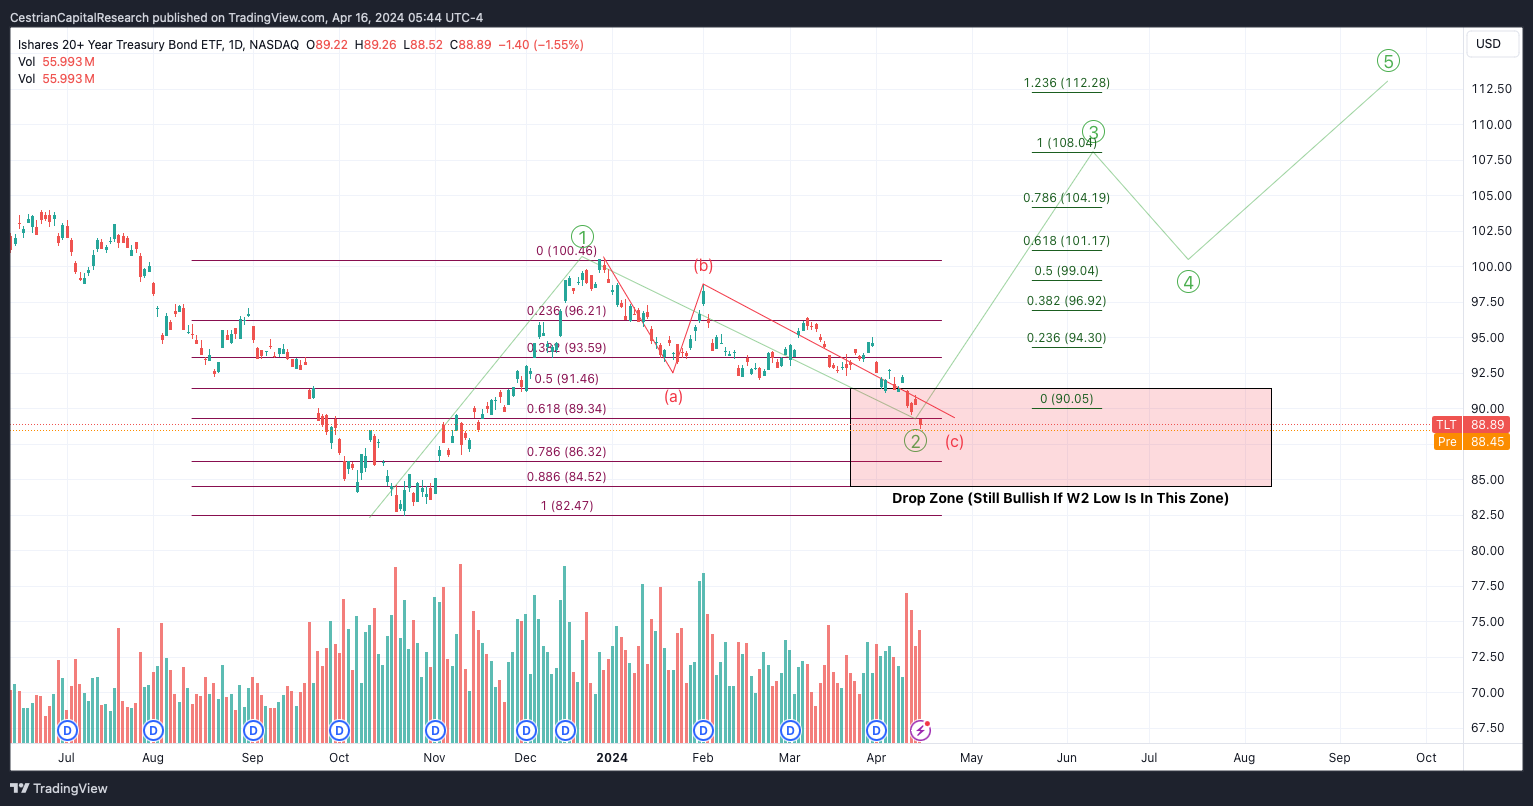
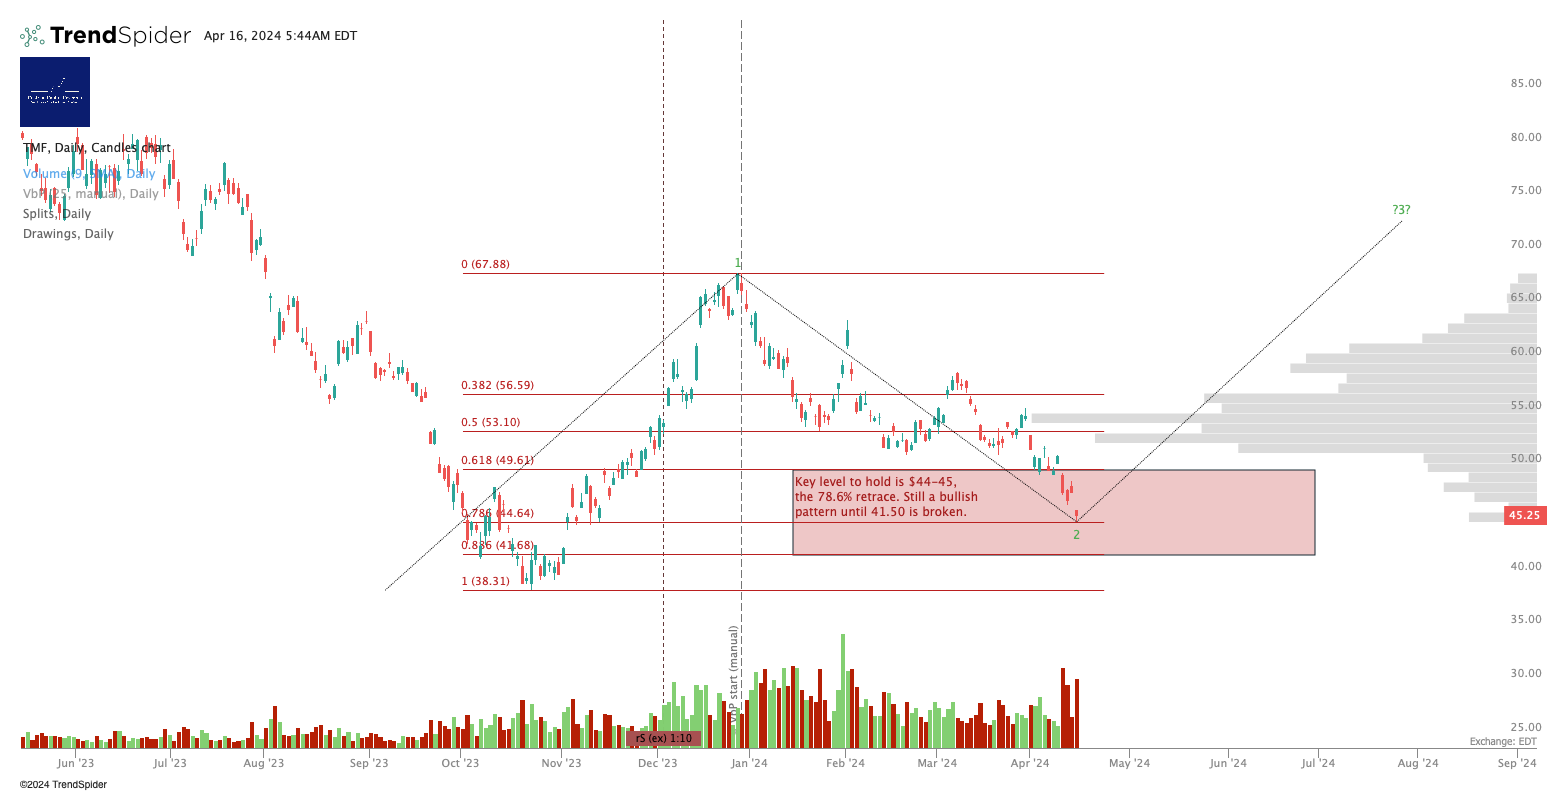
Personal Trading Plan Disclosure: I am unhedged long $TMF.
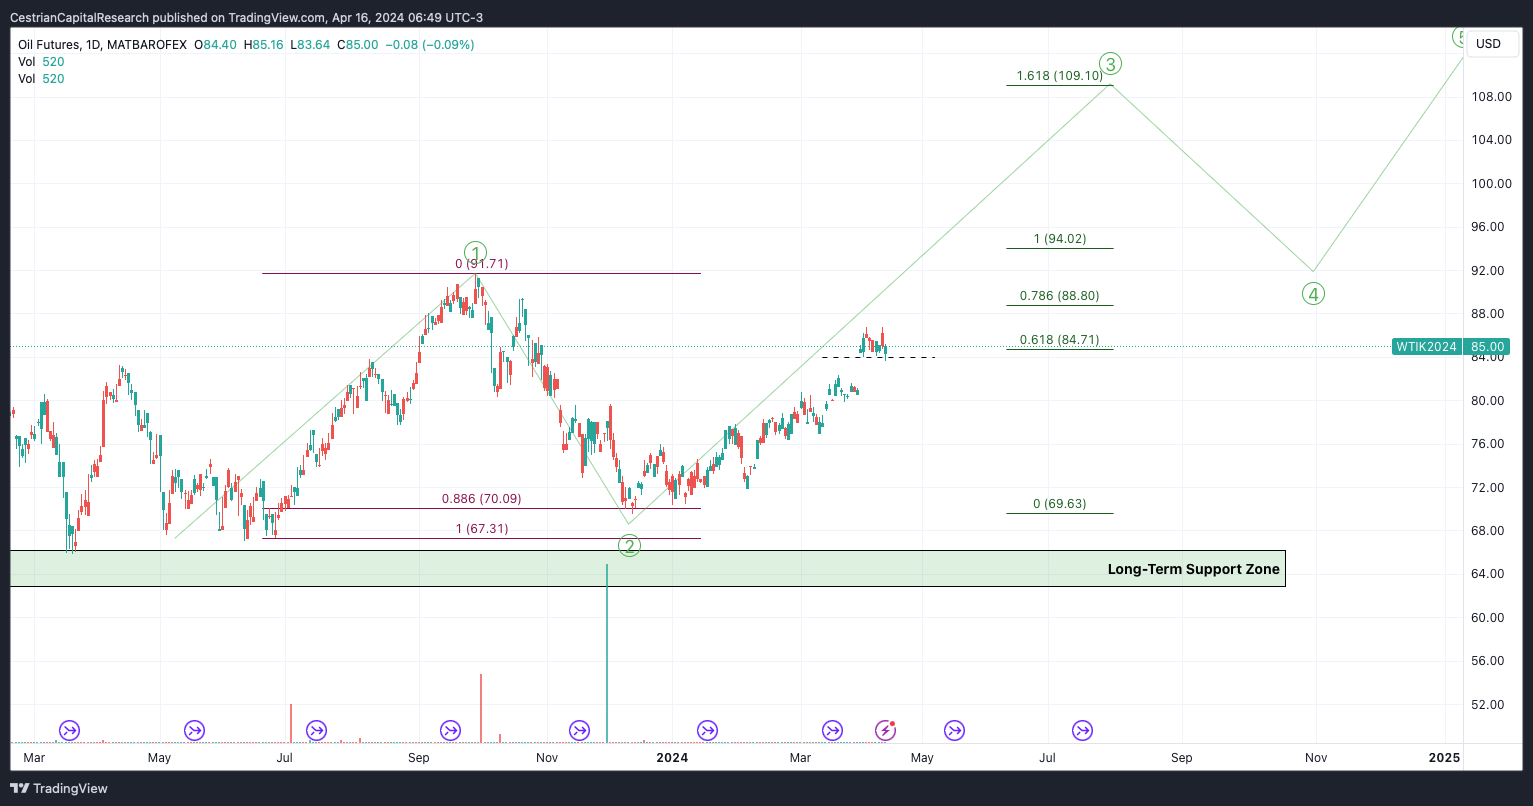
Oil (USO / WTI / UCO)
USO has yet to break up above that prior W1 high at $83.55. So, below $83, bearish; above and turning $84 into support, bullish. Note oil recovered yesterday afternoon following a drop in the morning; still didn’t break that high though.
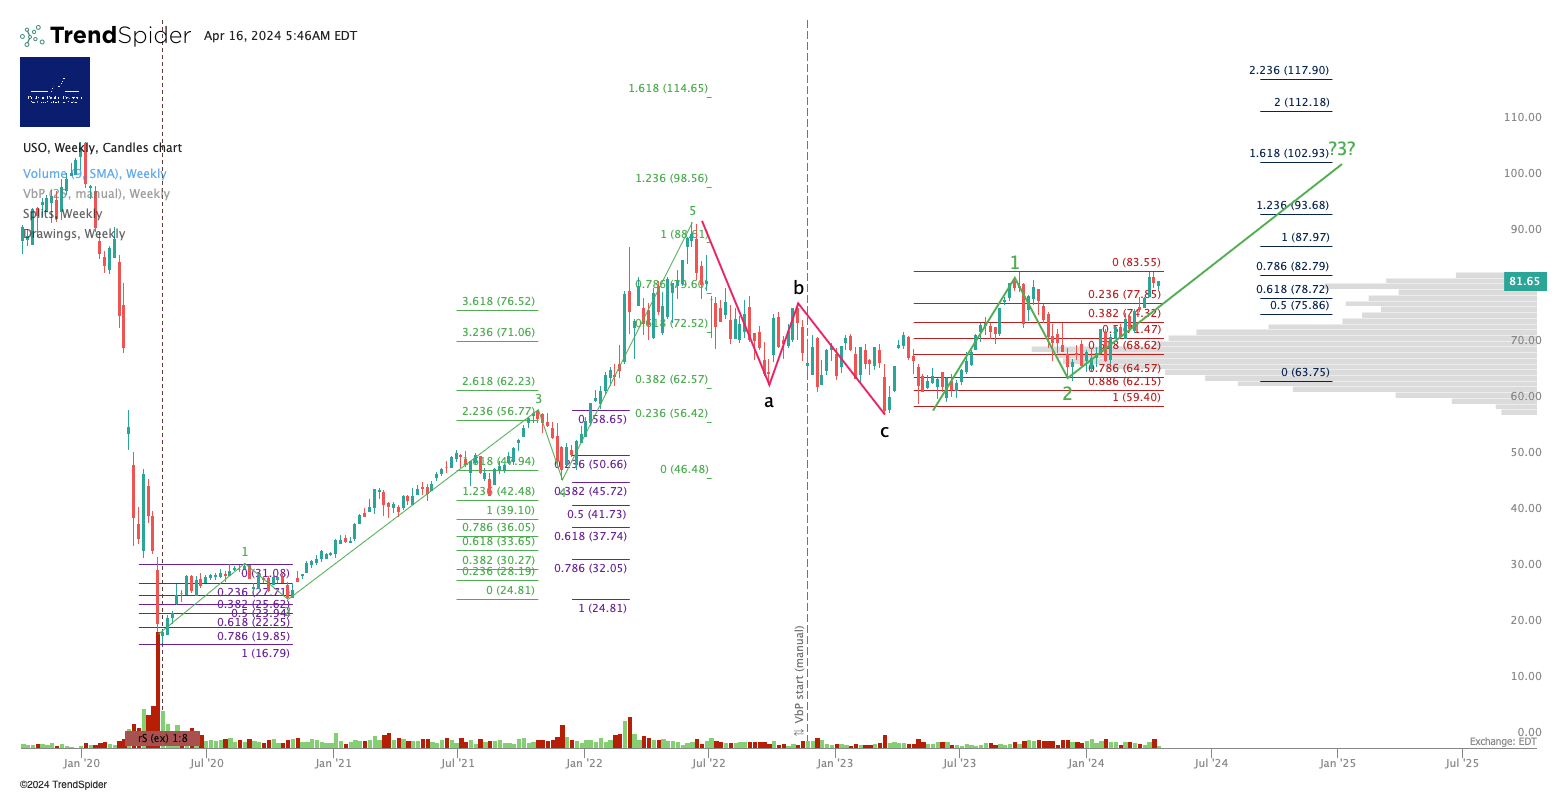
Local double top just over $86 remains resistance for now.
Below $37, bearish; above, bullish. Currently $35.
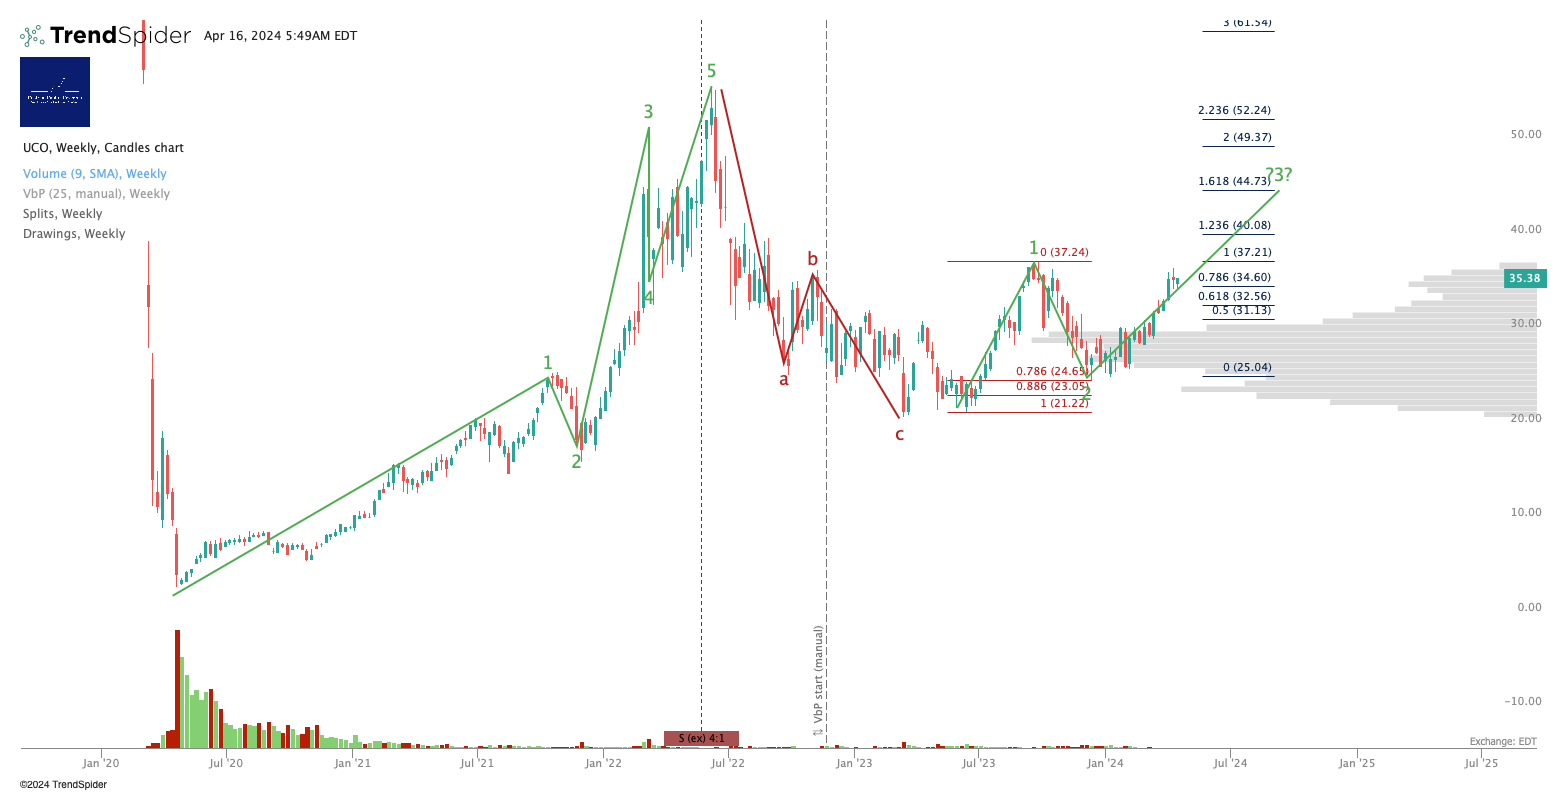
Personal Trading Plan Disclosure: I am unhedged long $UCO
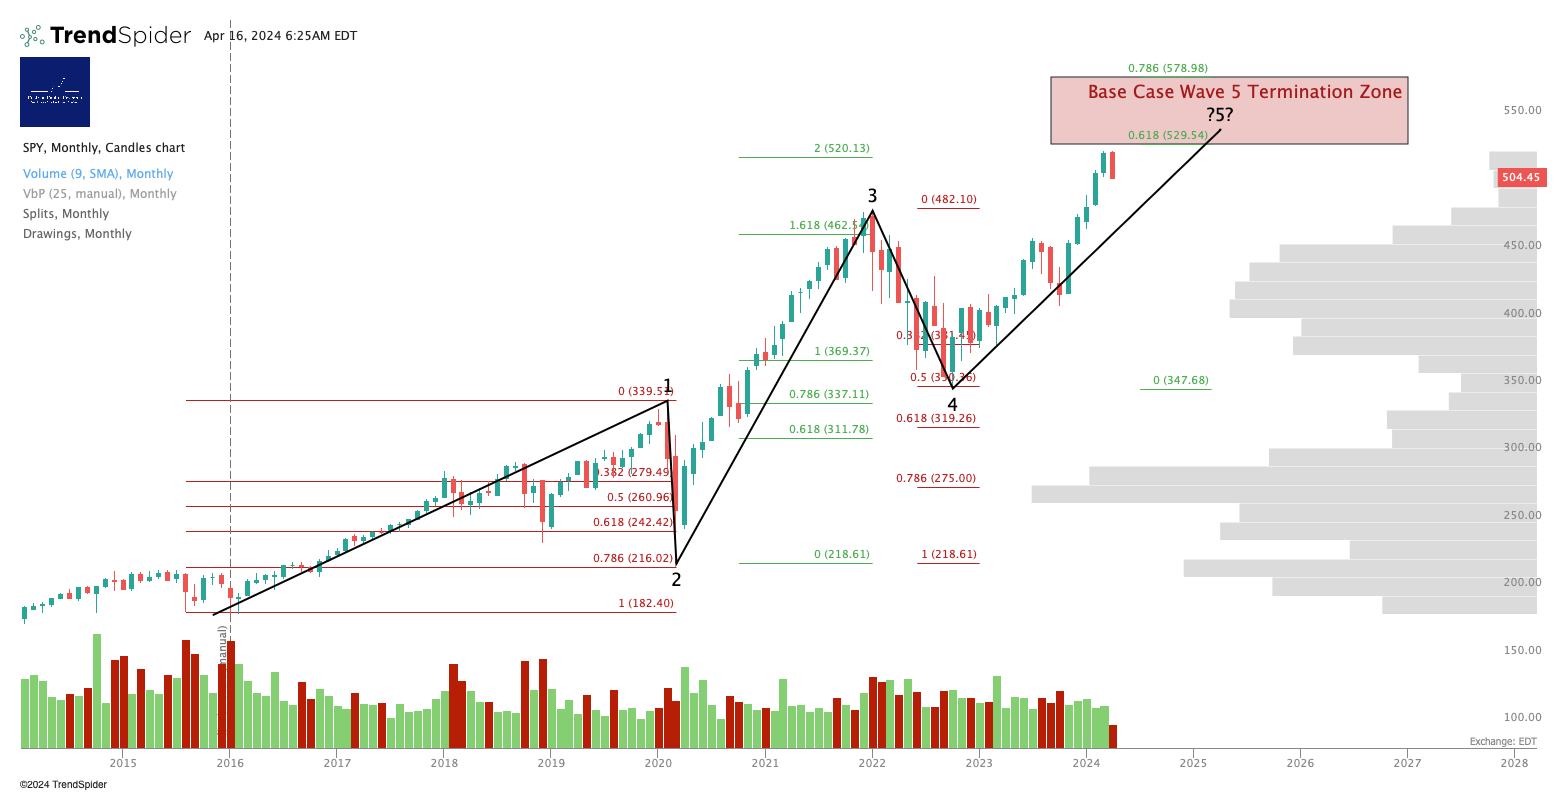
S&P500 / SPY / ES / UPRO
No change to this case. Perhaps it proves correct after all, contrary to my more bullish protestations!
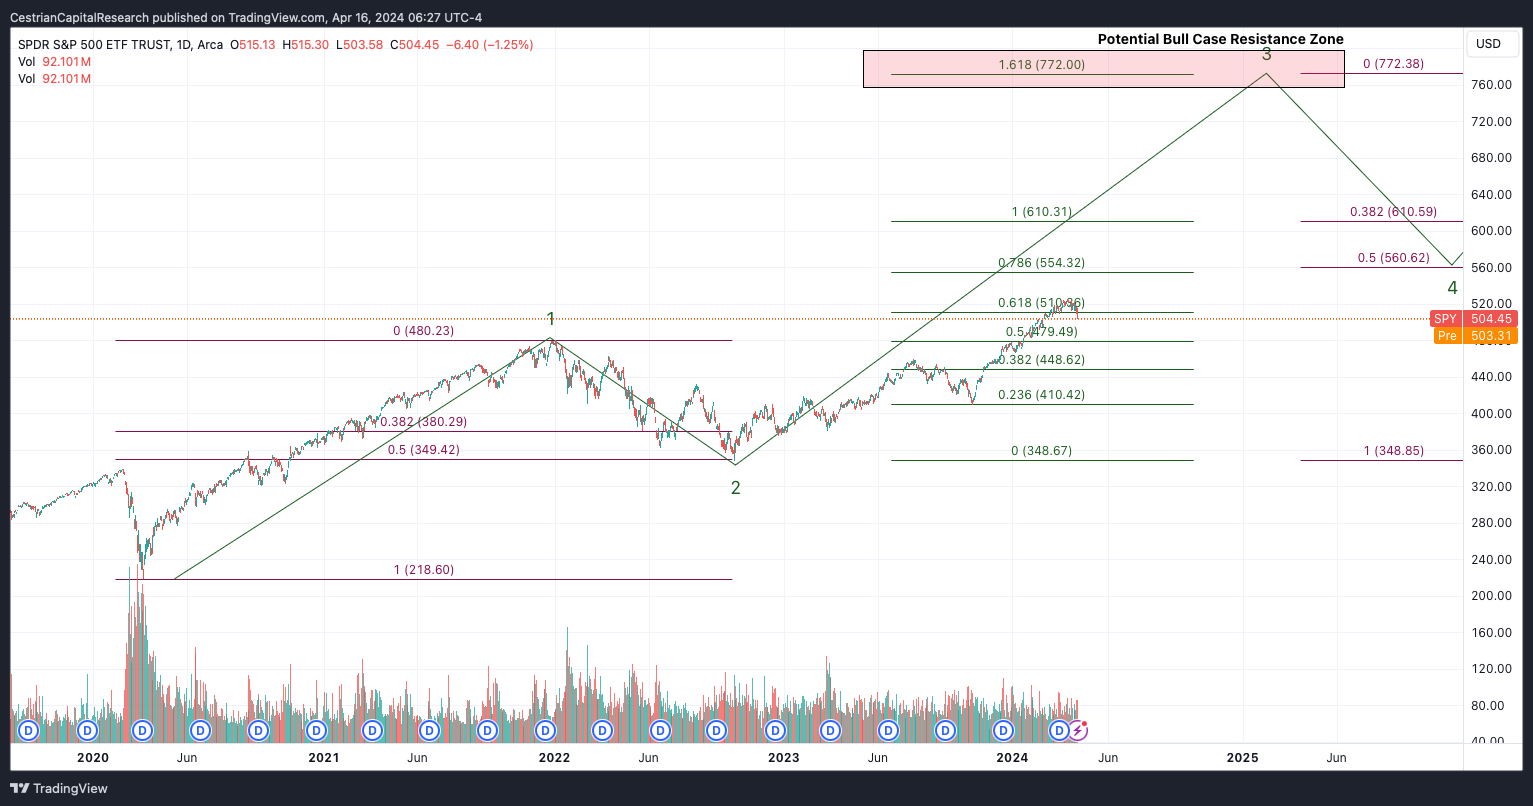
Absent a major escalation of conflict, this continues to look the more likely outcome to me. If true it suggests the min. target in Wave 3 for SPY would be $610, the 1.0 extension of the prior Wave 1.
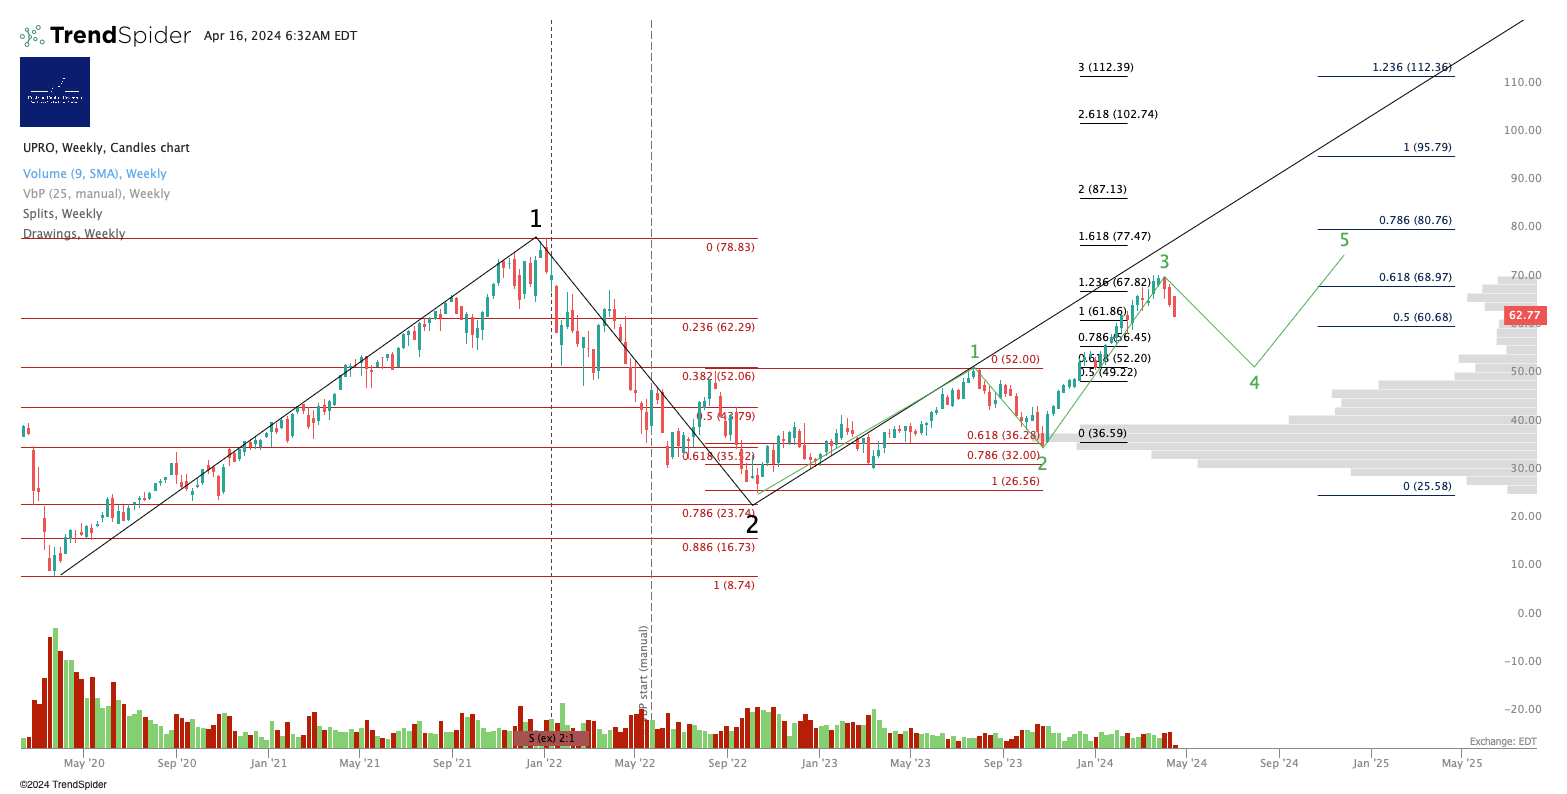
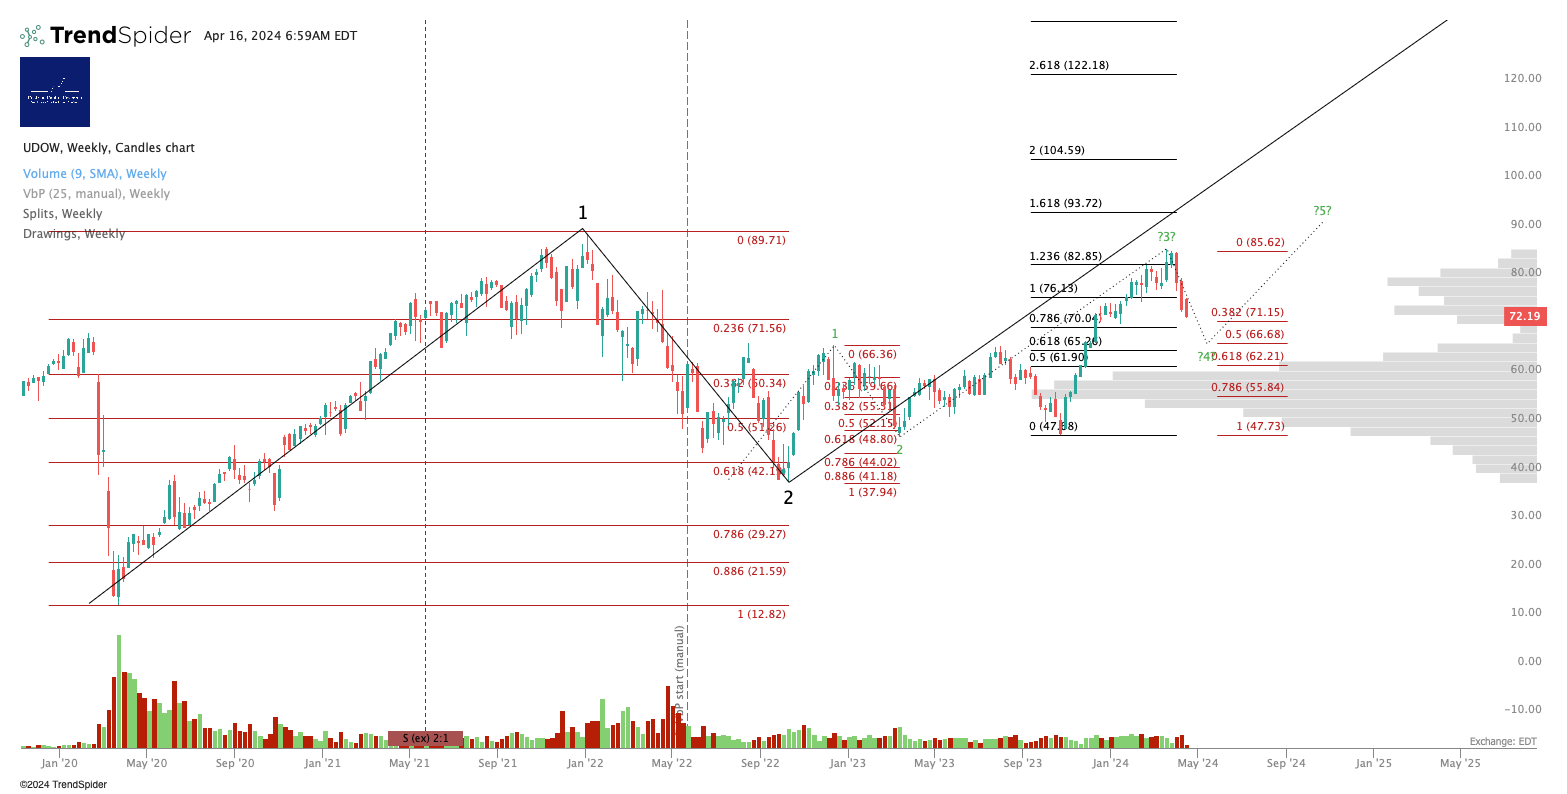
Downside to $52 and upside to $76. Currently $62.
Personal Trading Plan Disclosure: I am hedged 4:1 long:short the S&P via $UPRO and $SPXU in short term accounts, and unhedged long the S&P via $3USL (an EU UCITS equivalent to UPRO) in long term accounts. If there is further selling today I will consider adding short hedges to those long term accounts too.
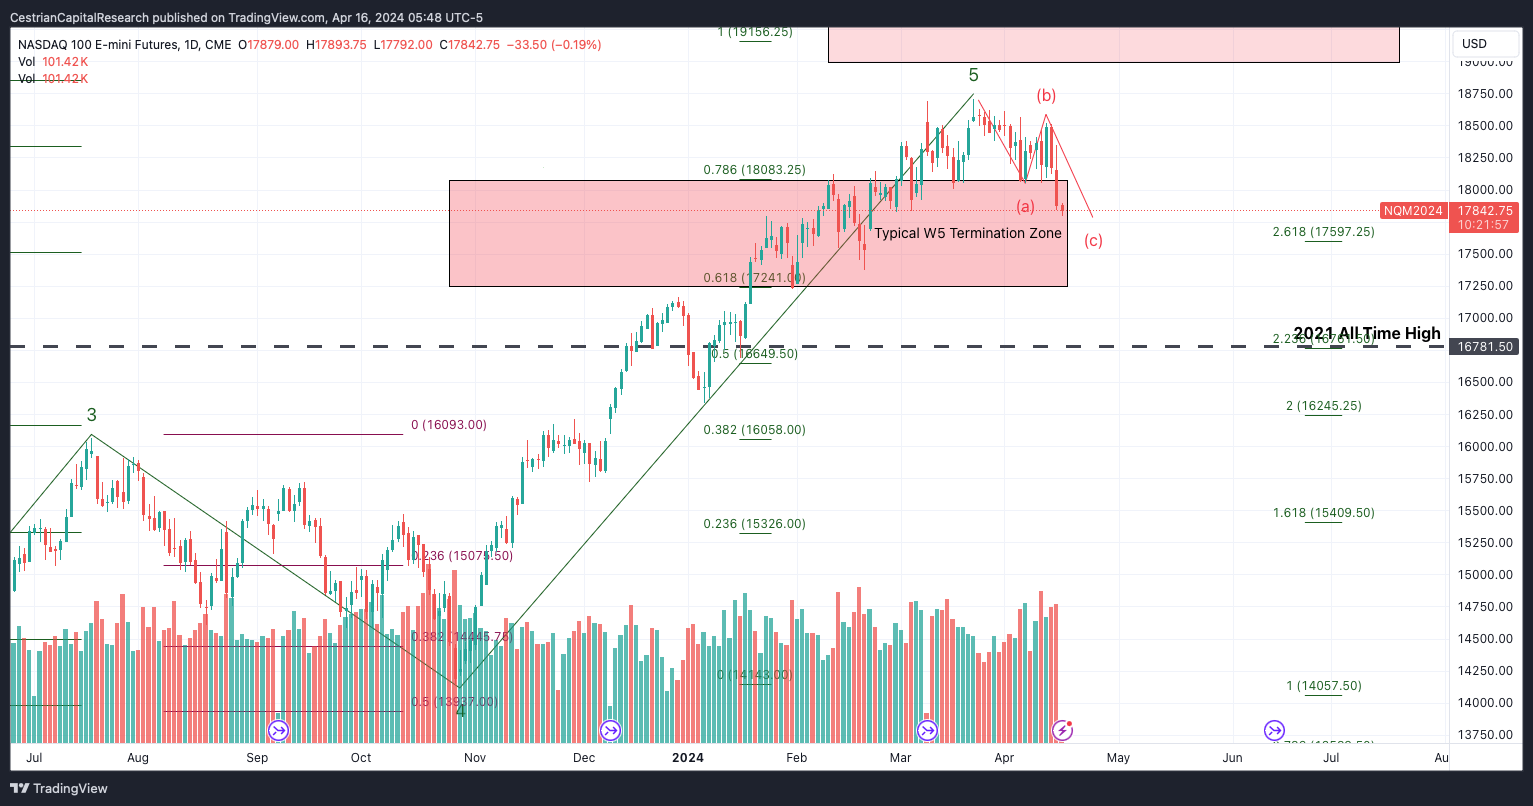
Nasdaq-100 / QQQ / NQ / TQQQ
Base vs Bull Case - Larger degree:
The Nasdaq has been going nowhere fast since 26 Feb and you could most certainly convince yourself that the QQQ chart looks like the Wave 5 top is in. Constituent stocks - MSFT, META, perhaps even AAPL - say otherwise. My own personal view is that the short term looks weak but I believe medium term remains strong.
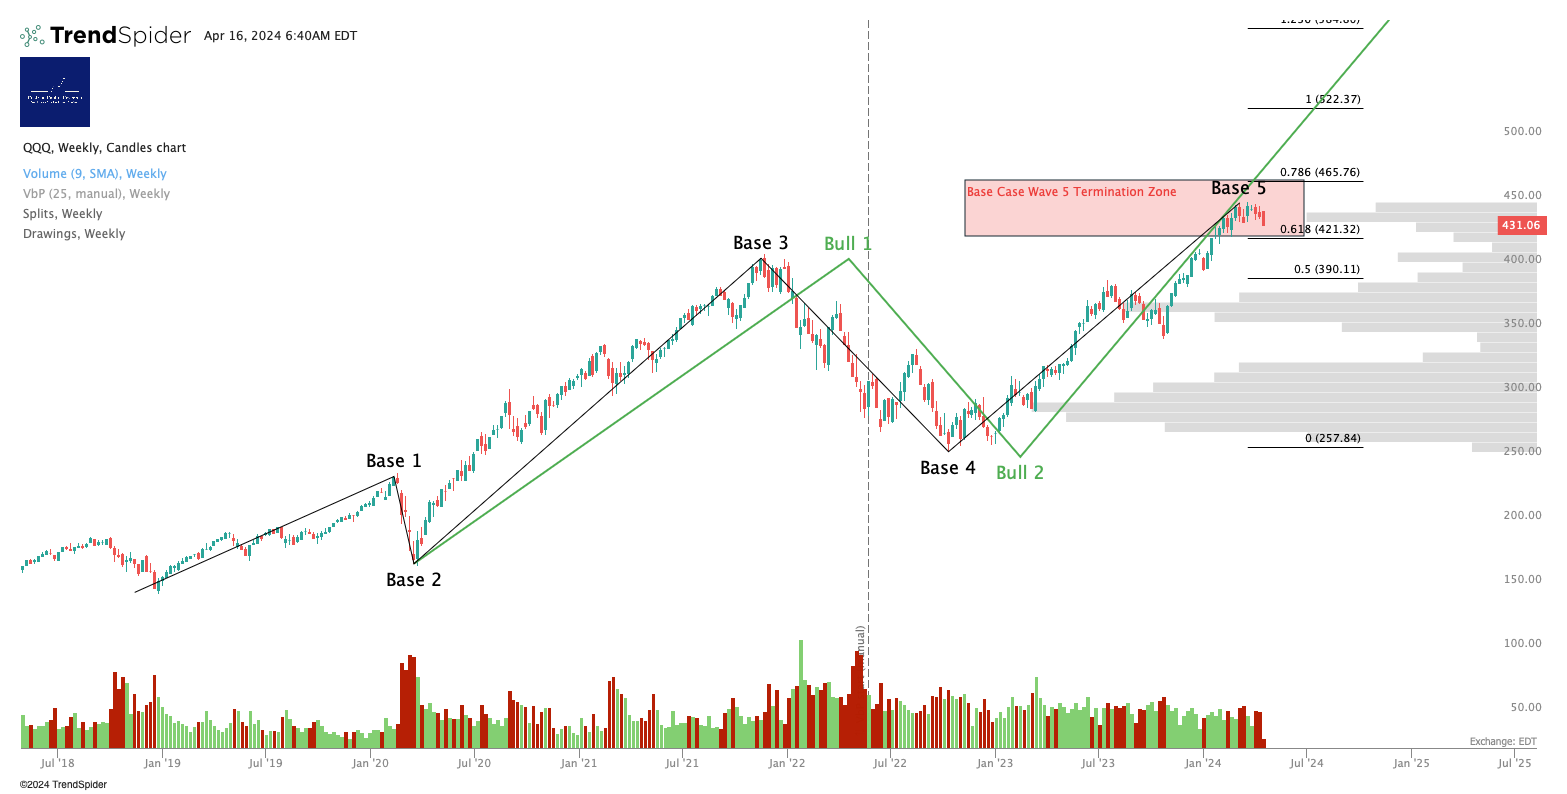
17840 has been a support level in recent weeks; let’s see if it holds. The 2021 ATH level around 16750 remains a natural target for bears in my view.
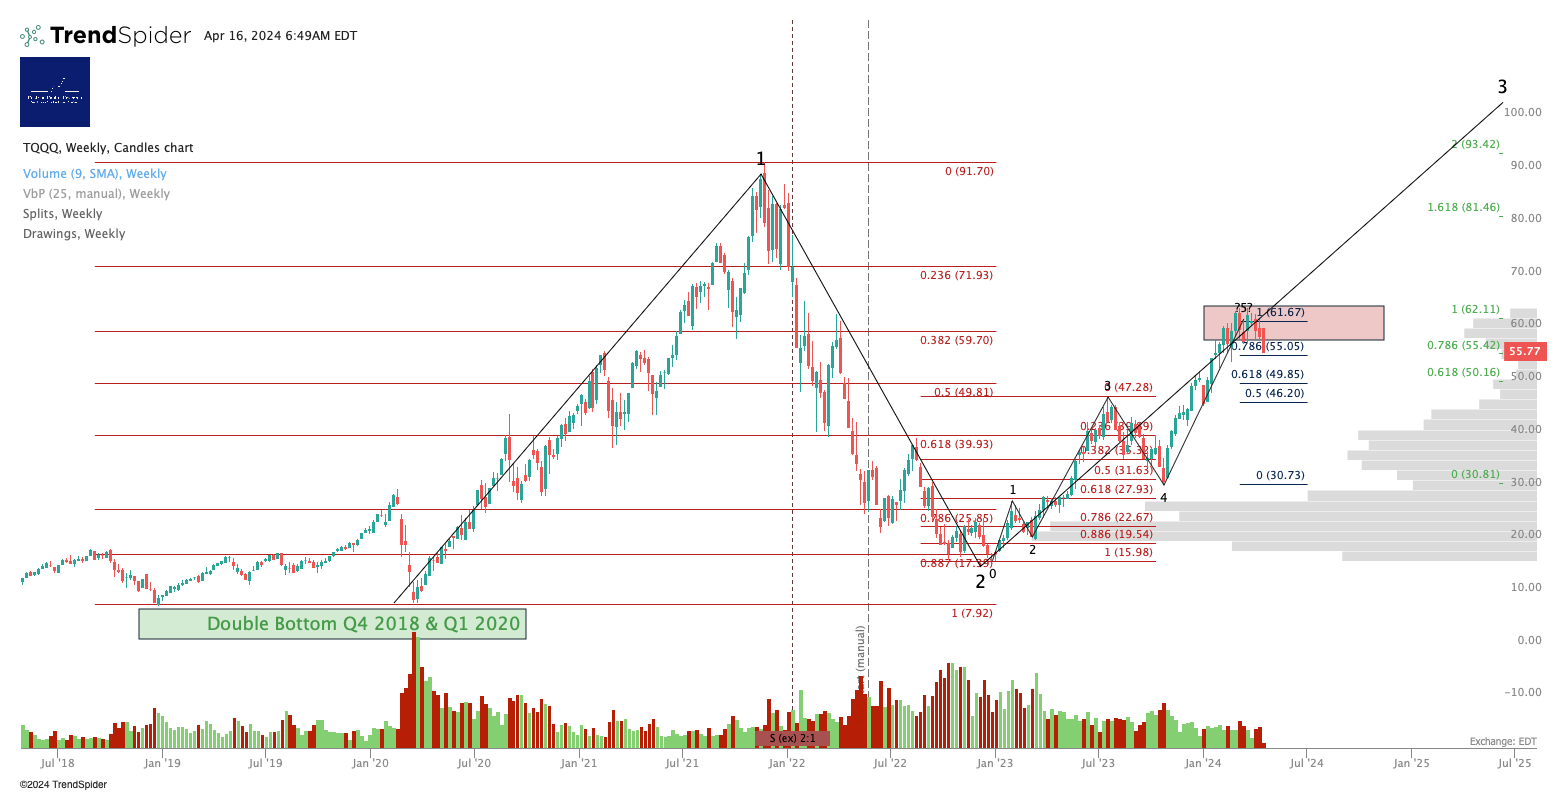
Personal Trading Plan Disclosure: I am hedged 4:1 long:short the Nasdaq-100 via TQQQ/SQQQ in short term accounts and unhedged long the Nasdaq in long term accounts using $QQQ3 (an EU UCITS equivalent to TQQQ). See commentary above re. S&P500 in long term accounts - same goes for the Nasdaq.
Dow Jones / DIA / YM / UDOW
Base vs. Bull Case - Larger Degree
The Dow is up in premarket; it’s alone in that regard. Certainly the Dow has lagged the main indices so perhaps this is the start of some rotation into what is perceived to be a ‘safer’ index (though its constituents today show a lot of overlap with the S&P500 and the Nasdaq-100).
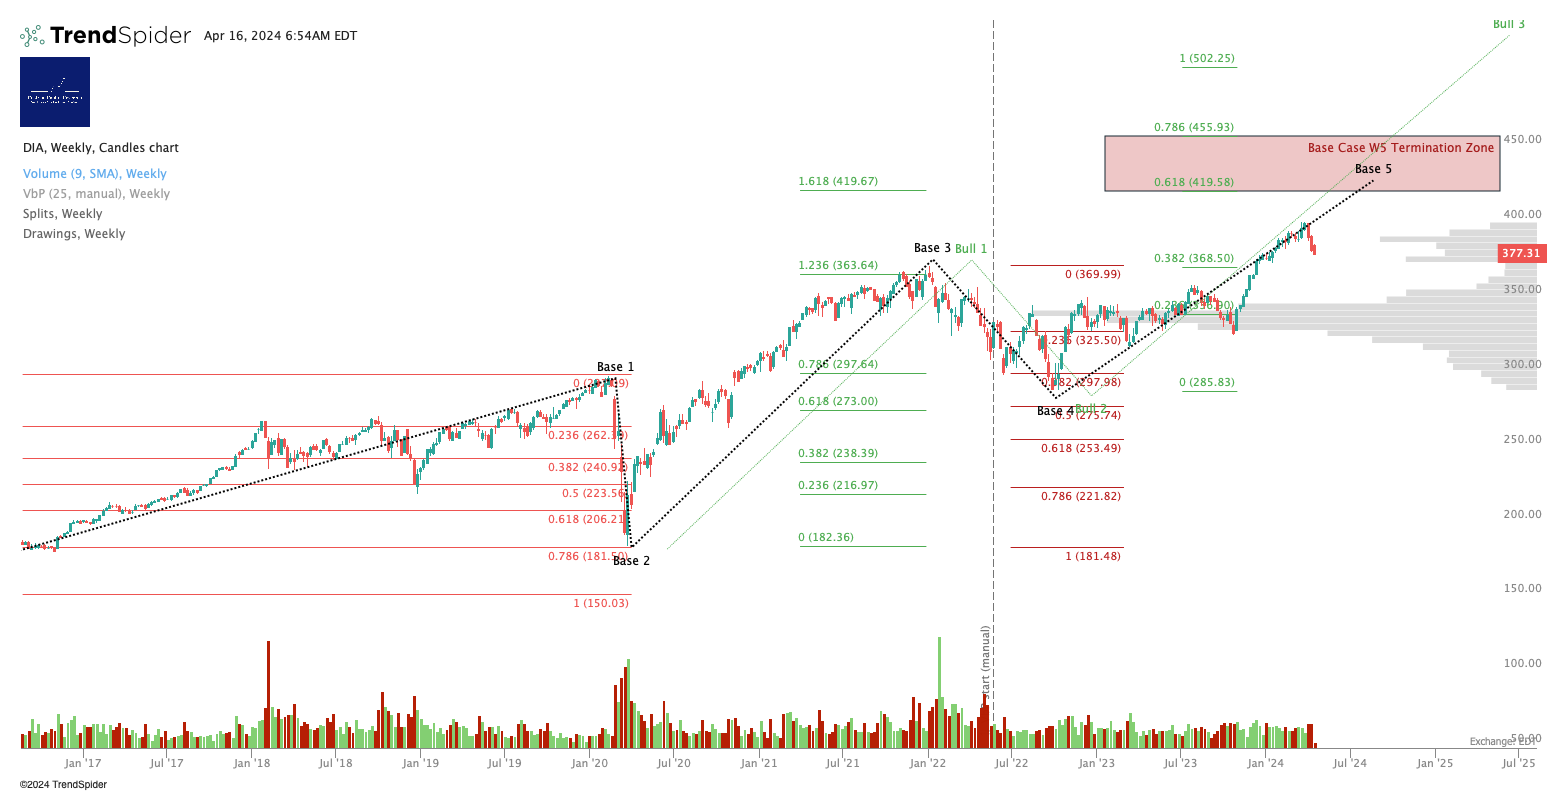
Holding support at the .786 for now.
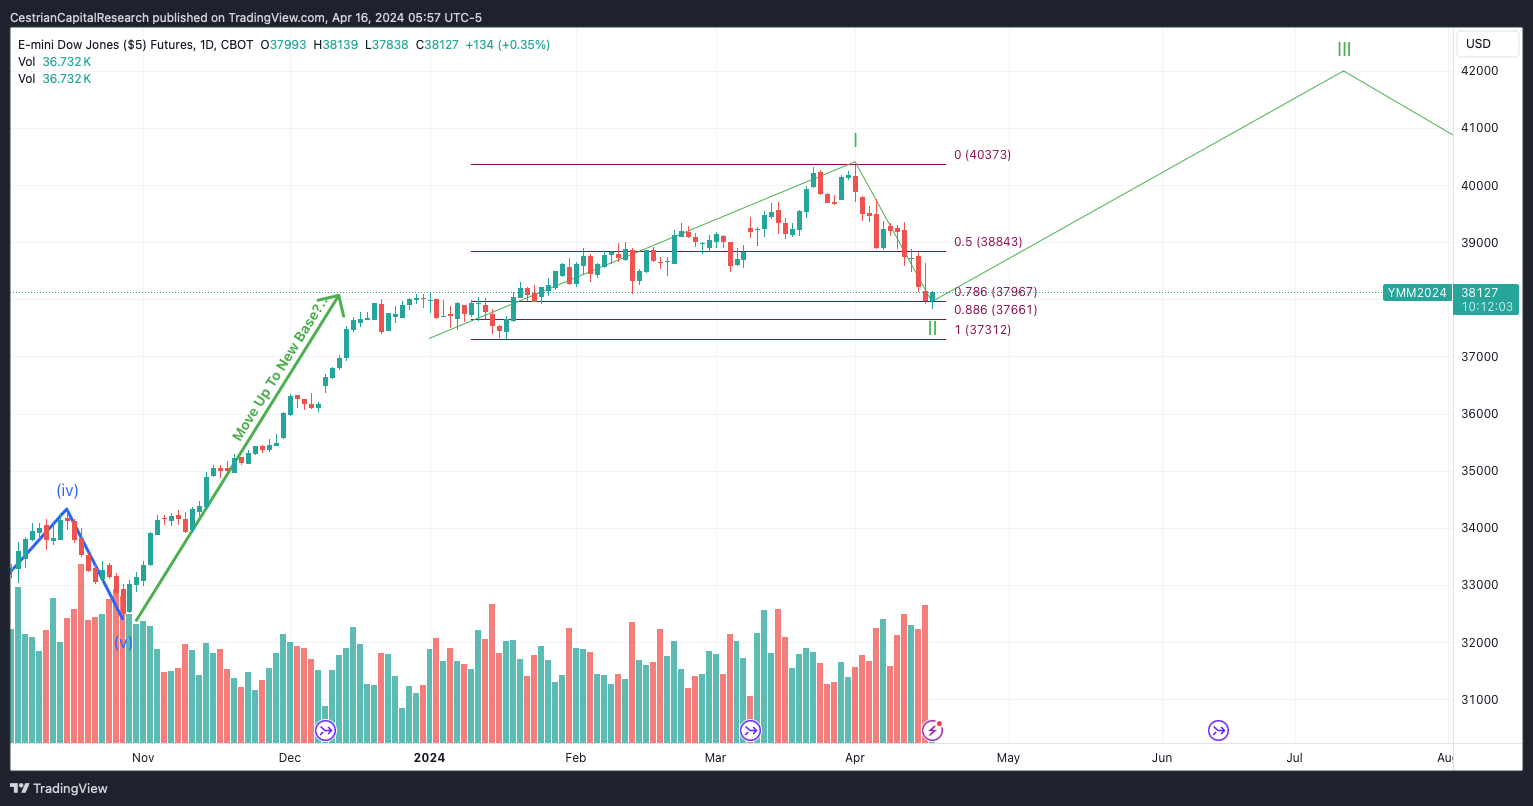
Local Wave 4 down is holding at the .382 for now.
Personal Trading Plan Disclosure: No position in UDOW or SDOW.
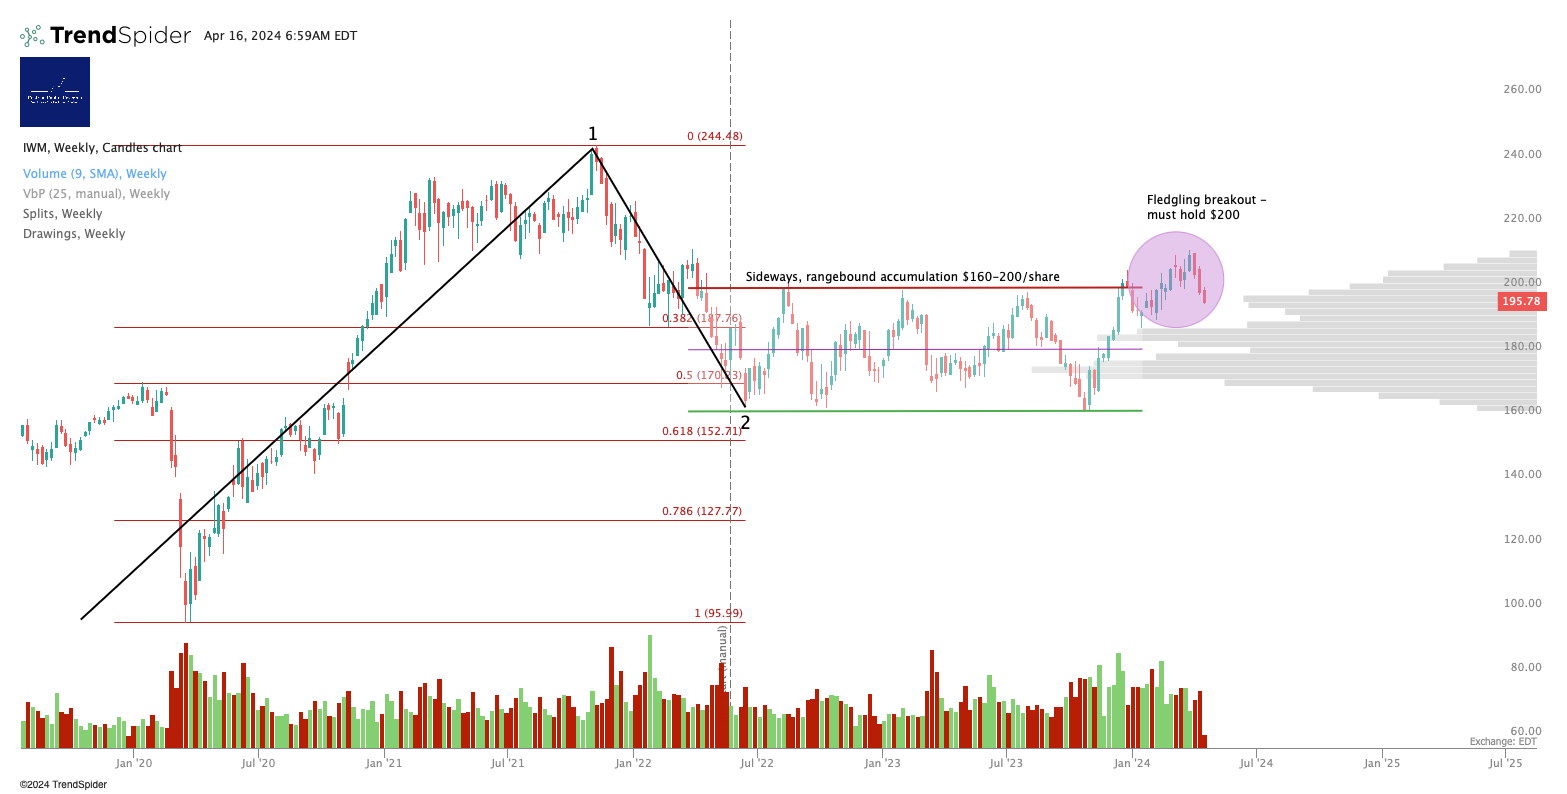
Russell 2000 / IWM / RTY / TNA
It’s still all about $200. Above, bullish, below, bearish. For now this is looking like a failed breakout.
As a headline number we can probably say RTY >2000, bullish, below, bearish. Assuming this A-B-C correction continues we may see support at around 1900 (the Wave (iv) low on the chart below.
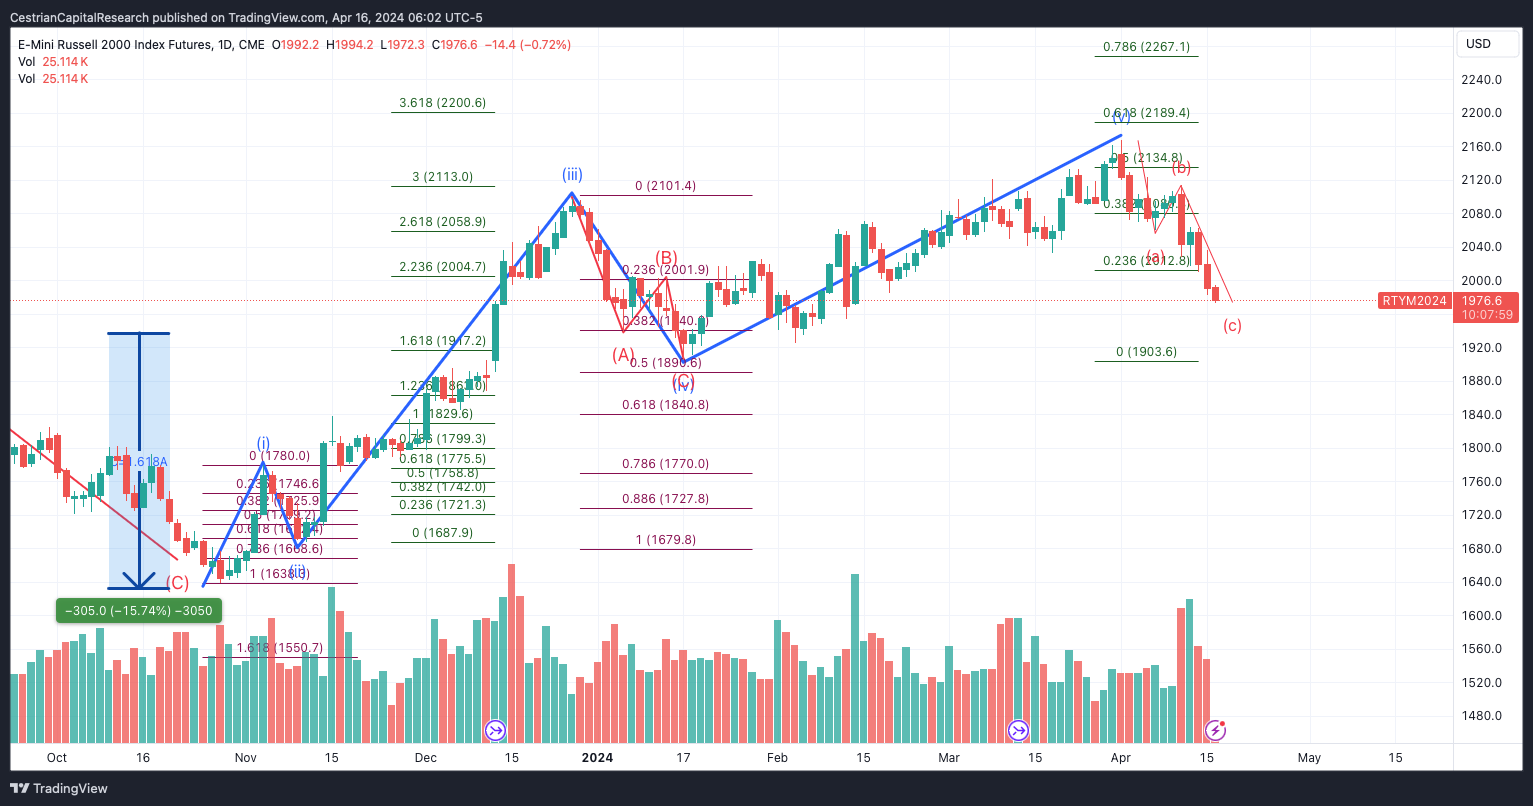
Below $42, risk to the downside. Above $42 and $42 turned into support, looking to the upside. Now $34.
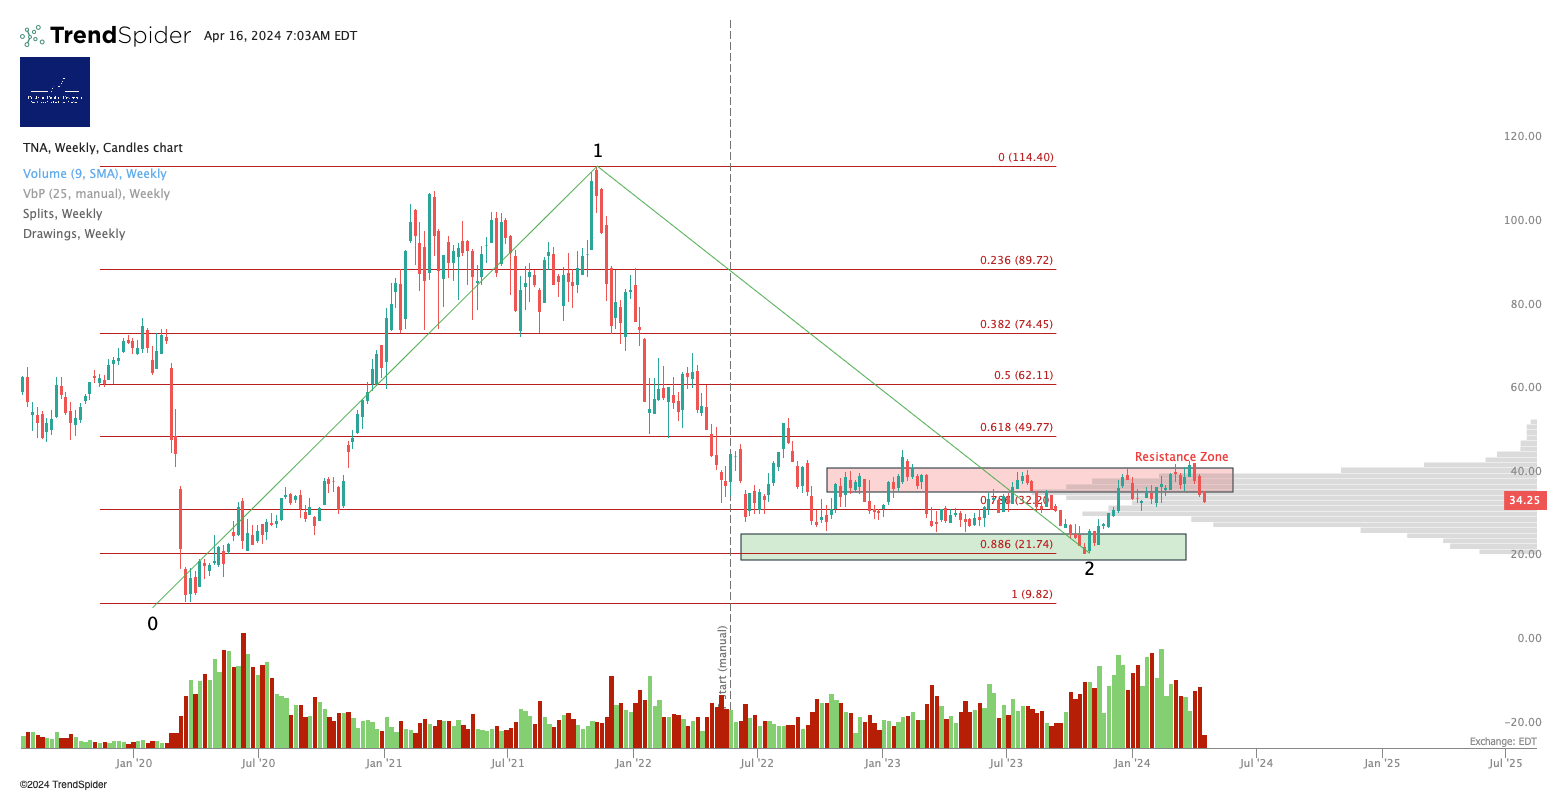
Personal Trading Plan Disclosure: Hedged 4:1 long:short TNA:TZA.
3x Levered Long XLK (Tech) - TECL
Downtrend continuing on the weekly.
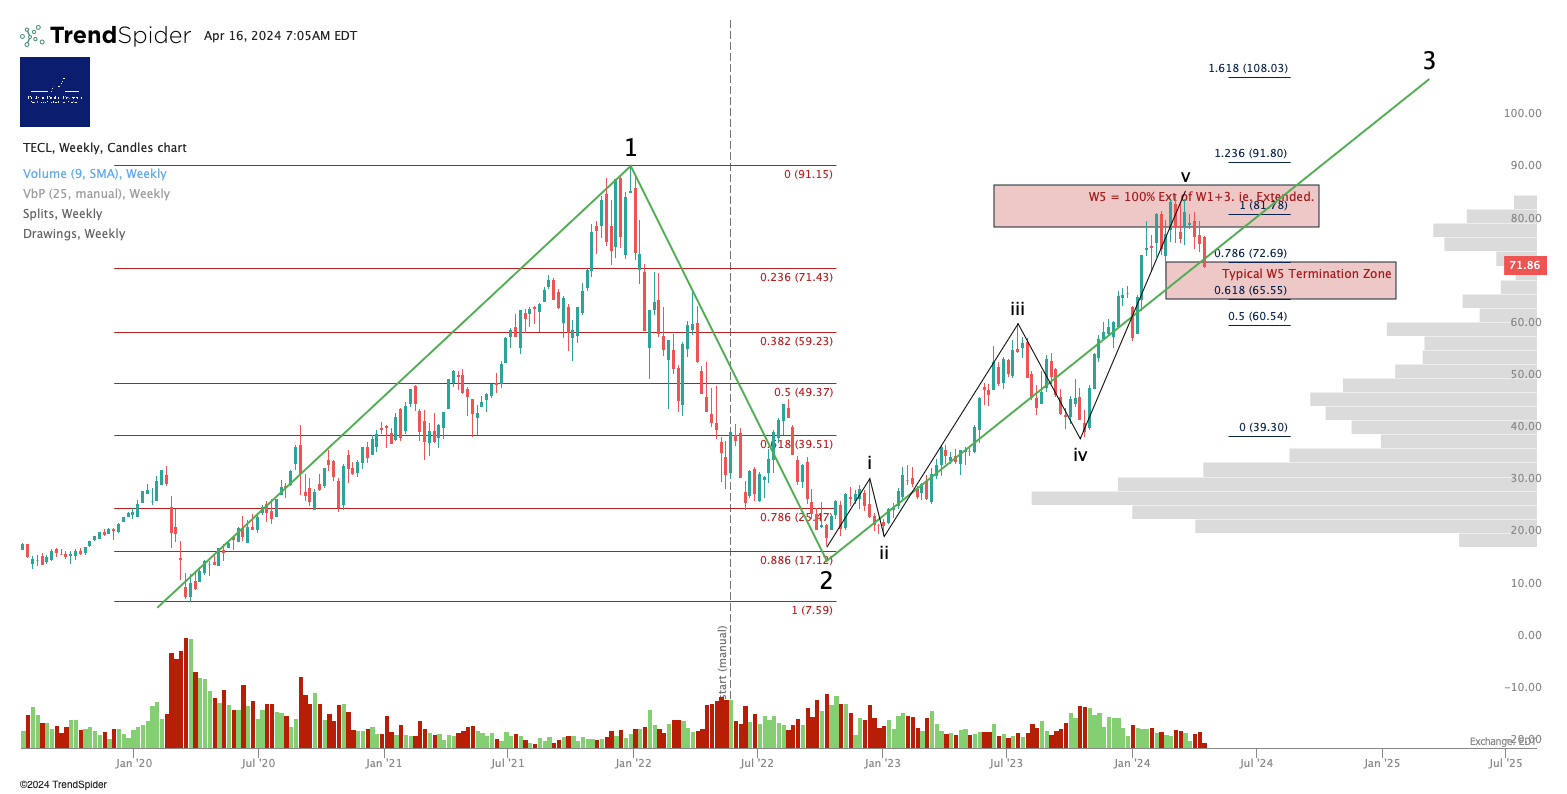
Personal Trading Plan Disclosure: No position in TECL or TECS.
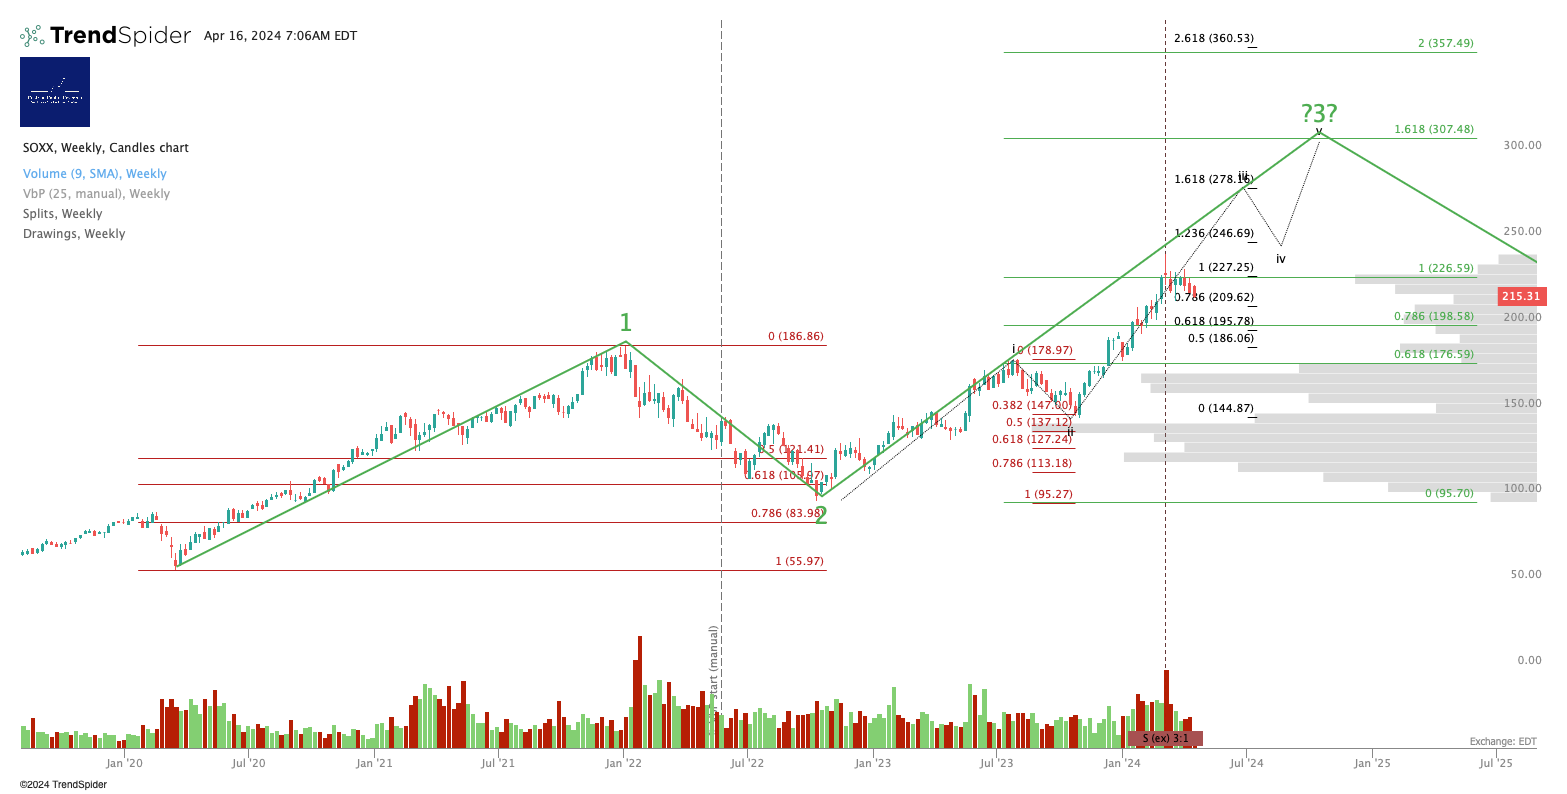
SOXX (Semiconductor Sector ETF)
Unchanged $307 price target. May be some pain before that gain. Still holding over the weekly low struck w/c March 18, rather surprisingly.
3x Levered Long SOXX (Semiconductor) - SOXL
Also still holding over that Wave (iv) low, also surprisingly.
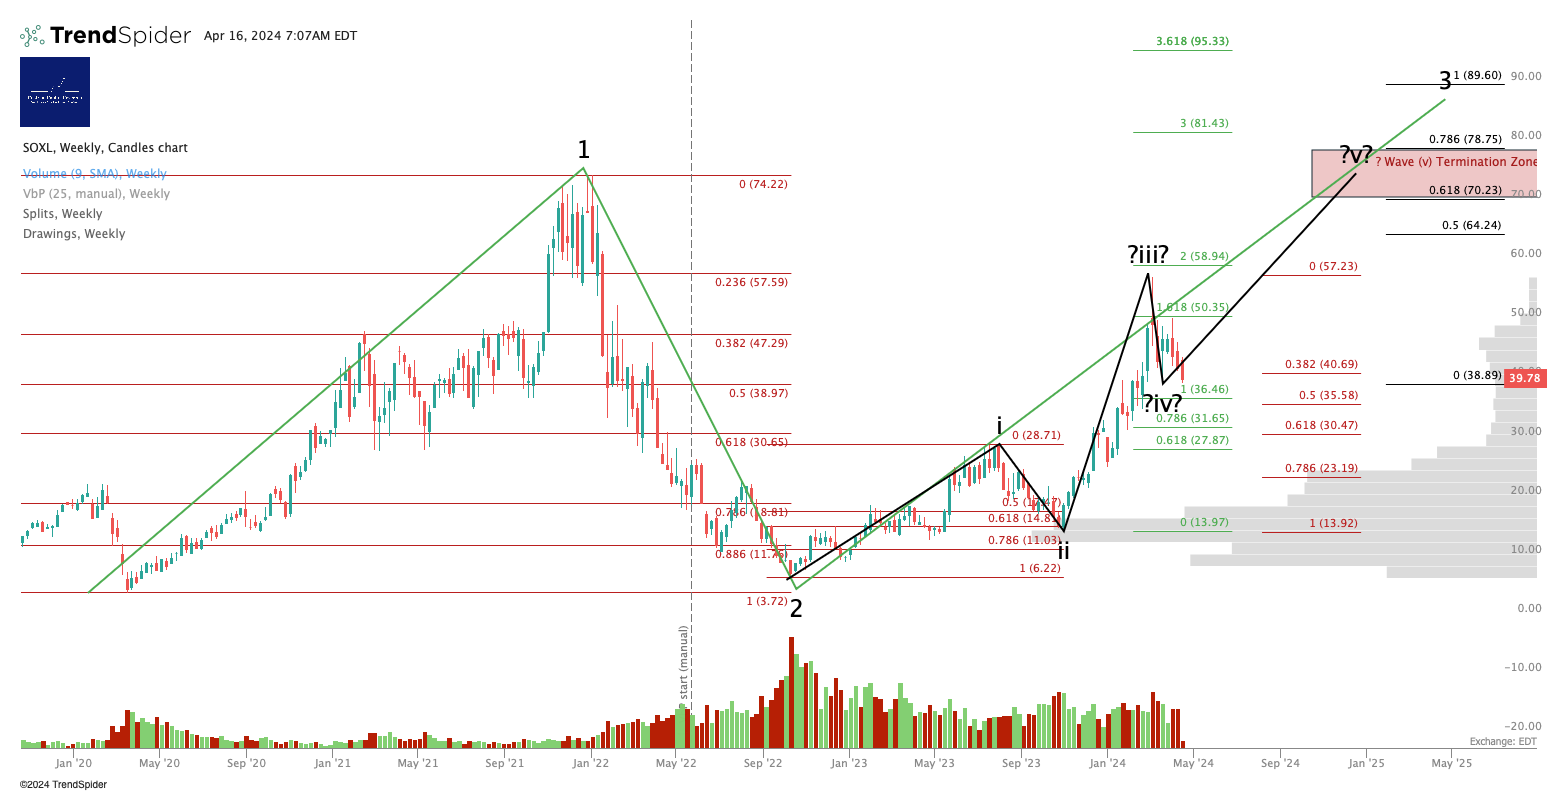
Personal Trading Plan Disclosure: I am unhedged long SOXL.
3x Levered Long Megacaps - FNGU
Despite everything else going on in the world, that to me still looks like accumulation ahead of tech earnings.
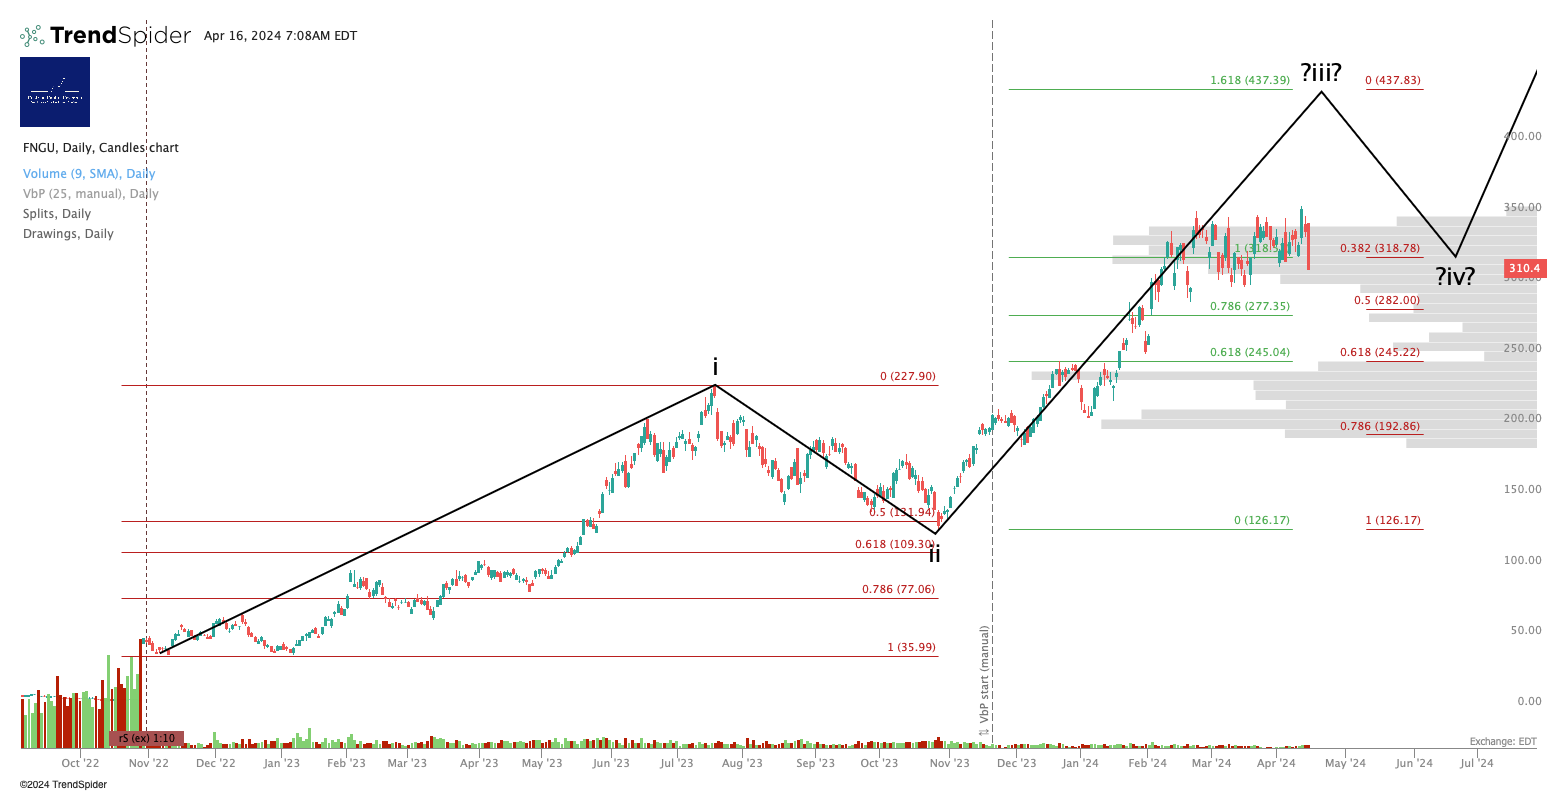
Personal Trading Plan Disclosure: No position in FNGU or FNGD.
Alex King, Cestrian Capital Research, Inc - 16 April 2024. DISCLOSURE - Cestrian Capital Research, Inc staff personal accounts hold long positions in, inter alia, TQQQ, SQQQ, UPRO, SPXU, SOXL, TNA, TZA, TMF, UCO, SVXY plus 3USL and QQQ3 (EU UCITS equivalent to UPRO and TQQQ respectively).