Market On Open, Friday 2 August

DISCLAIMER: This note is intended for US recipients only and, in particular, is not directed at, nor intended to be relied upon by any UK recipients. Any information or analysis in this note is not an offer to sell or the solicitation of an offer to buy any securities. Nothing in this note is intended to be investment advice and nor should it be relied upon to make investment decisions. Cestrian Capital Research, Inc., its employees, agents or affiliates, including the author of this note, or related persons, may have a position in any stocks, security, or financial instrument referenced in this note. Any opinions, analyses, or probabilities expressed in this note are those of the author as of the note's date of publication and are subject to change without notice. Companies referenced in this note or their employees or affiliates may be customers of Cestrian Capital Research, Inc. Cestrian Capital Research, Inc. values both its independence and transparency and does not believe that this presents a material potential conflict of interest or impacts the content of its research or publications.
Why, Chairman Powell? WHY?
by Alex King
Obviously the Internet will EXPLODE with opinion about WHY MARKETS ARE NOW IN MELTDOWN and such. This isn’t news to you, because you read this note every day, and you will note that we were cautious in early July, which has proven wise so far. Inner Circle subscribers will have seen real-time trade disclosure alerts to this effect too, ie. Cestrian staff accounts selling many single-stock positions, raising cash and hedging index and sector ETFs.
I myself suspect there is a countertrend rally to be had before the market tops out for real, but that may not be today; it may need a better answer to the key question “wen cut?” than was given by the Fed this week. You can read the market’s action at present as an attempt to bully the Fed into cutting; equally if the Fed does just cut right away you can expect the market to conclude WHAT DOES HE KNOW THAT WE DON’T. Bearishness begets more bearishness just as bullishness begets more bullishness.
So let’s just take a look at how reality sits right now.
Let’s Get To Work
As always in our market notes, we deal with long- and short-term charts covering the main US equity indices - that’s the S&P500, Nasdaq-100, Dow Jones-30, and the Russell 2000 - plus bonds, volatility, oil, and key sector ETFs. You can use these daily notes to help you navigate long-term investments, and/or to help you action short-term trading. Any paid-tier subscription here gets you these notes every trading day.
Short- And Medium-Term Market Analysis
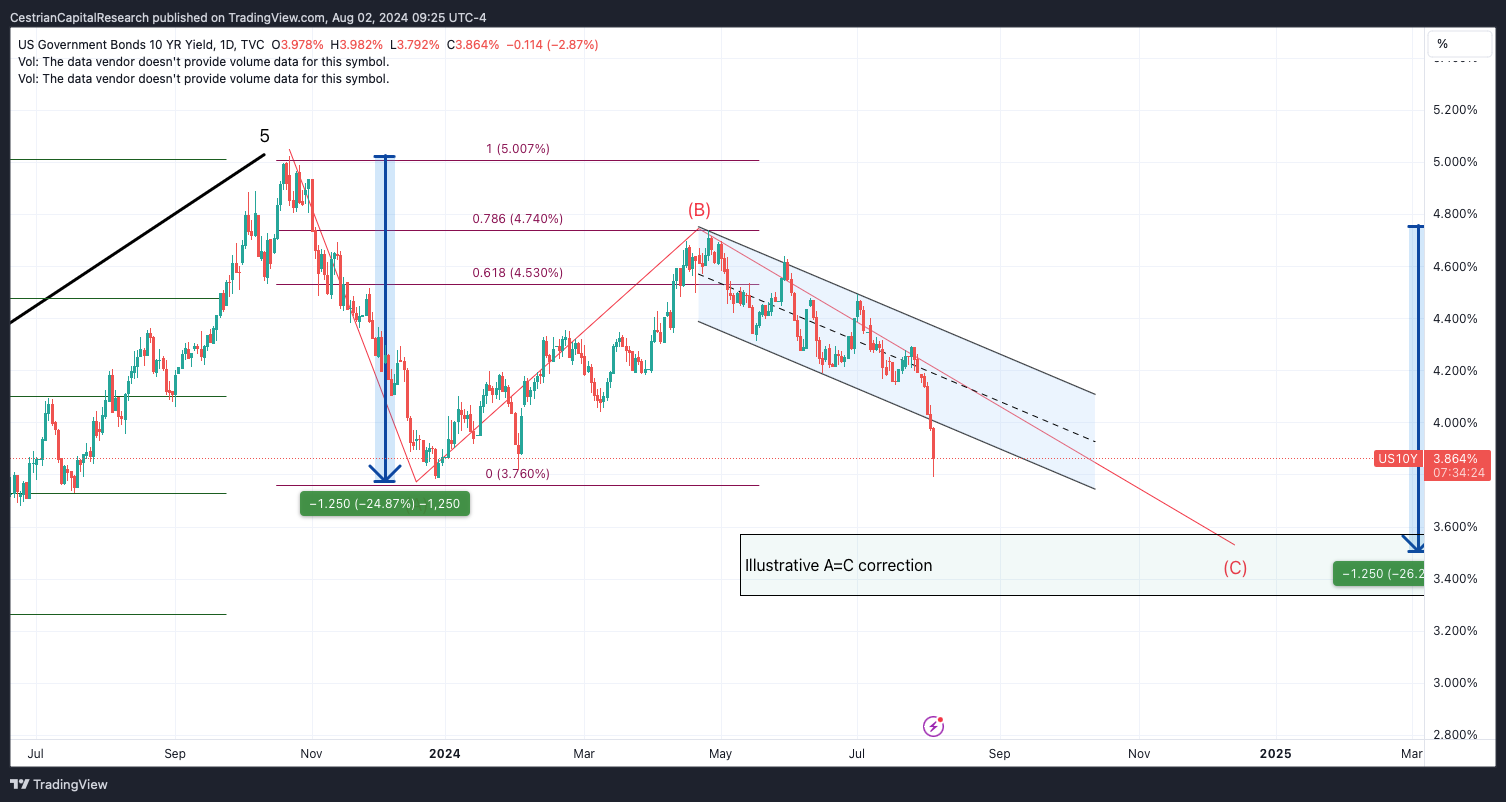
US 10-Year Yield
Today’s move is known in technical analyst circles as, wowzers.
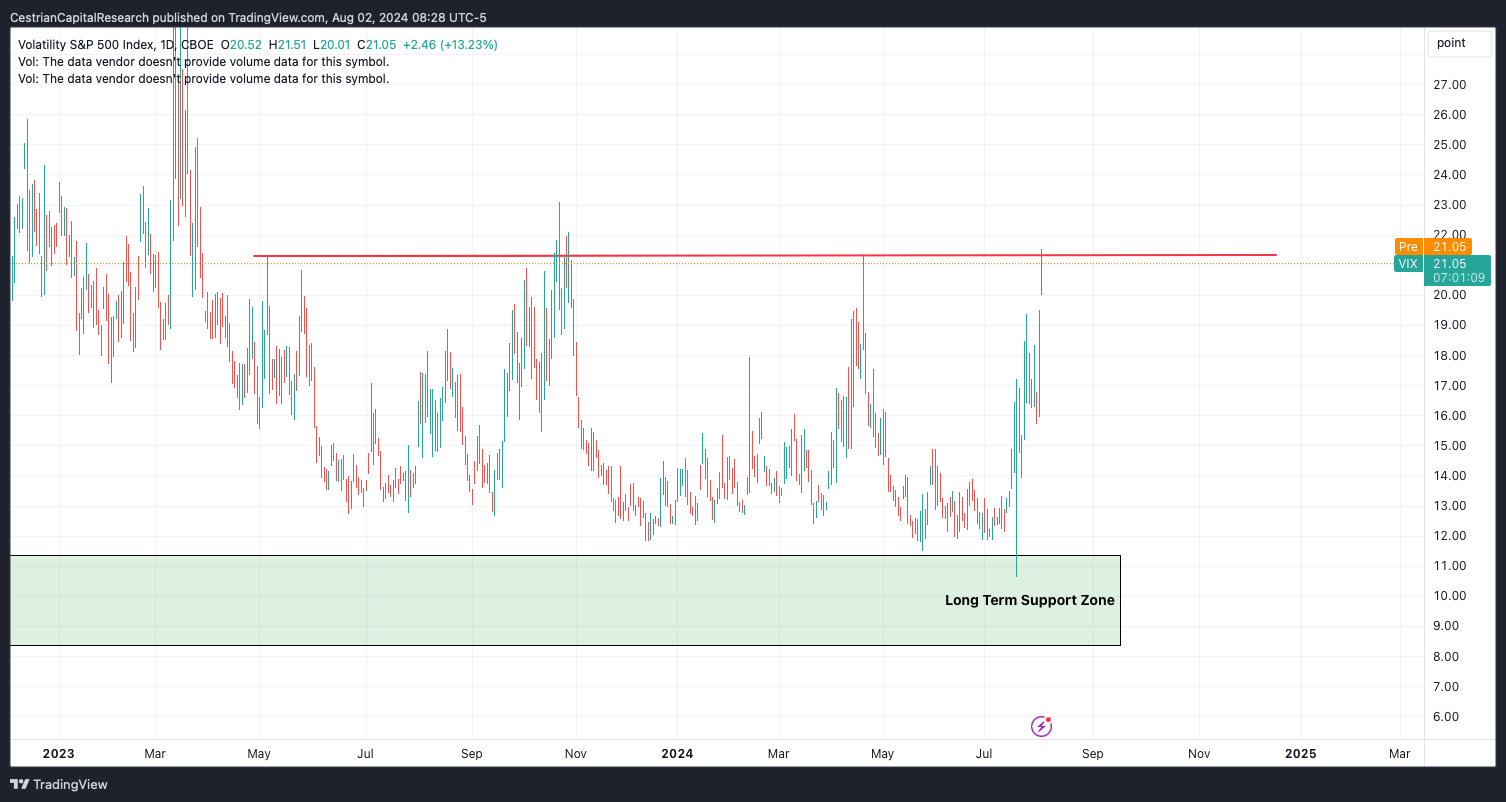
Equity Volatility
Spiking to April highs.
Disclosure: No position in Vix-based securities.
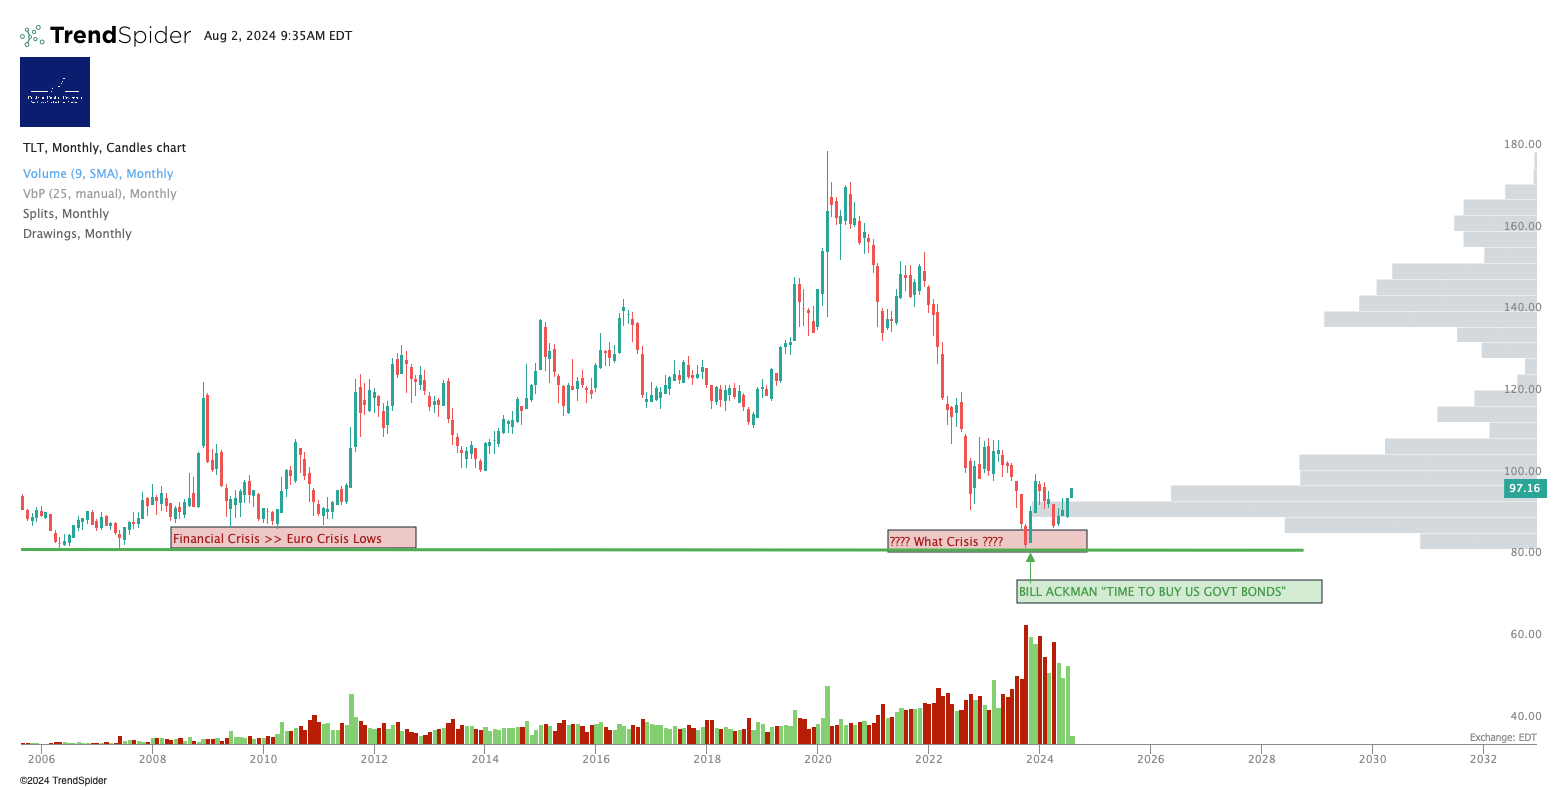
Longer-Term Treasury Bonds (TLT / TMF)
Still looking good.
Exceeded a 1.618 Wave (iii) today; I would be unsurprised if this drops back a little before another move higher.
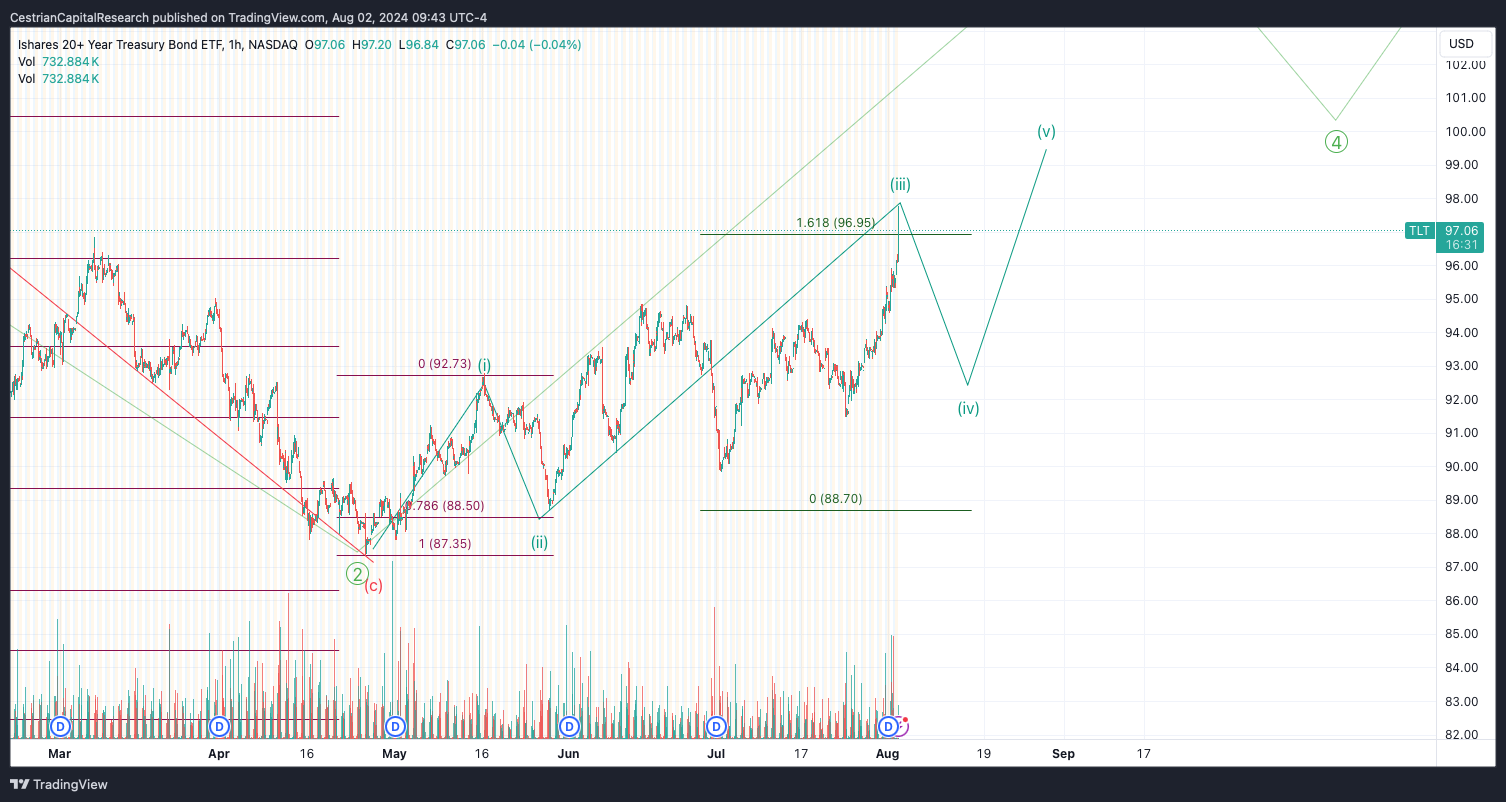
Confirmed breakout.
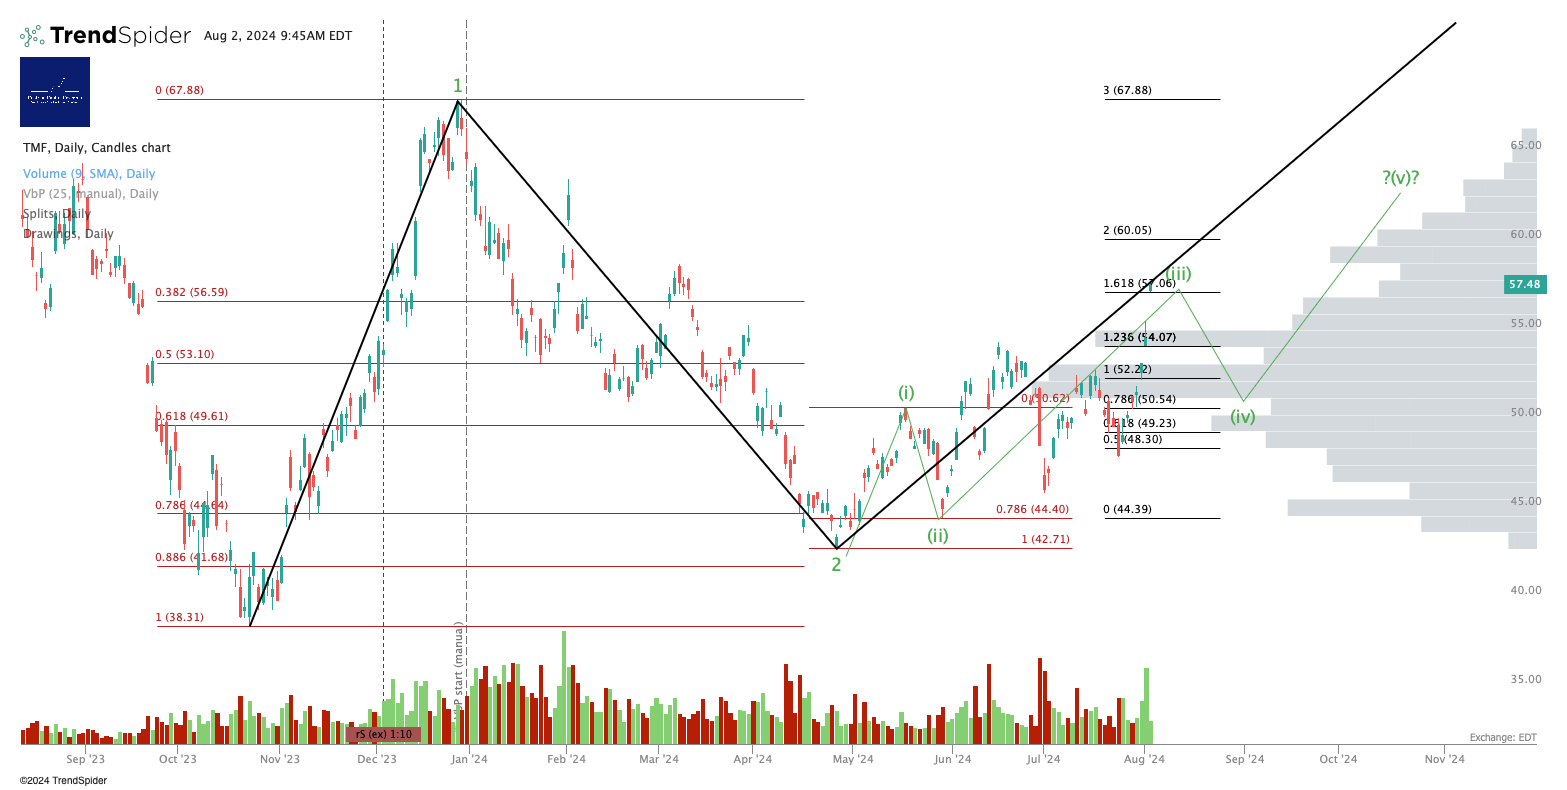
Disclosure: No position in bonds - banked gains in TMF earlier today.
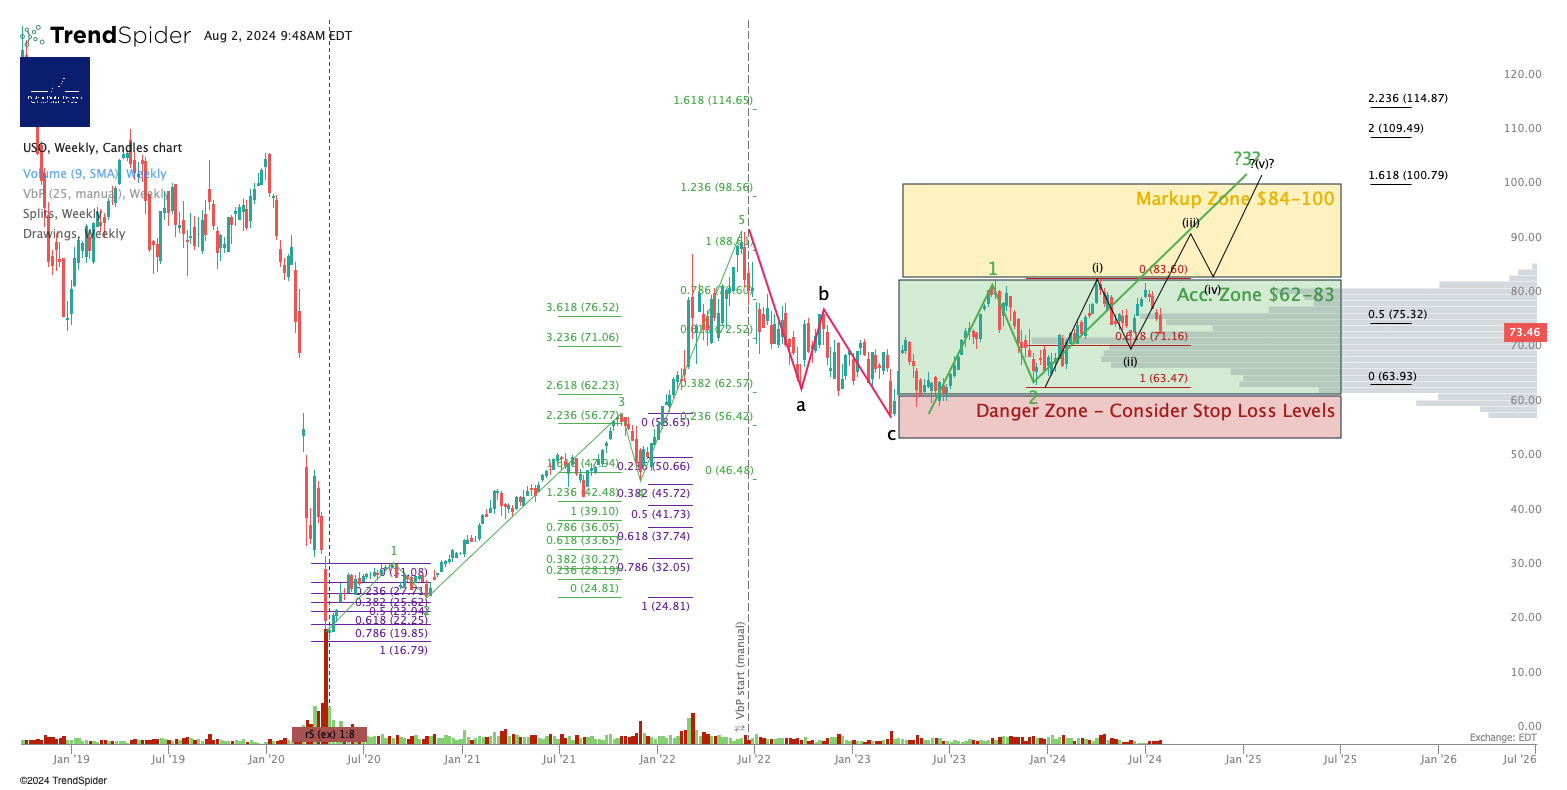
Oil (USO / WTI / UCO)
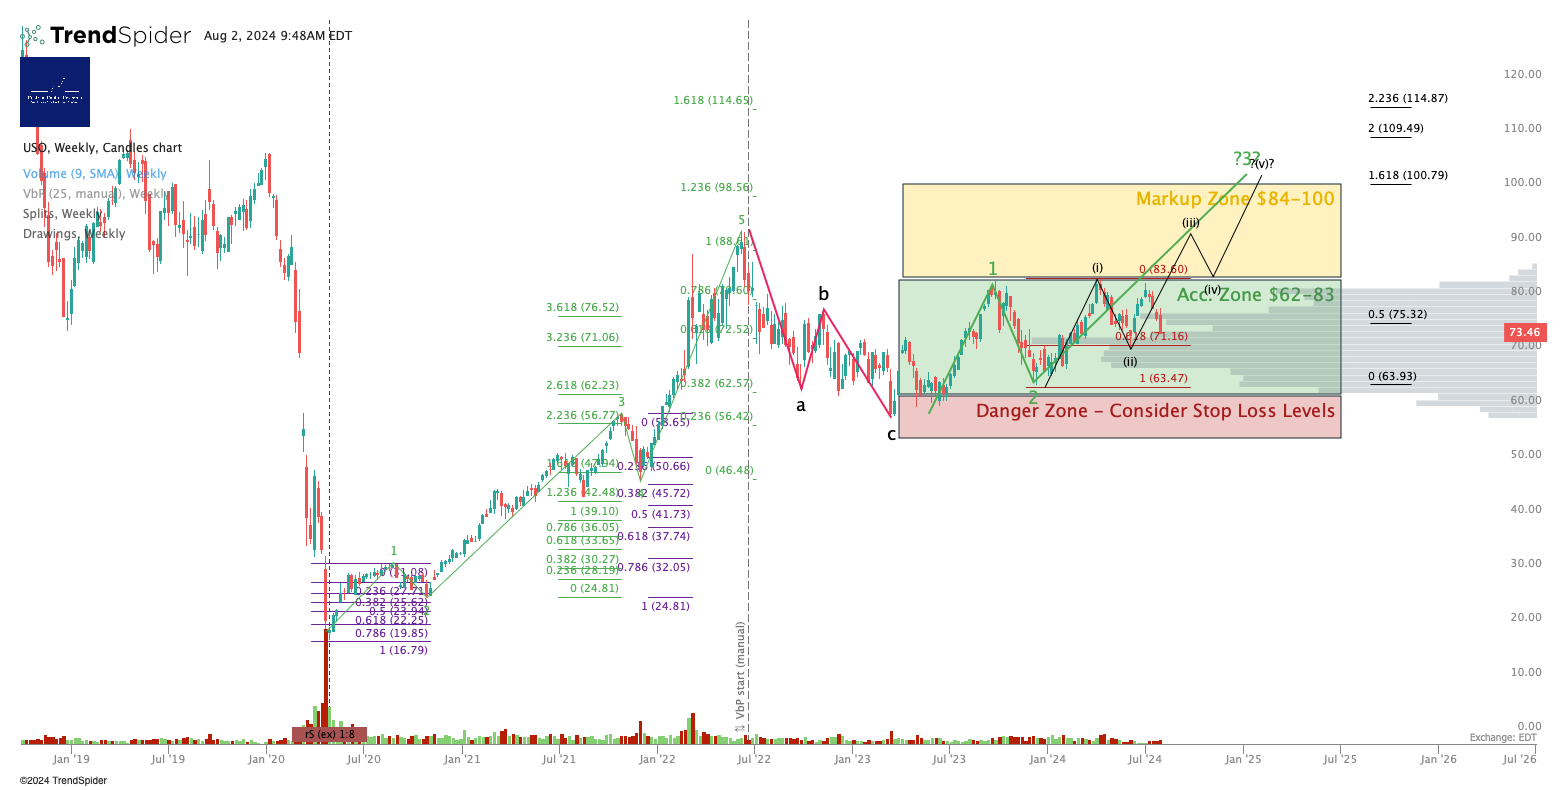
CL<72 breaks this chart. Not broken yet.
Same commentary as USO. Has to push up and over $37 and hold it as support to prove bullish in my view. A break below $25 is bearish.
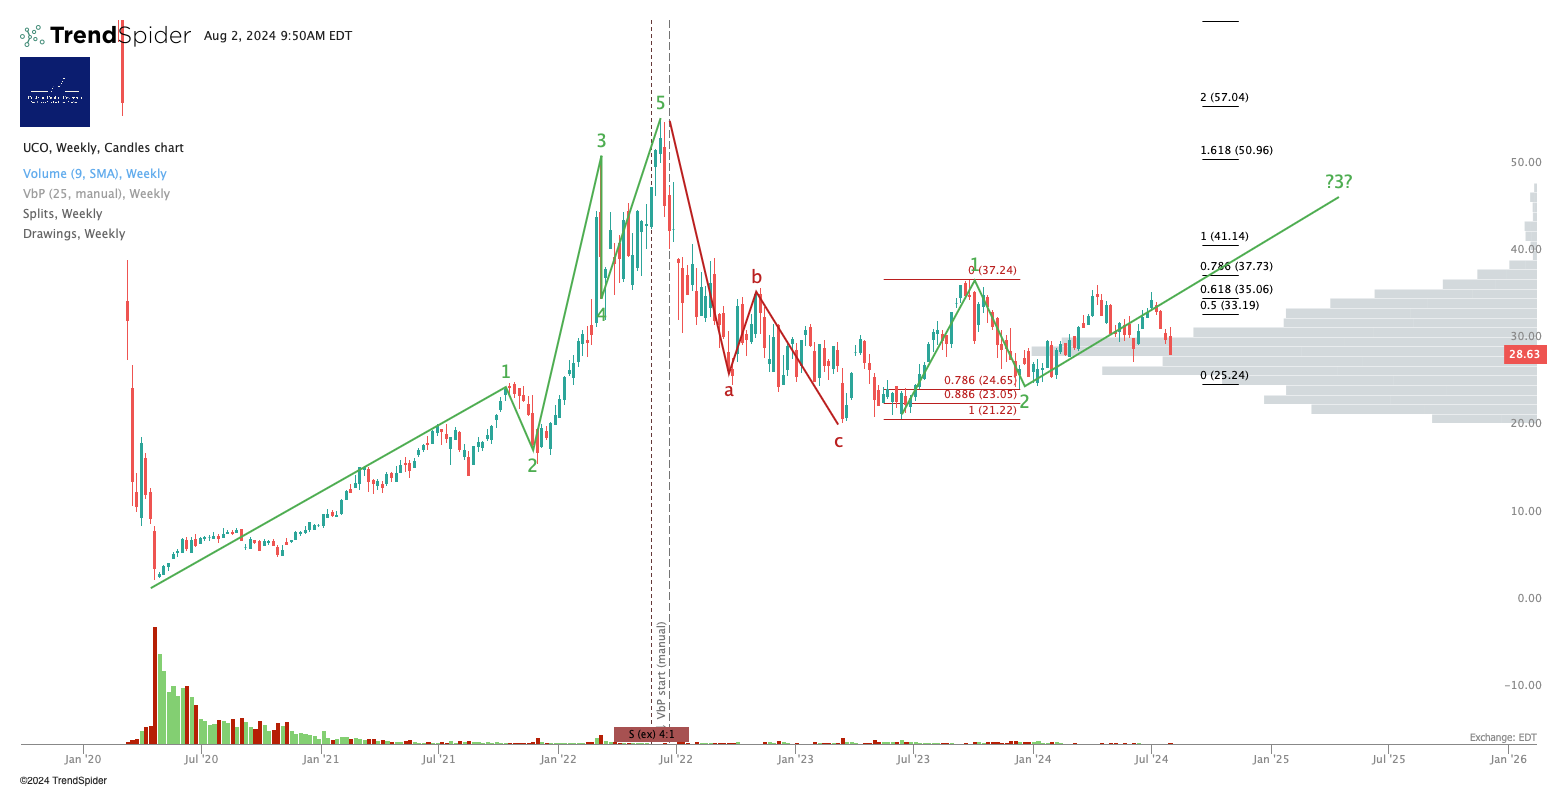
Disclosure: I am unhedged long $UCO.
S&P500 / SPY / ES / UPRO
Whenever the machinations in front of you get a bit much, consider taking a step back to look at the larger degree.
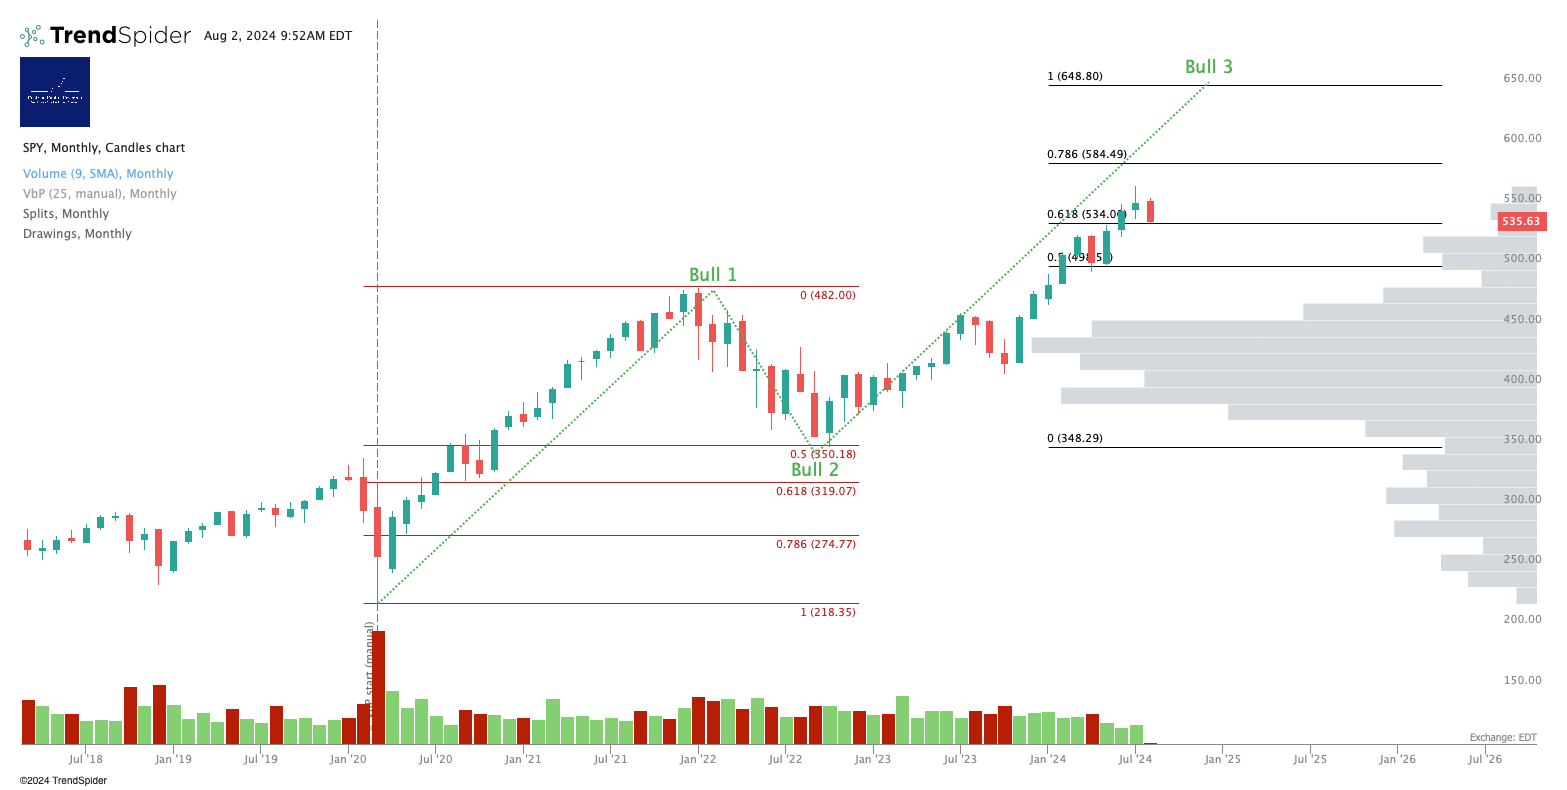
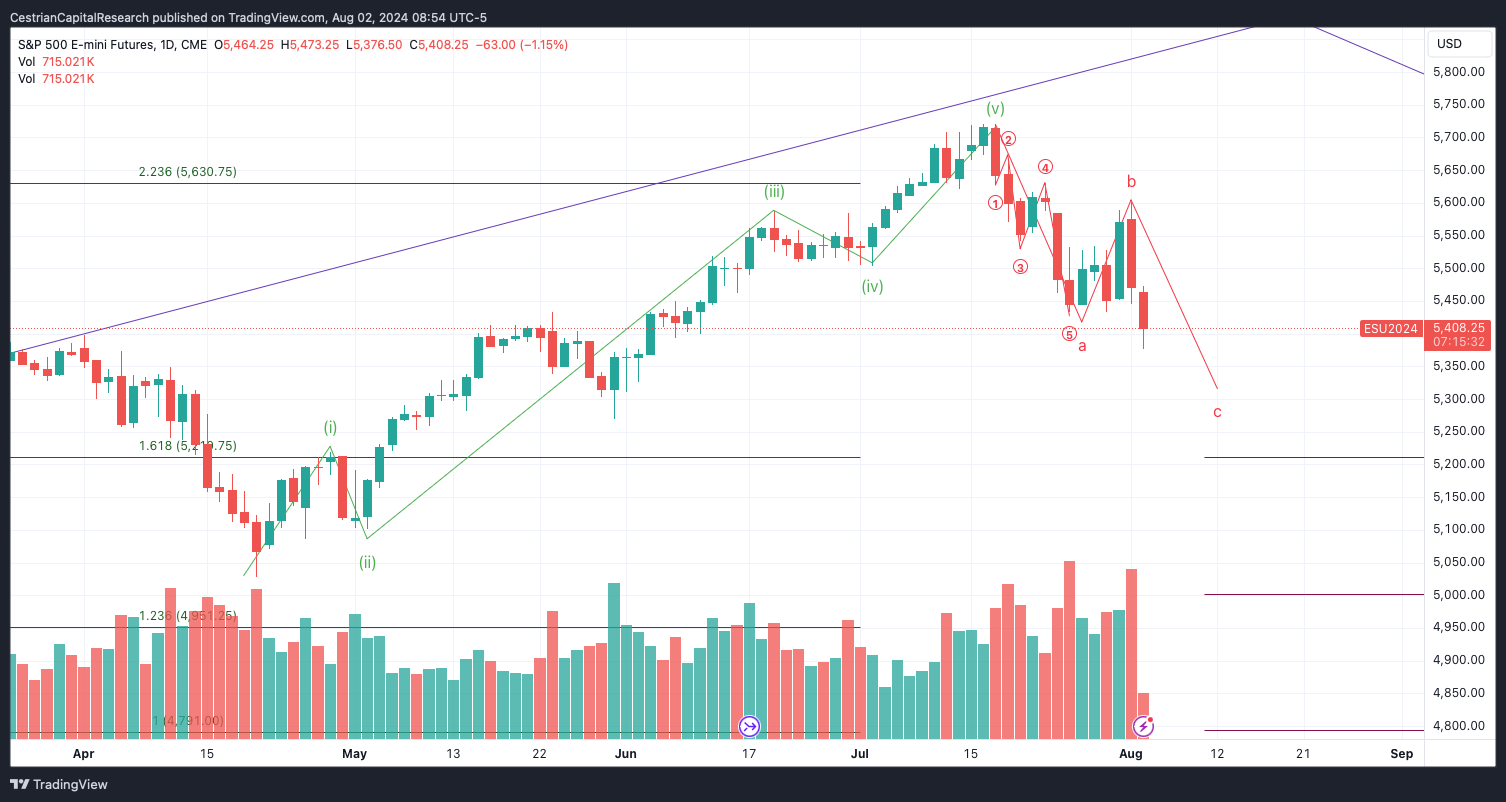
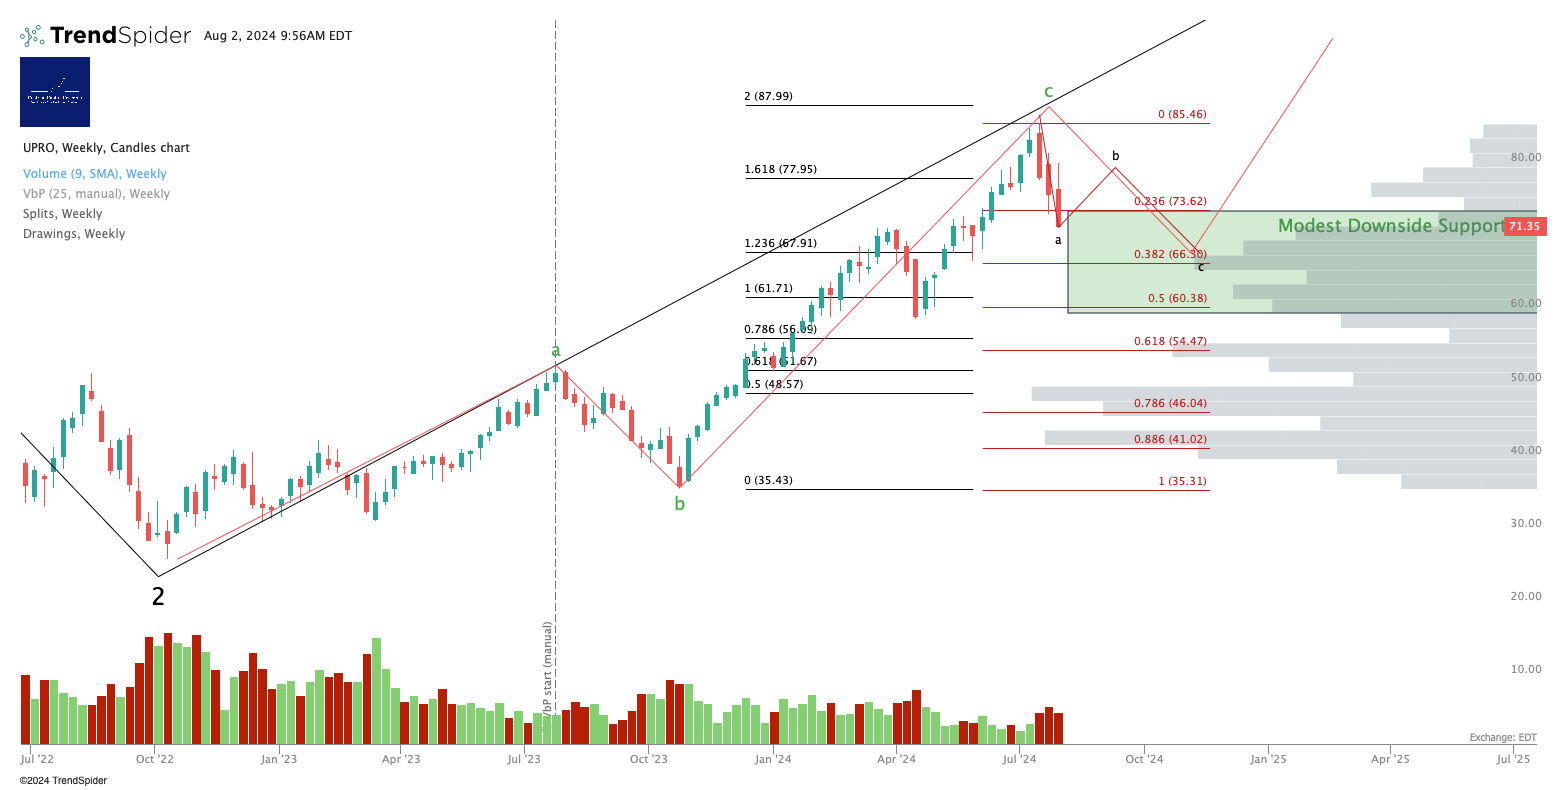
Disclosure: I am 4:1 long:short the S&P500 via 3USL/3USS.
Nasdaq-100 / QQQ / NQ / TQQQ
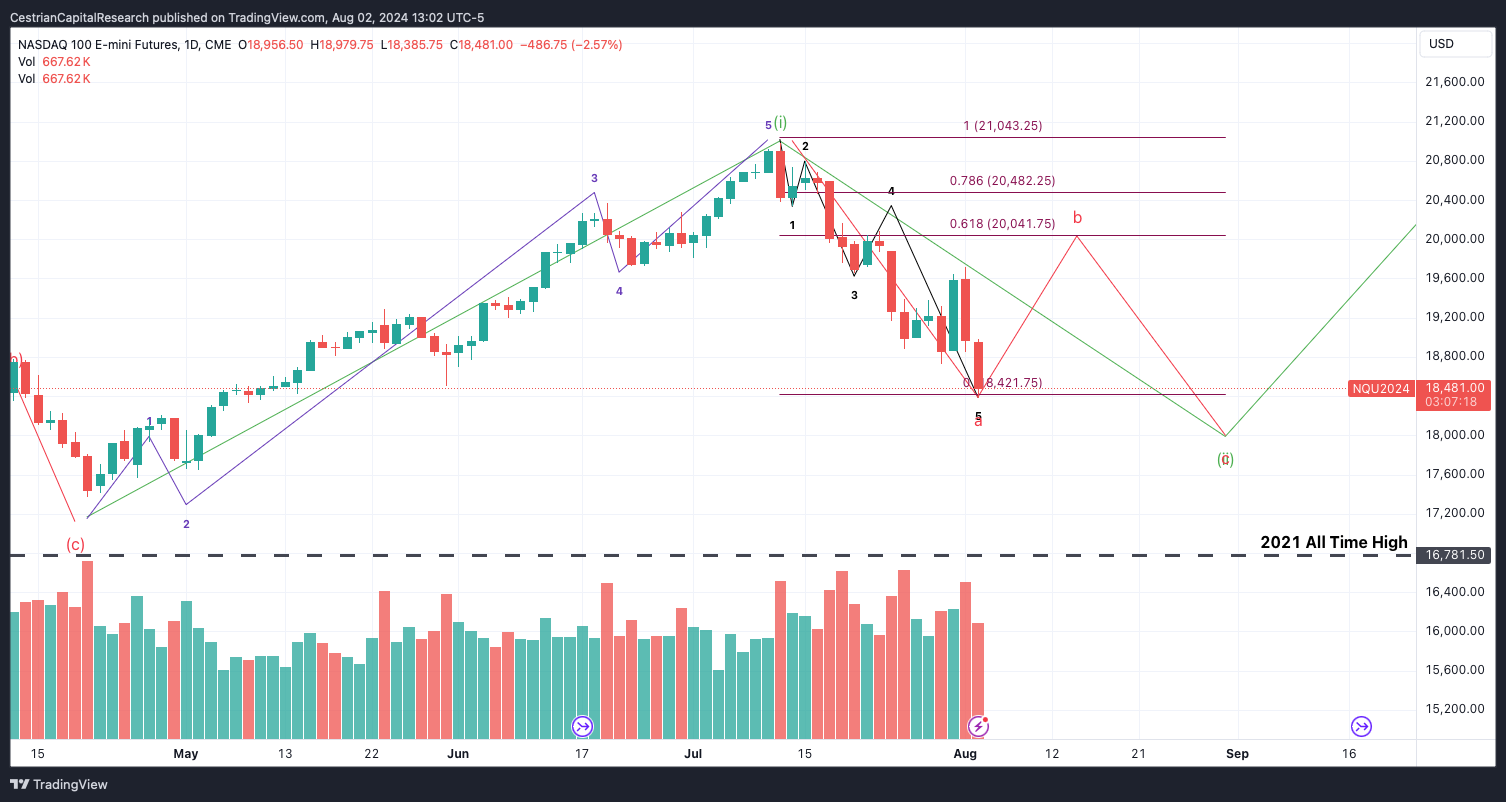
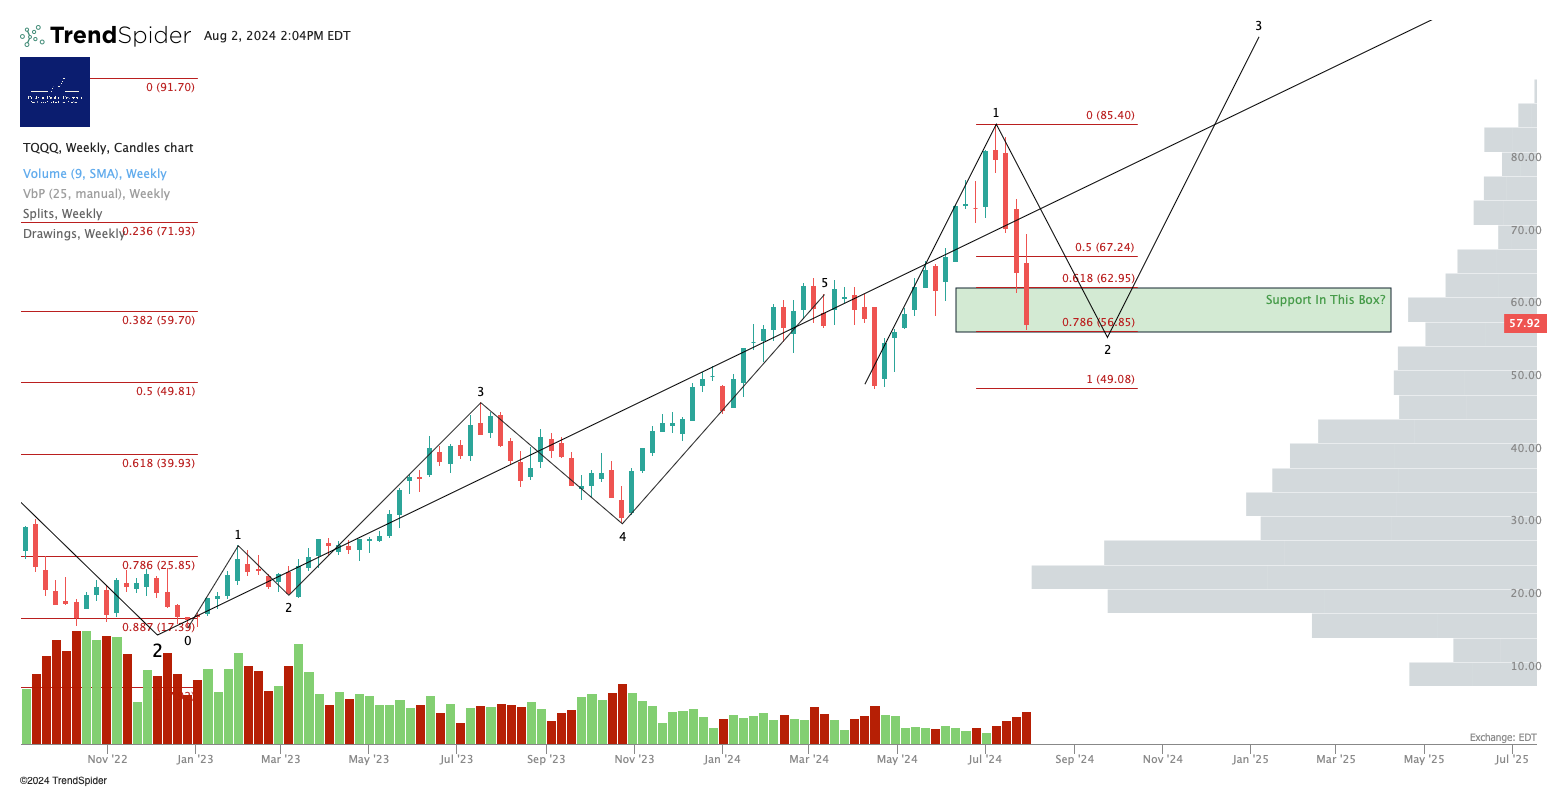
Still just a correction at this stage. Of course it might be the End of Days, but I don’t think so. Not yet!
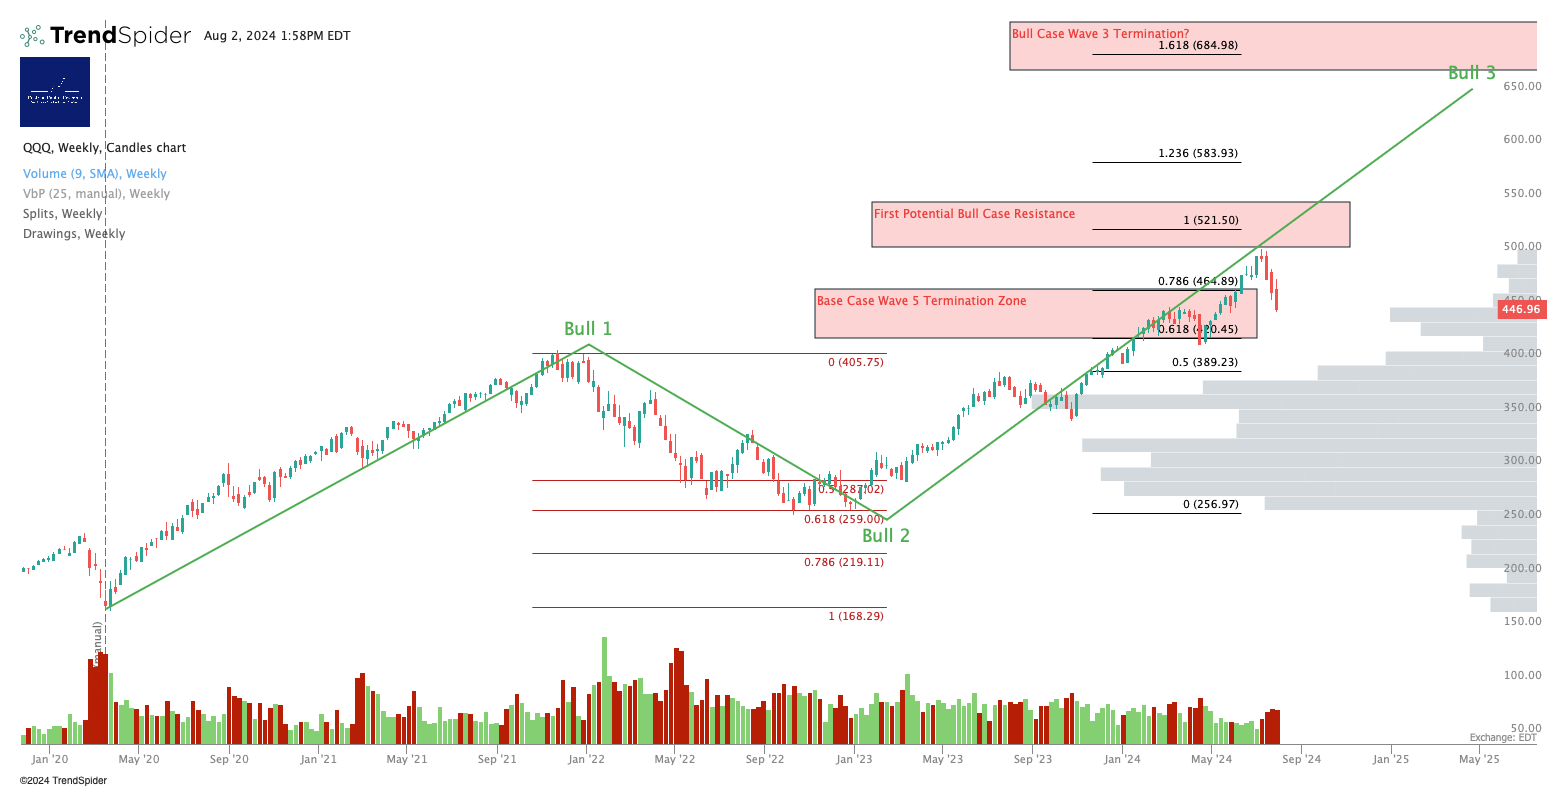
Let’s assume we’re still in an A-wave down, to be followed by a B-wave up then a deeper correction. It could be more cheerful than that but this is the safest assumption I think.
Disclosure: I am hedged 4:1 long:short the Nasdaq via TQQQ:SQQQ and QQQ3:QQQS
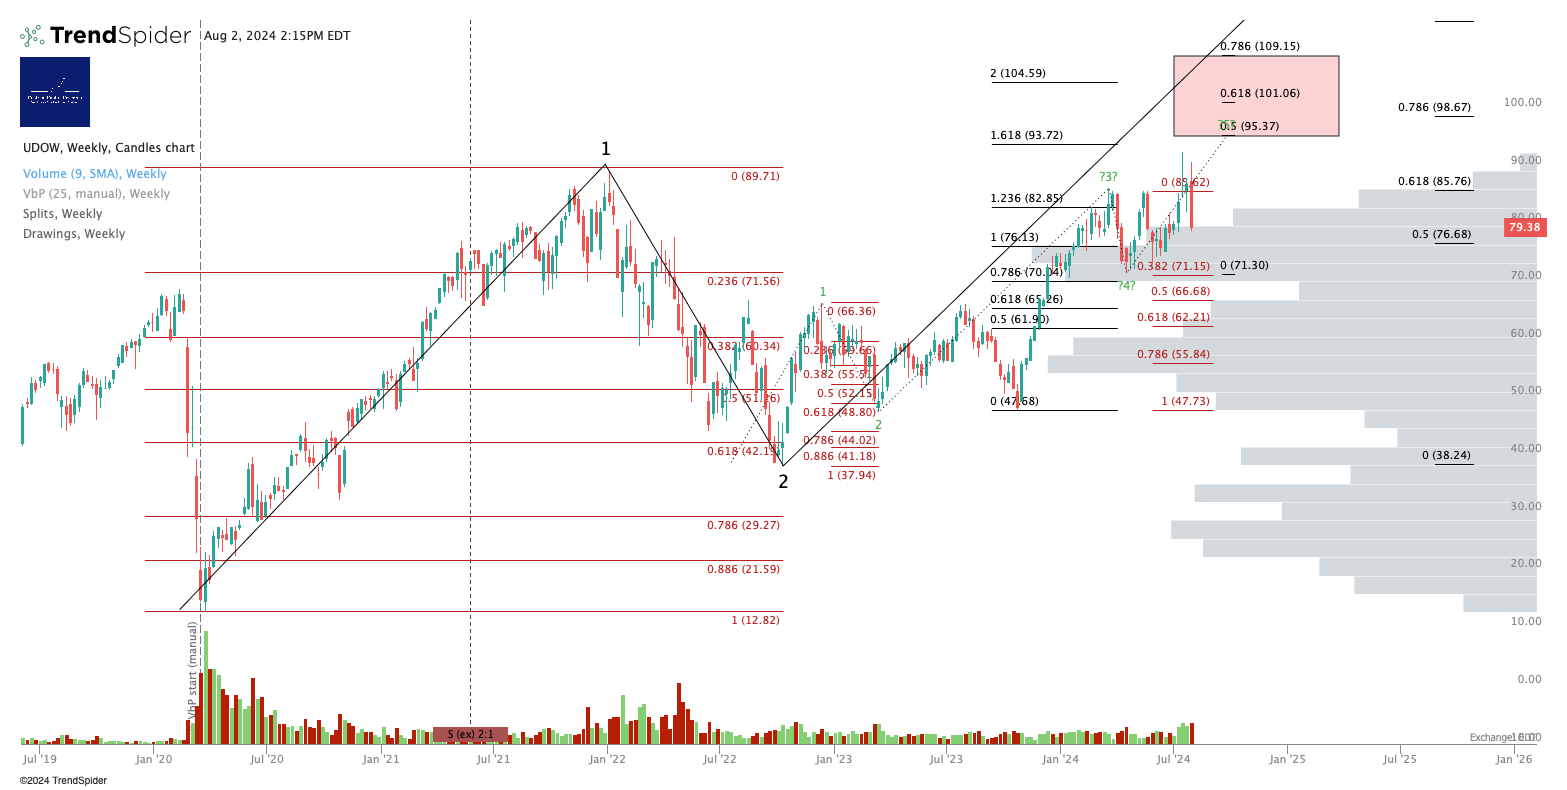
Dow Jones / DIA / YM / UDOW
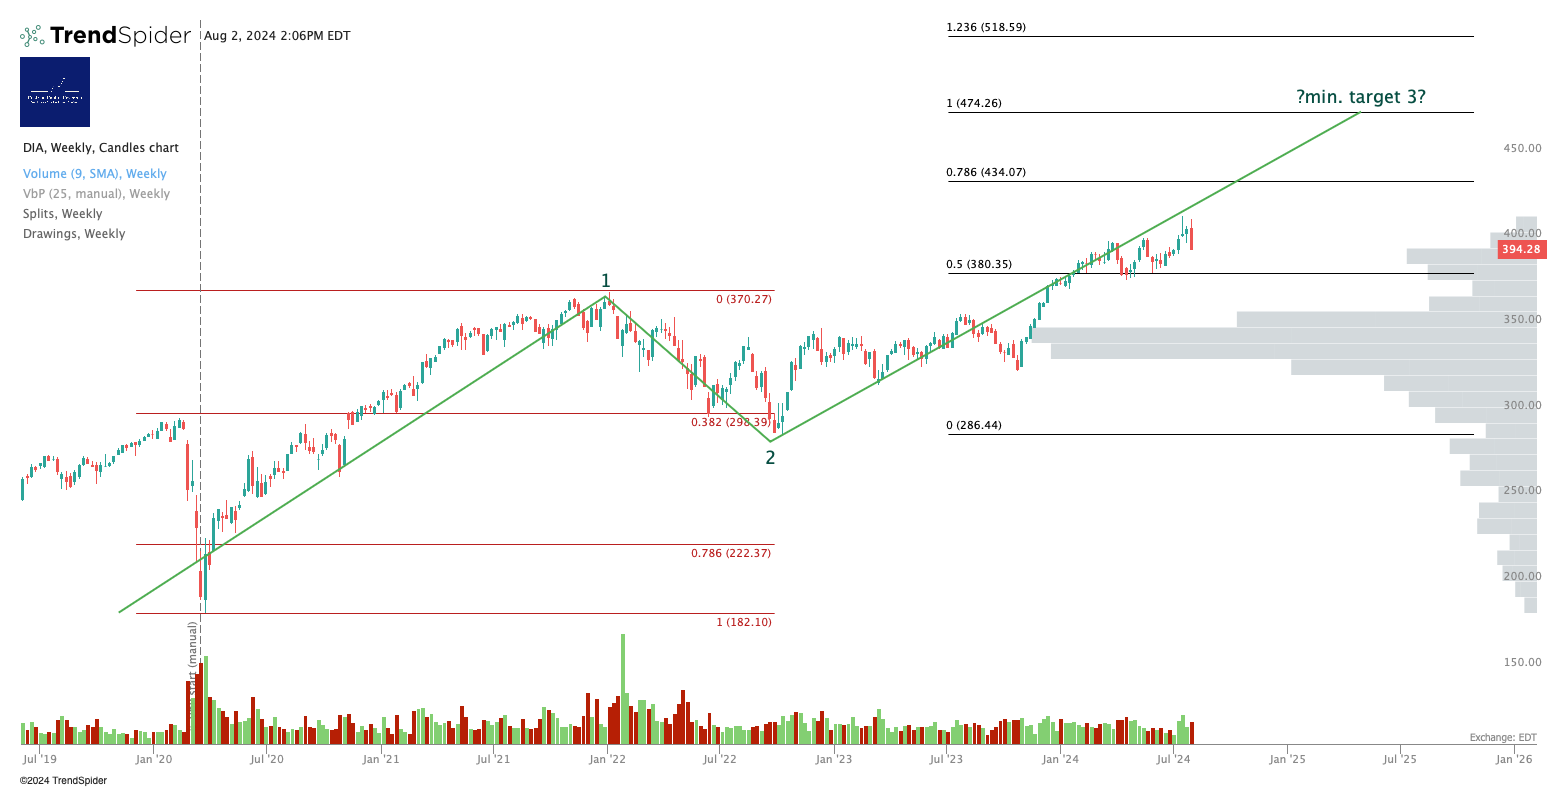
There’s a high volume node around 394-5 which may act as support; if that blows through, next defensible price is likely $370 (the 2021/2 bull market high) then $358 (the next big volume shelf). Dow still looks to have room to run to the upside.
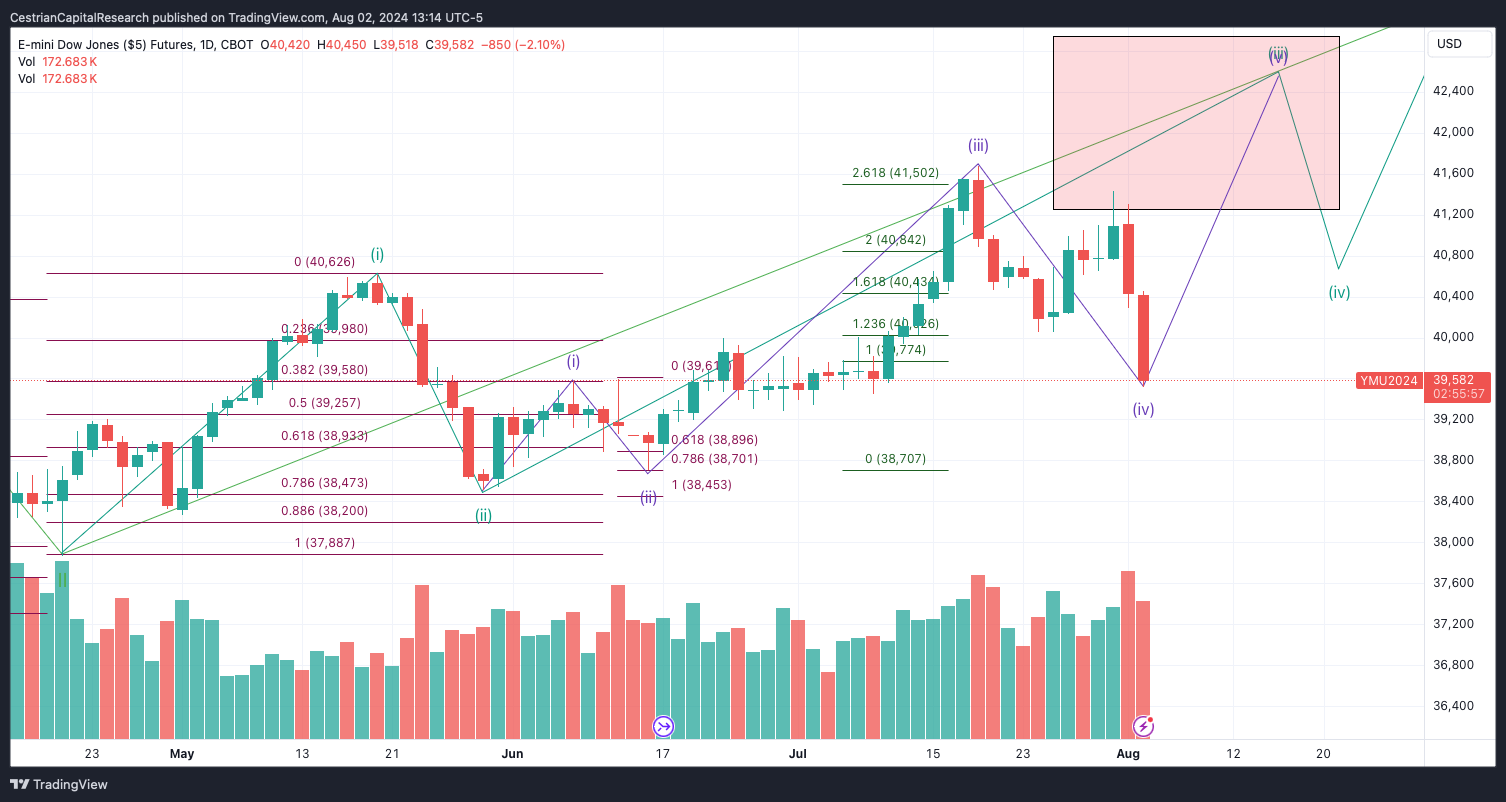
Purple Wave (iv) down holding at the Wave (i) high for now.
Volume shelf at $79 looks like it is being defended.
Disclosure: I am unhedged long $UDOW.
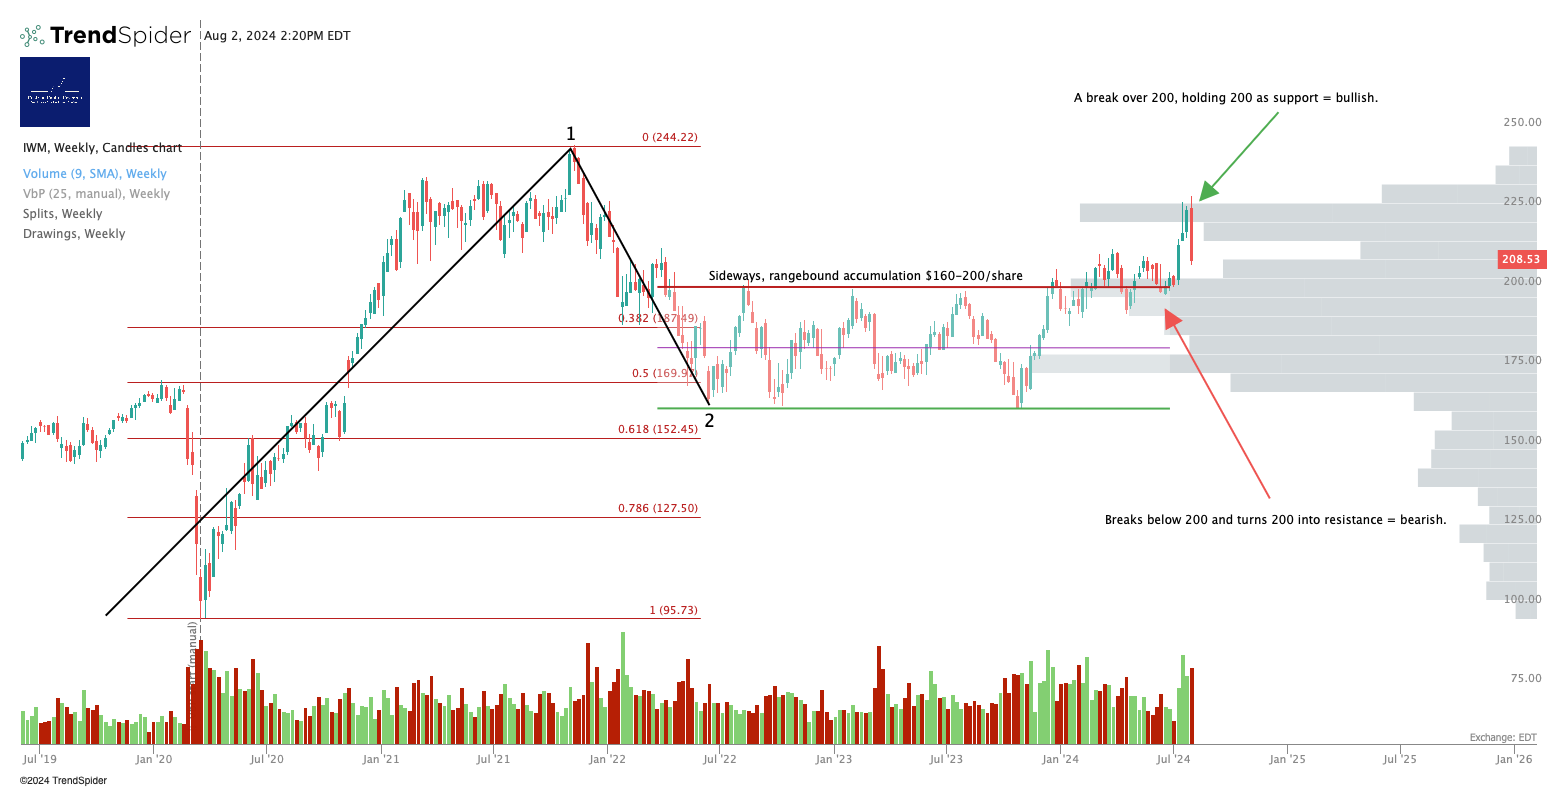
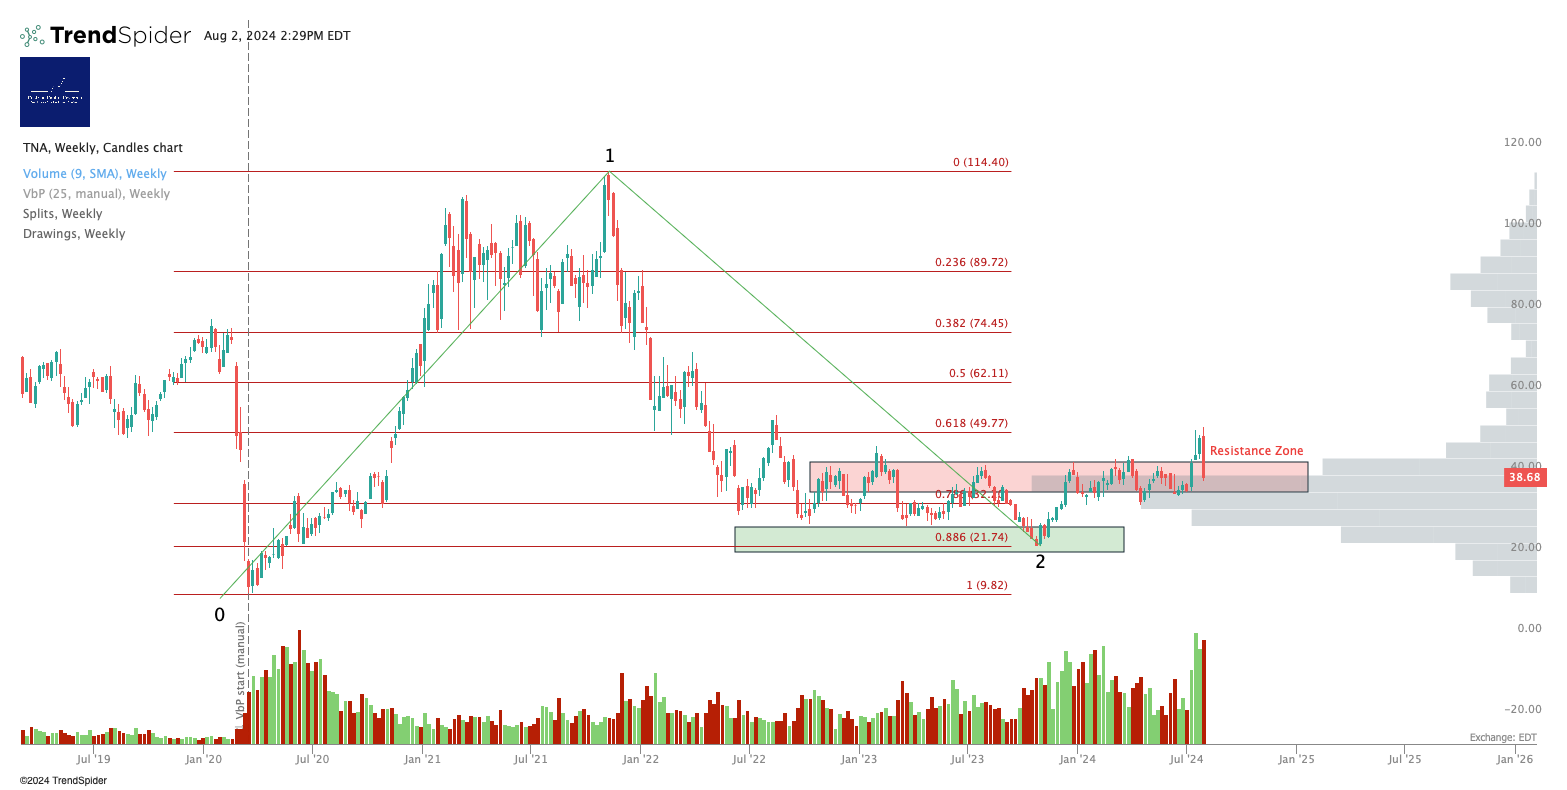
Russell 2000 / IWM / RTY / TNA
Yup, it faded.
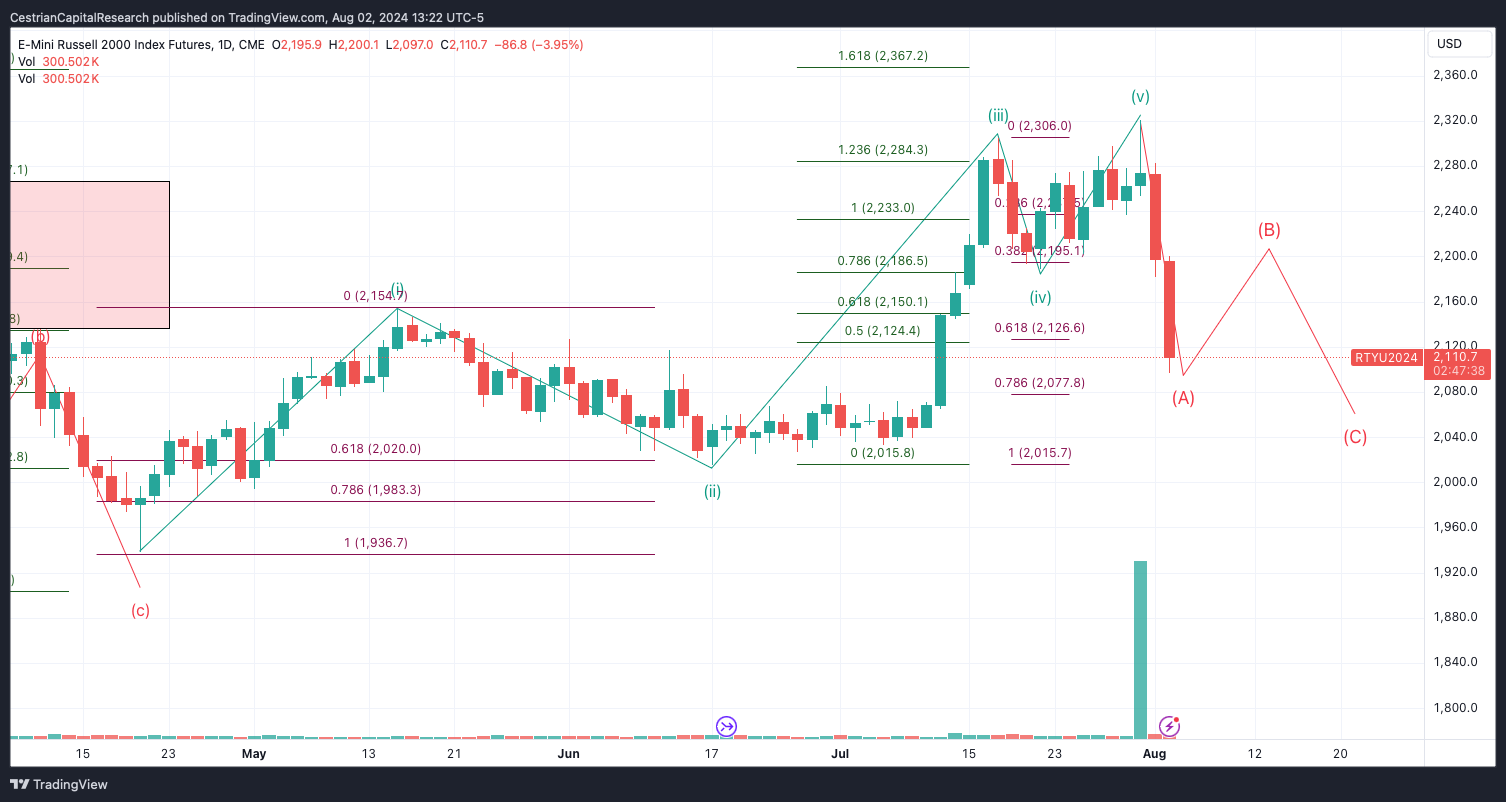
New chart, since the drop cannot now be a Wave (iv) down, the prior high must have been a Wave (v) not a Wave (iii). So I think we’re in an a-b-c correction now.
Disclosure: No position in the Russell.
Sector ETFs
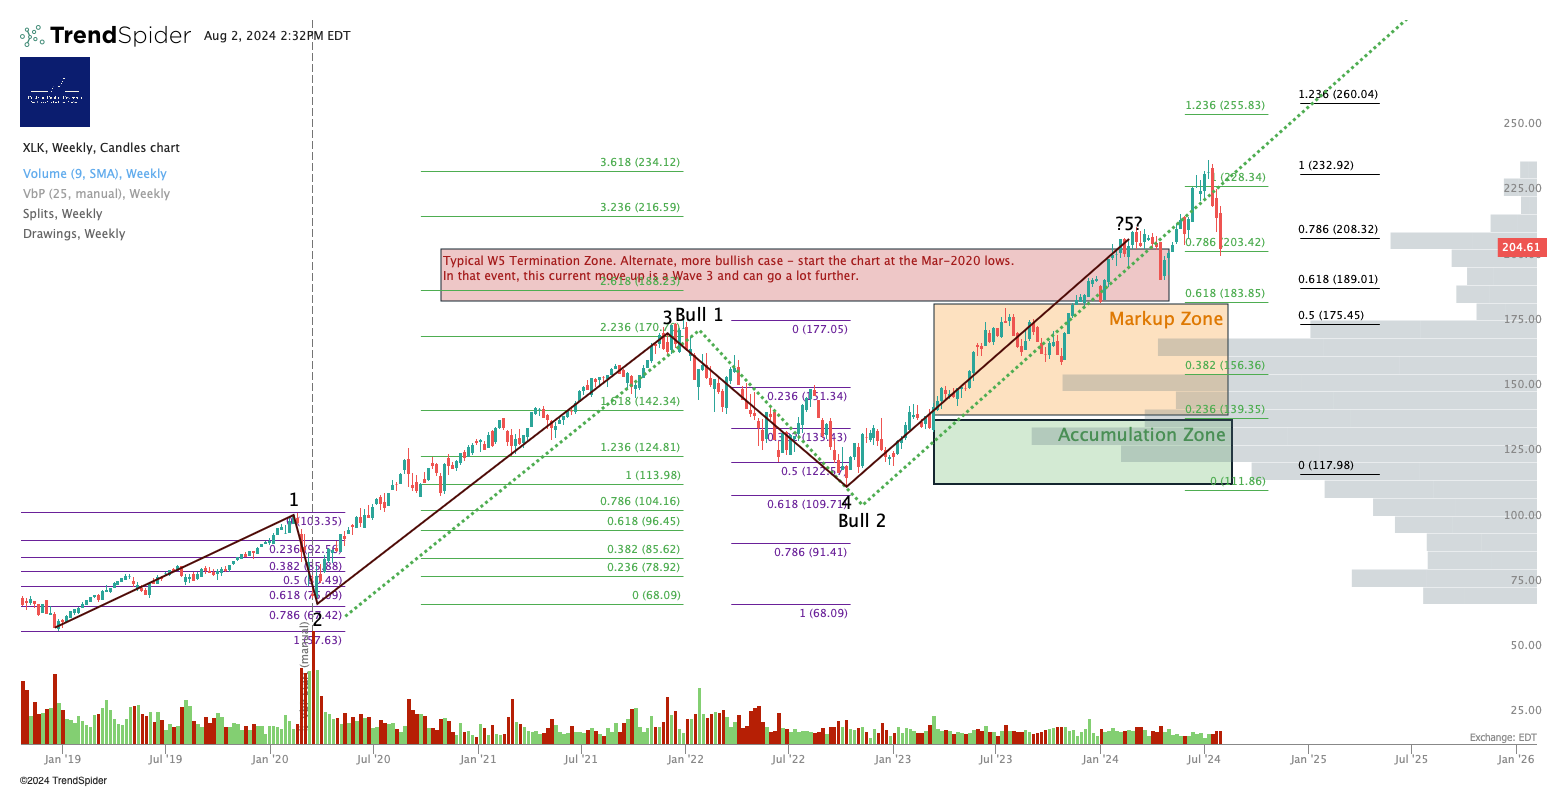
That might be a new 1,2 in the making in XLK, I’ll take a longer look later.
3x Levered Long XLK (Tech) - TECL
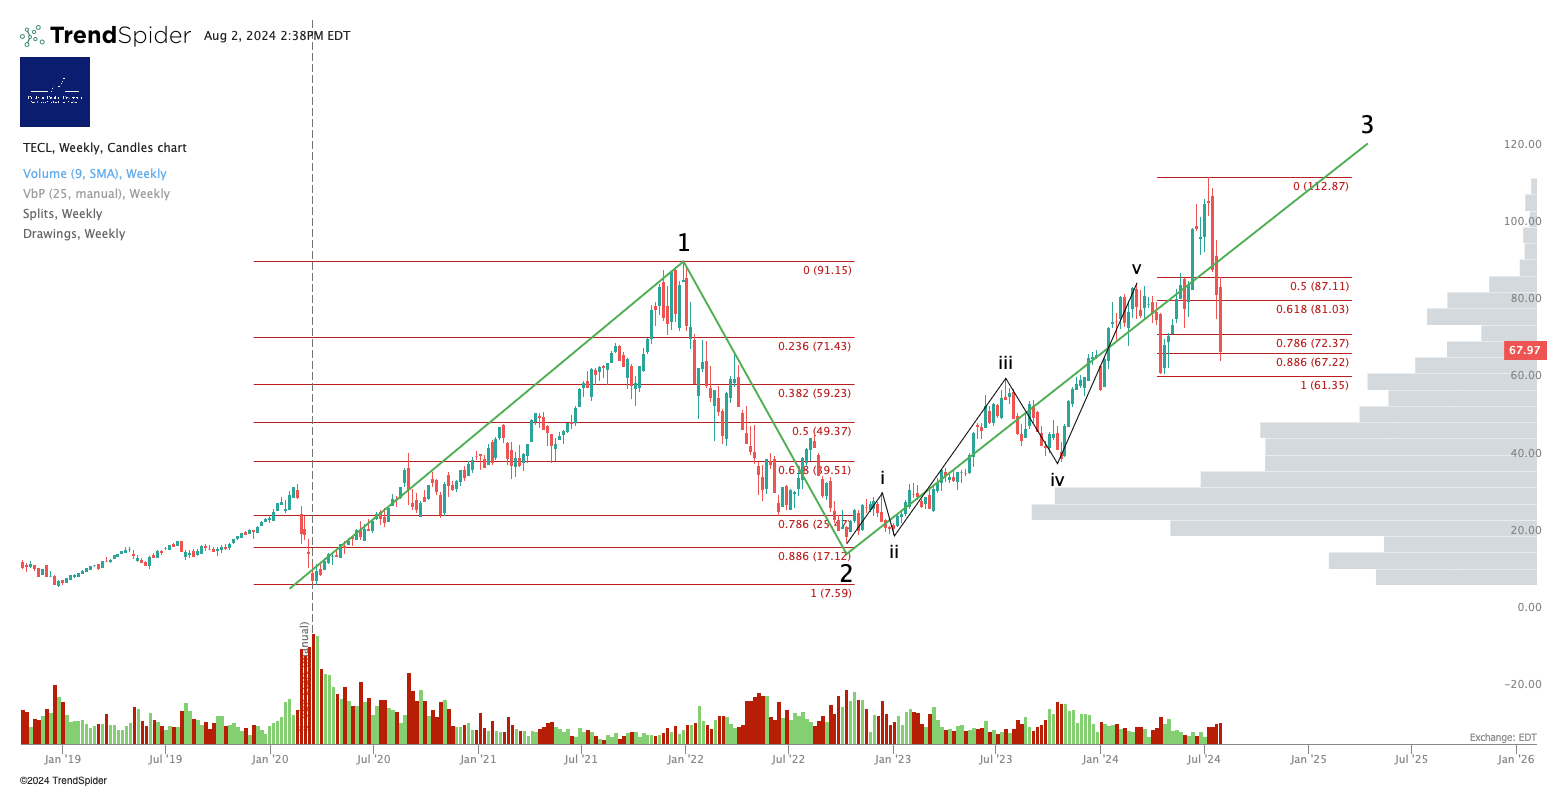
Don’t look now but this might be setting up bullish with a 1,2 at the .886.
Personal Trading Plan Disclosure: No position in TECL or TECS
SOXX (Semiconductor Sector ETF)
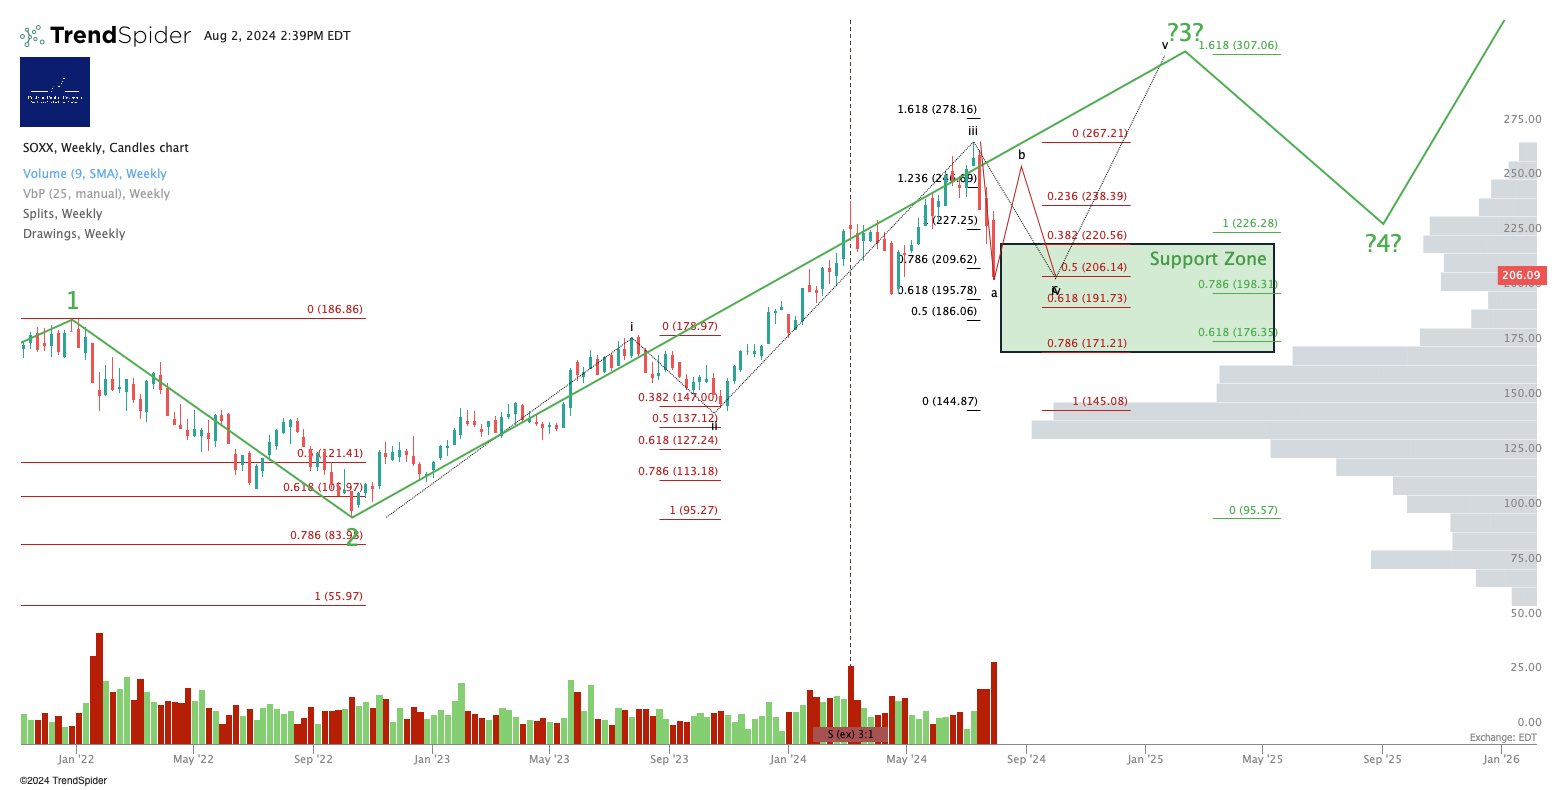
So far just a .5 retrace of a ginormo W3 up. Not a panic. Yet.
3x Levered Long SOXX (Semiconductor) - SOXL
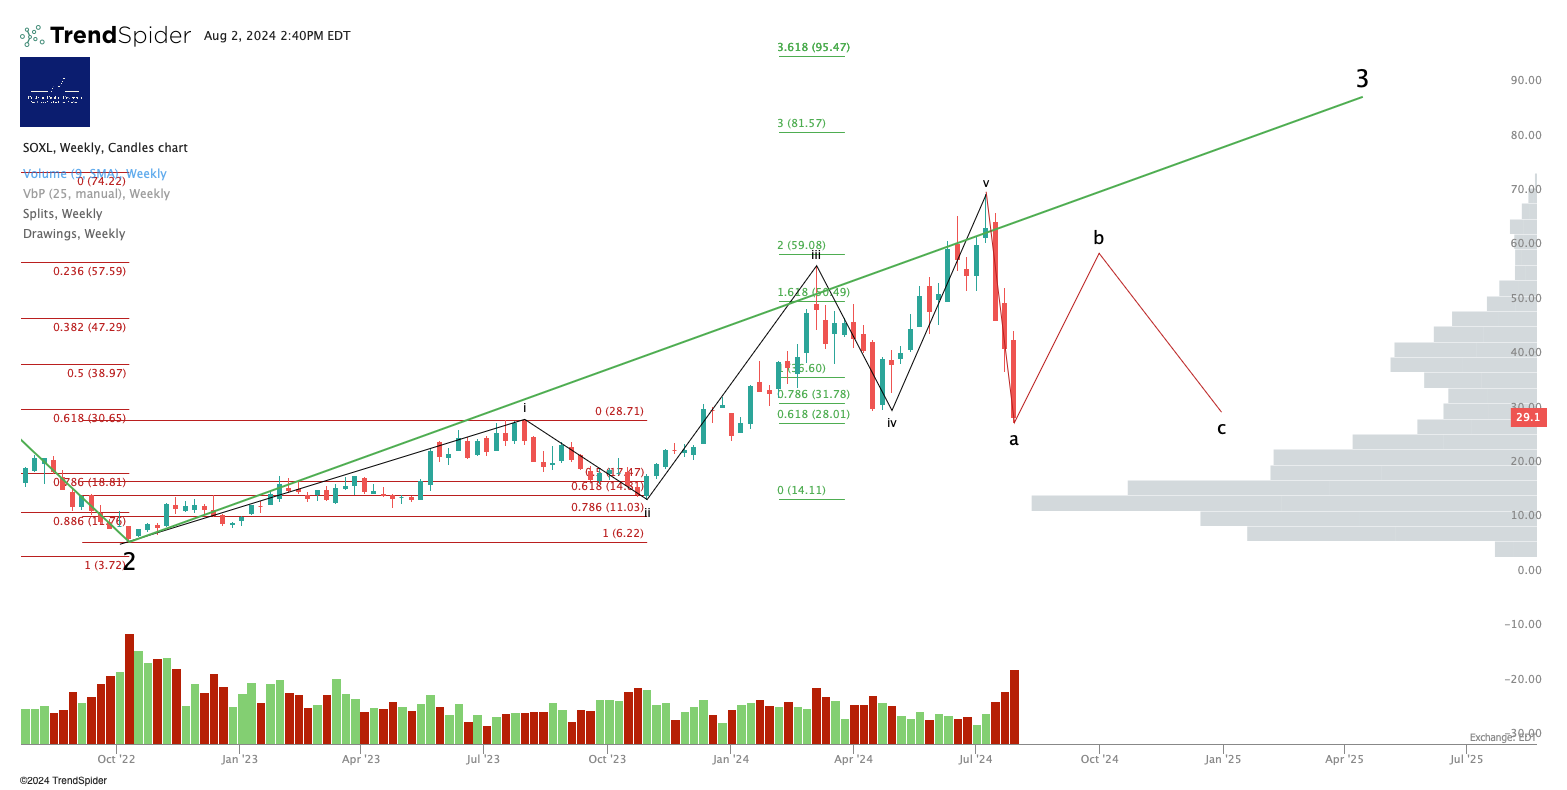
I don’t really believe this A=C; I suspect the correction in semiconductor is more or less done. Dumped a year’s worth of value!
Disclosure: I am unhedged long SOXL (having banked some SOXS gains earlier today).
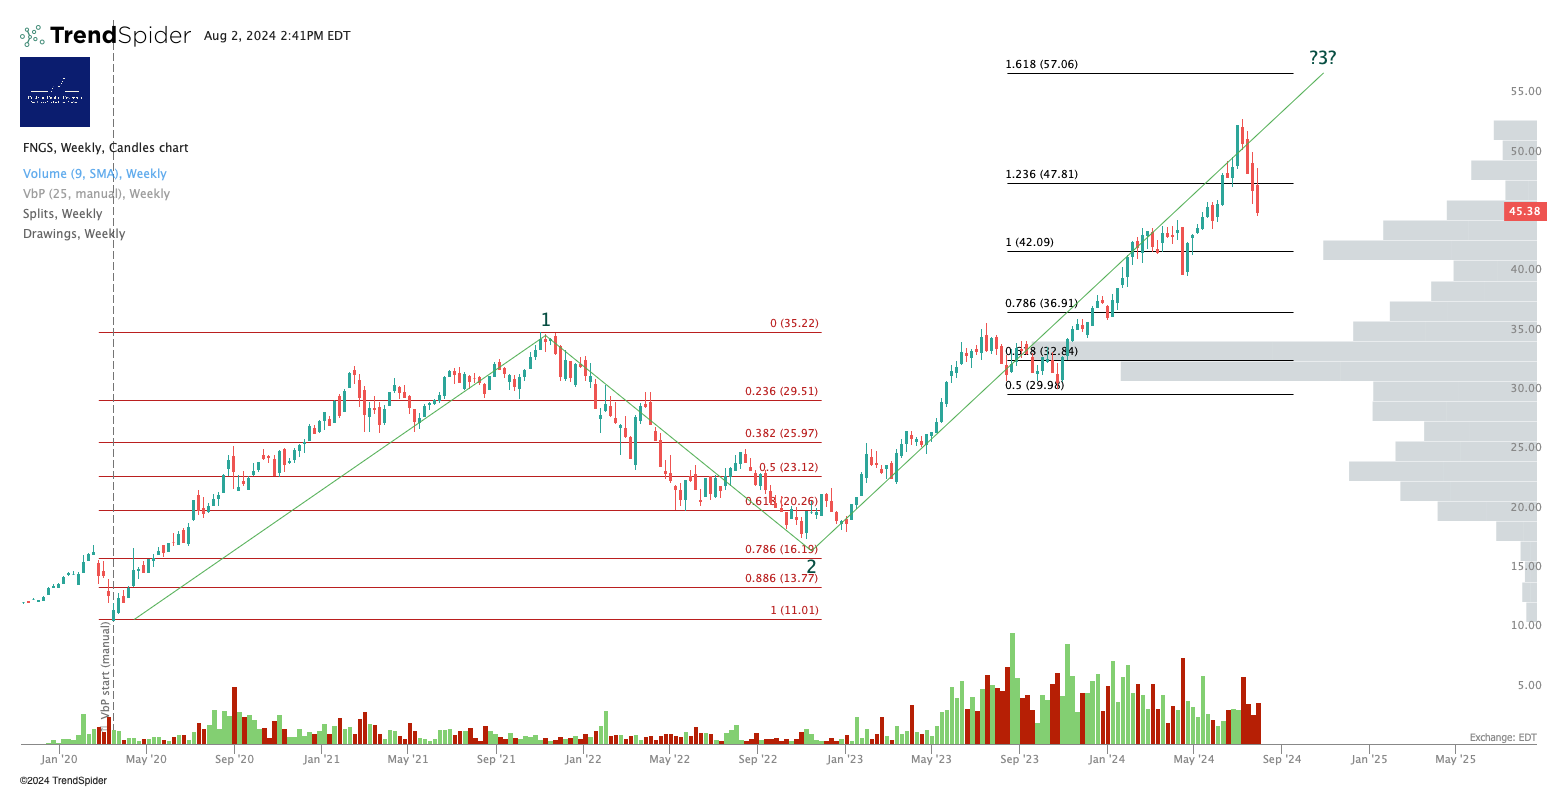
I would be surprised if $57 wasn’t hit. Not tomorrow.
3x Levered Long Megacaps - FNGU
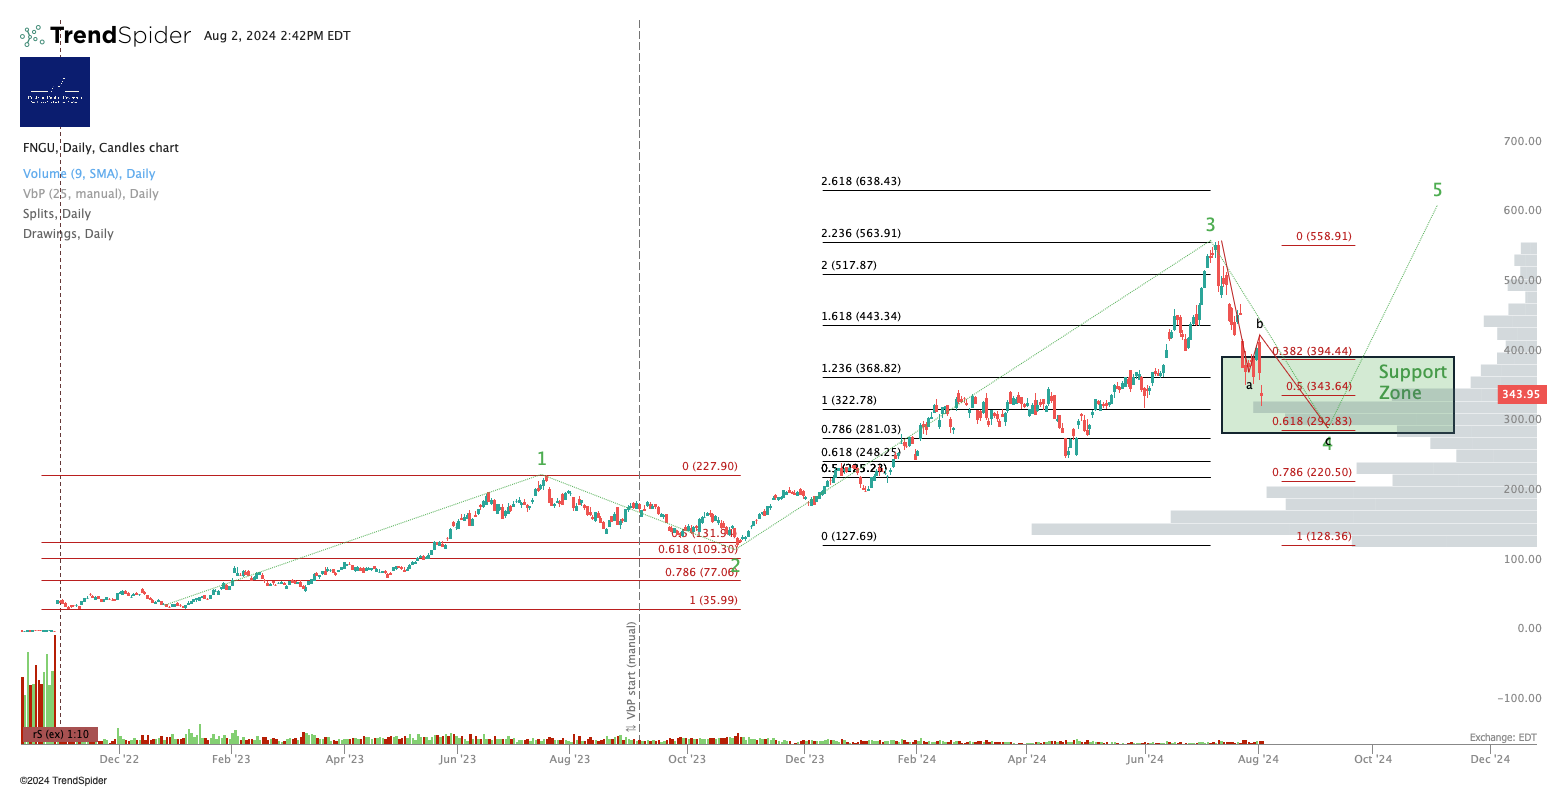
I think another bull move is in the offing - but not yet.
Disclosure: No position in FNGS, FNGU or FNGD.
Alex King, Cestrian Capital Research, Inc - 1 August 2024 DISCLOSURE - Cestrian Capital Research, Inc staff personal accounts hold long positions in, inter alia, TQQQ, QQQ3, QQQS, 3USL, 3USS, SOXL, UCO, UDOW.
