
How To Speak Market, Episode IV - Charts Speak Volumes (No Paywall)
- Volume x price analysis is a tool that can be used to help understand institutional buying and selling behavior in the stock market.
- High volumes traded while a stock is trending sideways can indicate large accounts buying or institutions selling.
- Sound boring? It’s not. It can help you understand much more about what is going on with price beneath the surface.
- Read on!
DISCLAIMER: This note is intended for US recipients only and, in particular, is not directed at, nor intended to be relied upon by any UK recipients. Any information or analysis in this note is not an offer to sell or the solicitation of an offer to buy any securities. Nothing in this note is intended to be investment advice and nor should it be relied upon to make investment decisions. Cestrian Capital Research, Inc., its employees, agents or affiliates, including the author of this note, or related persons, may have a position in any stocks, security, or financial instrument referenced in this note. Any opinions, analyses, or probabilities expressed in this note are those of the author as of the note's date of publication and are subject to change without notice. Companies referenced in this note or their employees or affiliates may be customers of Cestrian Capital Research, Inc. Cestrian Capital Research, Inc. values both its independence and transparency and does not believe that this presents a material potential conflict of interest or impacts the content of its research or publications.
How To Pick Your Node
by Alex King
Volume node, that is.
Look, here’s a small but important nugget that I’ve picked up along the way. I’ll let you into a secret - I had help. In fact I first learned the basics from Jake Wujastyk who you can find on Twitter, here. Jake can teach you all about volume shelves and their support / resistance power … this is great stuff.
In our work at Cestrian though, we use volume x price analysis to shed light on institutional buying and selling behavior. Specifically to add insight to the Wyckoff Rotation method we use. (If you missed our free, no-paywall How To Speak Market notes on Wyckoff Rotation, be sure to catch them here and here).
I’ll give you one worked example of how to use this - any questions, as always, reach out in comments below. If you want other examples, read pretty much any of the notes we post on the public side of Seeking Alpha or on our website (there is some no-paywall stuff there if you go looking).
You can use this tool in many charting applications - we use TradingView and TrendSpider in our work - by way of disclosure, we are affiliate partners of both, so if you sign up for paid services using any link we post to their sites, we may receive a referral fee. In the examples below I’ve used TrendSpider charts because I find the volume x price tool easier to use on that particular platform. Others prefer TradingView, I might add.
So, volume x price just means, how many shares were traded in a defined price range over a defined time range. That’s it. Where the judgment comes in is, was the impetus from buyers, or from sellers. If you wanted to dive deep into the rabbithole you would go looking for block sizes in which orders were placed, etc, but really you can use your intution here. High volumes traded whilst a stock is trending sideways at the lows? That’s most likely to be large accounts buying whilst retail sells. High volumes traded whilst a stock is trending sideways at the highs? Probably institutions selling whilst retail is buying. Using the charting tool of your choice, you can vary the time = zero point so you know where you are measuring from, and you can vary the breadth of the price zone (eg. all shares traded between $100-120/share, or between $100-200/share, etc).
Here’s SPY. (You can open a full page version of this chart, here).
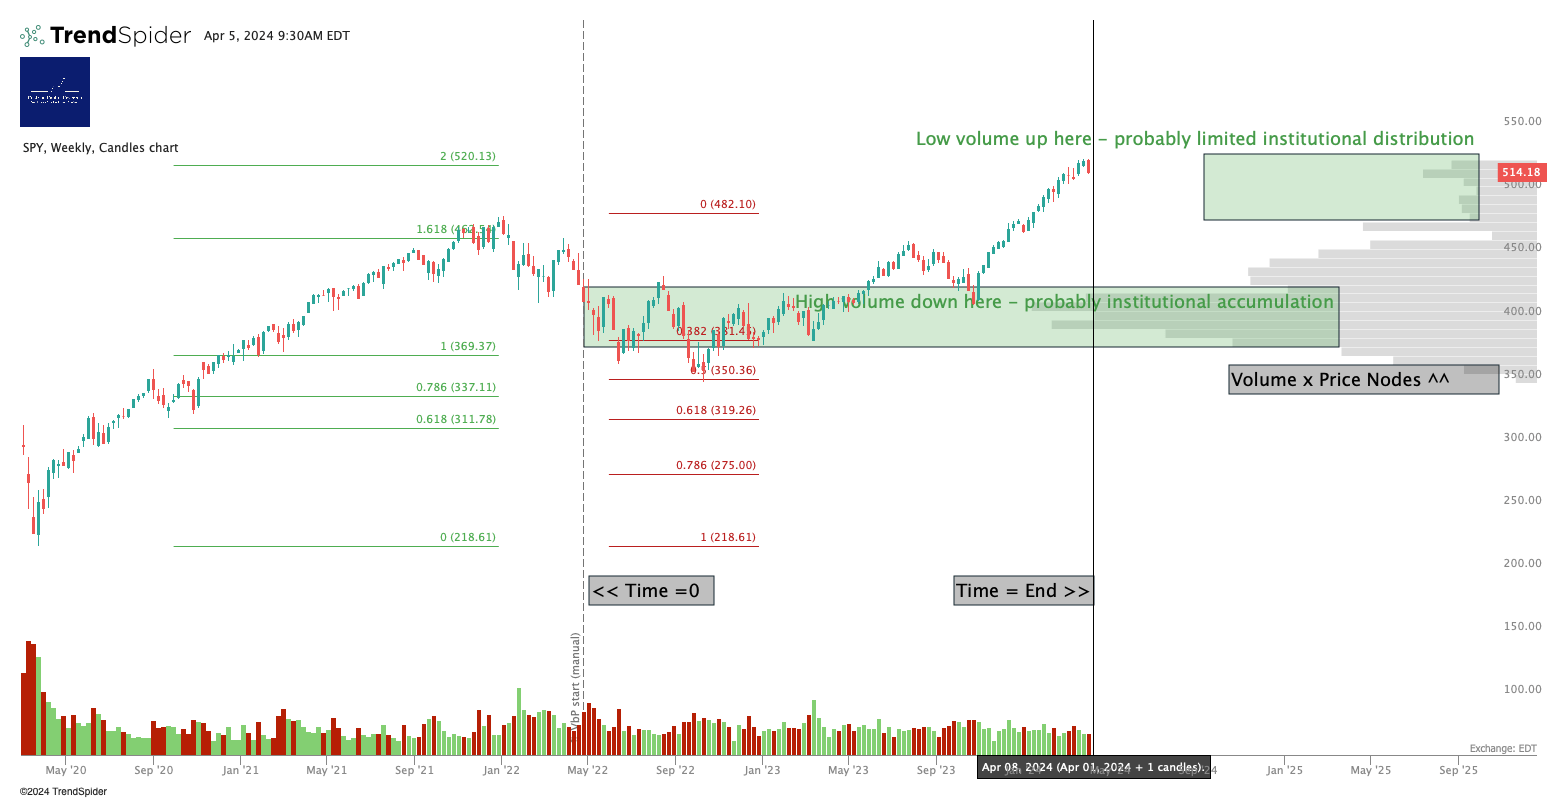
That in a nutshell is how to use volume x price analysis. It looks like SPY was being accumulated by bigs from around the end of Q1 2022 to around Q4 of 2023, with a focus of buying between $376-420/share - those are the high volume nodes you see on the right hand side.
Thus far institutions have not decided to dump SPY. There is very low volume up here at the current levels. That could change today, Monday, whatever, but right now, institutions aren’t dumping wholesale.
This looks like a boring tool, a rabbithole special, but it isn’t. Try it. See what you learn.
As always, any questions, reach out in comments below (or in Slack Chat, if you are a member of our Inner Circle service).
Cestrian Capital Research, Inc - 5 April 2024.