
How To Speak Market, Episode III - Swimming With The Tide (No Paywall)

DISCLAIMER: This note is intended for US recipients only and, in particular, is not directed at, nor intended to be relied upon by any UK recipients. Any information or analysis in this note is not an offer to sell or the solicitation of an offer to buy any securities. Nothing in this note is intended to be investment advice and nor should it be relied upon to make investment decisions. Cestrian Capital Research, Inc., its employees, agents or affiliates, including the author of this note, or related persons, may have a position in any stocks, security, or financial instrument referenced in this note. Any opinions, analyses, or probabilities expressed in this note are those of the author as of the note's date of publication and are subject to change without notice. Companies referenced in this note or their employees or affiliates may be customers of Cestrian Capital Research, Inc. Cestrian Capital Research, Inc. values both its independence and transparency and does not believe that this presents a material potential conflict of interest or impacts the content of its research or publications.
As Easy As 1-2-3 … Er, -4-5
by Alex King, CEO, Cestrian Capital Research, Inc.
Thus far in our “How To Speak Market” series, we’ve covered the following:
- Background And Introduction - “Is The Market Rigged?"
- Episode I - “How Big Money Creates Returns Out Of Thin Air”
- Episode II - “How To Measure Emotion”
If you missed them, read them before this note - it will help you understand what follows below. They’re not long notes and they aren’t difficult to understand (but if you do have questions, just ask them in the comments field to each note).
Today we turn to Episode III, being, How To Swim With The Tide.
Now, first of all I should say that there are about as many technical analysis methods as there are technical analysis geniuses on FinTwit, which is to say, a lot. And most all of them are trying to achieve the same thing, which is to identify the dominant trend (up or down) over the timeframe of interest (minutes, hours, days, weeks, months, quarters, years); and having hopefully identified the dominant direction, try to spot when this direction may change.
The key with technical analysis is simply to find a method that you understand and that you find works for you. There isn’t a holy grail, no One Ring To Rule Them All, it doesn’t work like that. Securities markets are complex systems that appear to work at random, but don’t; they have some patterns in them and if you can find a method that helps you identify and then act on patterns you see forming, you are likely to be able to improve your investing and trading.
The method we favor here at Cestrian is the combination of:
- Elliott Wave counts and
- Fibonacci Retracement and Extension measurements and
- Wyckoff Rotation volume x price analysis
Pretty much all our work uses these three elements of technical analysis. The articles above talk about Fibonacci levels and Wyckoff Rotation - now I want to turn to Elliott Wave counts.
Beyond Certainty
You can read for weeks, months about the securities analysis system developed by R.N. Elliott in the 1930s. If it’s new to you, this Wikipedia article is pretty good. If you want to read more, a short book by John Burford, Tramline Trading, also has a nice introduction to Elliott Wave analysis. For the mother lode, head to Frost & Prechter, Elliott Wave Principle.
Me? I don’t think that the answer to Life, The Universe And Everything lies in self-repeating patterns on a stock chart. I don’t believe that the “rules” of wave analysis are much use when applied in a hard & fast way. I think that securities markets are more complex than that and I don’t think there is a perfect method that will ever be found to navigate them. I myself don’t bother using most of the “rules” of Elliott Wave, because they are too hard (my view!) and too much time is spent trying to bend reality to force price action into a rule.
But I do think that the basic tenets of Elliott Wave analysis are pretty good. In my experience they work best with highly liquid stocks and ETFs. The more out-there and/or lower-volume the stock or ETF, the less reliable the Wave method. That’s because all you are doing with wave counts is measuring the ebb and flow of the mood of the crowd. If there was such a thing as Throng Psychology or Small Buncha Friends Psychology then we would know about it. Crowd Psychology on the other hand, is a thing, and that’s what Elliott Wave seeks to help you with.
Here’s my method. It’s a baby version of how you are supposed to do it, but it works for me.
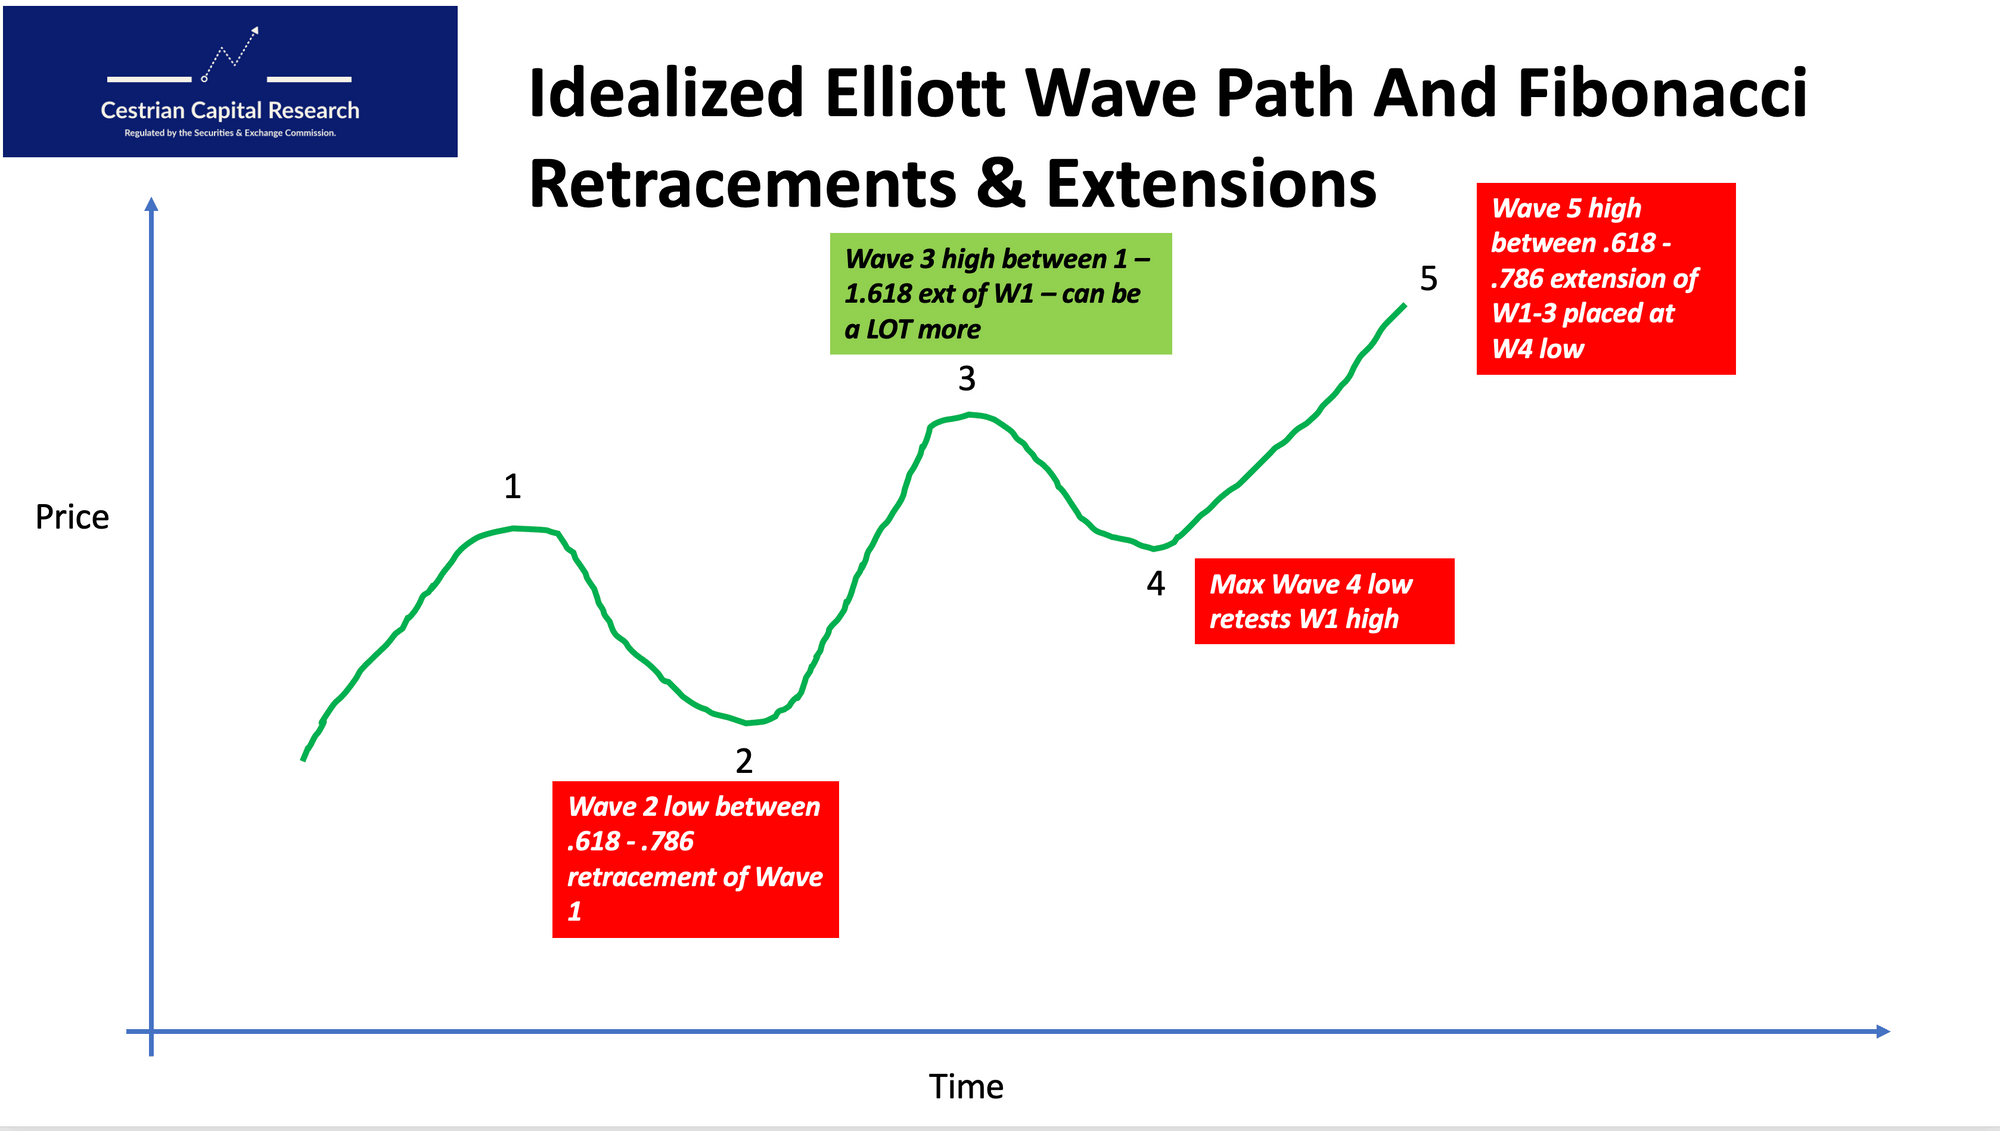
In a bull market (when the dominant trend is up), stocks and ETFs do seem to move up in five waves.
- Wave One - up. Happy.
- Wave Two - down. DEEP regret. Can shed almost all the value created in Wave One. And quickly too.
- Wave Three - up. Confirmed happy leading to VERY HAPPY. Can carry on much longer than you ‘feel’ it can.
- Wave Four - down. Usually a slow selloff and not to such a drastic % drop as Wave Two.
- Wave Five - up. The last hurrah before remorse sets in.
Then comes the correction. In this same bull market, corrective moves often happen in three waves.
- Wave A - down.
- Wave B - up. Very dangerous. Can convince you that the up-trend is back. Whereas what is about to happen is -
- Wave C - down.
Charting The Ebbs And Flows
We talked last week about measuring emotion. Well, emotion here is very simply the amplitude - the share price change - between the top and bottom of each wave. You measure the change using %ages, not dollars, and you would be surprised at how often those changes correspond to important Fibonacci levels. (Told you to read the earlier notes first. Last week's note deals with Fibonaccis. Not as difficult as it sounds. Read it here).
Here's an idealized 5-wave up-move.
The A-B-C correction that can follow a 5-wave up move may look like this (you can open a full page version of this chart, here):
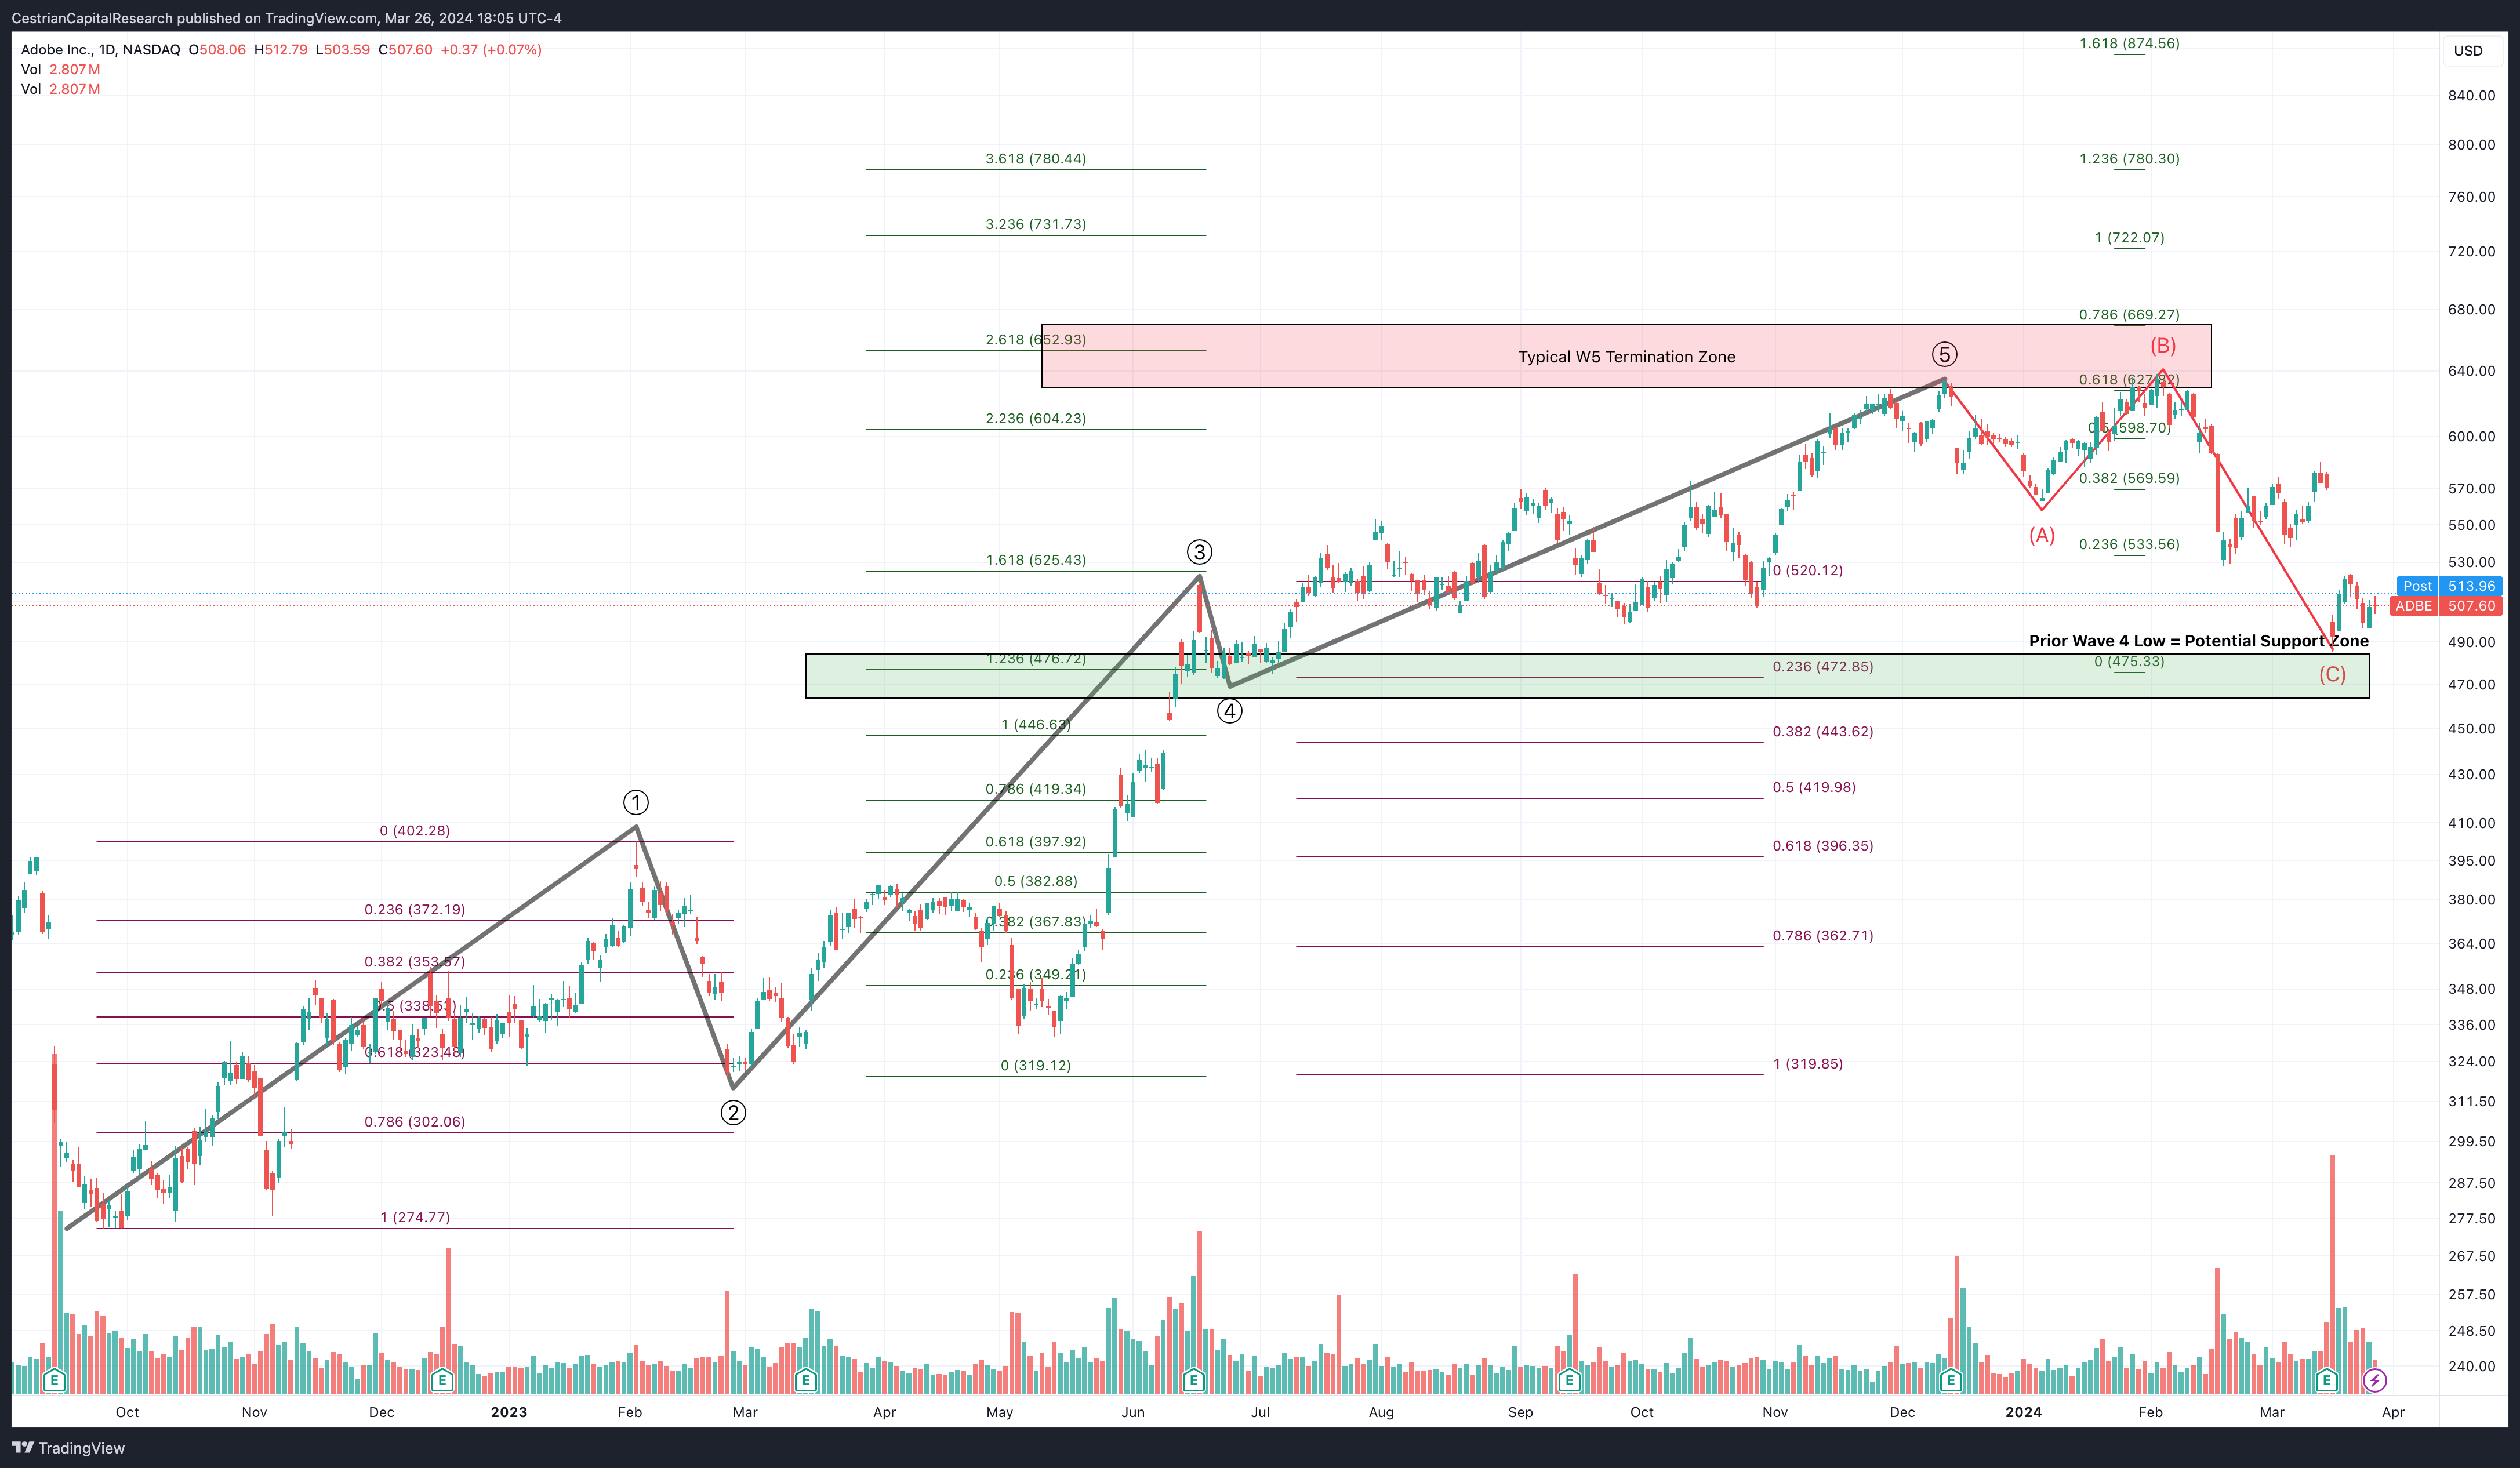
The 5-wave up cycle in ADBE tracks to Fibonacci levels quite well. The A-B-C correction that follows that Wave 5 high is brutal - it fakes out longs by trying to convince them that the B-wave is a new bull phase, then dumps to around a C = 2A level before finding support. (This B-wave fakeout is a key key learning from Elliott Wave analysis - it will save you time and time again in my experience).
Practice Makes ... Less Imperfect
You can't ever master technical analysis, because the subject is too complex and dynamic. But you can get better at it over time. People who use the Elliott Wave / Fibonacci system will tell you that there is no subject for miles on the road to improve your skills. Learn the patterns and you can find much better times to enter and exit stocks or ETFs than simple buy-and-hold can offer you.
If you'd like to see this system in action, just read more of our work. And if you want to know more about how we use it, just ask!
Cestrian Capital Research, Inc - 26 March 2024.