
How To Speak Market, Episode II - Measuring Emotion (No Paywall)

DISCLAIMER: This note is intended for US recipients only and, in particular, is not directed at, nor intended to be relied upon by any UK recipients. Any information or analysis in this note is not an offer to sell or the solicitation of an offer to buy any securities. Nothing in this note is intended to be investment advice and nor should it be relied upon to make investment decisions. Cestrian Capital Research, Inc., its employees, agents or affiliates, including the author of this note, or related persons, may have a position in any stocks, security, or financial instrument referenced in this note. Any opinions, analyses, or probabilities expressed in this note are those of the author as of the note's date of publication and are subject to change without notice. Companies referenced in this note or their employees or affiliates may be customers of Cestrian Capital Research, Inc. Cestrian Capital Research, Inc. values both its independence and transparency and does not believe that this presents a material potential conflict of interest or impacts the content of its research or publications.
Dead Inside
by Alex King, CEO, Cestrian Capital Research, Inc
Two weeks ago here in the Free tier of our Growth Investor Pro service we said we would post a note every week detailing How To Speak Market. If you missed it, read our backgrounder, "Is The Market Rigged?", here.
Last week we covered Wyckoff Rotation, otherwise known as How Big Money Creates Returns Out Of Thin Air. You can catch up with that one, here.
Today we will cover How To Measure Emotion. The idea with this series by the way is that we hope to break down that fearsome subject - technical analysis - into easy pieces that anyone sensible can understand. You can properly disappear into a rabbithole on this topic if you want to, but we believe the best and most effective technical analysis (the language of the market) is simple to understand and simple to carry out. Like any language, you will improve with practice and you shouldn't expect to be fluent right out of the gate. But you can use our notes to get started or indeed to tune up any previous half-completed studies you may have put in.
If we can give you one motto as you continue your journey towards speaking fluent market? It is - be dead inside. This isn't the real world you are dealing with, not humans or animals or anything else with a heartbeat and feelings and so forth. It's just numbers. Number go up, number go down. If you are long and number go up, good, if number go down, bad. If you are short and number go up, bad, if number go down, good. That really is the extent to which you should be emotionally engaged with public stock investments. Nvidia stock doesn't know who you are and doesn't care whether it buys you a new house on 17 Mile Drive or costs you a repossession on your existing home, leading to divorce and your children having to eat scraps under the 101 for three years. It won't notice. Stocks are sociopathic in nature and so should you be when engaging with them.
Emotion Drives Price
If you can attain truly dead-inside status you can soon learn to take advantage of others' emotions. Steps to this higher state of consciousness can include:
- Not being overinvested; if you have plenty of cash on hand vs. your securities allocation, your stress levels will be lower.
- Not owning too much weird stuff; the further you stray from the S&P500 the higher your stress levels will get.
- Not owning too much stuff with factors other than price involved. The further you get from common stocks or simple unlevered ETFs, the higher your stress levels will be. In particular you might think hard about the use of options (higher stress) vs. common stocks (lower stress).
When you are at Zen Master grade or at least approaching it, this is a wonderful time to start using technical analysis, the language of markets, in the wild.
Because earnings don't drive price. Inflation doesn't drive price. Interest rates don't drive price. Emotion drives price. Specifically, induced emotion. Fear and greed aren't created independently of price. The price action that institutional behavior creates in the market - you really should read last week's note on Wyckoff Rotation if you missed it - induces emotional reactions in (1) momentum funds, whose job it is to chase trends up and down and (2) retail investors, who typically jump in towards the end of trends. You can expect retail to be buying at the highs and selling at the lows. If you teach yourself to spot emotional patterns in markets then the first measure of success is you ought to not get sucked into the same set of induced emotions as the rest of the crowd. Instead you should be able to see the gathering wave of bullishness or bearishness and play it accordingly.
You Can Measure Emotion
No, I don't mean using DSM-IV or some other tome of questionable validity. I mean you can measure the extent of bullish or bearish emotion expressed in any liquid security. This measure doesn't work so well with microcaps or other low-volume stocks but with the indices, index ETFs, the big names, your Apples, Microsofts, Nvidias, Adobes and so on? Works a treat.
The measure is called the Fibonacci level. This is a technical system that people like to spend a lot of time convincing others that it is too difficult and deep for them to use. The mysteries of the universal constant .618 and all that. Well, you can ignore all that gumbo. It is pretty interesting down there in the rabbithole, if you like rabbitholes, which I do, but it's not necessary to spend time there if all you want to do is make money from other people's emotion whilst you yourself remain dead inside.
Here's the basics. I'm going to use a bull market as the context. Up is the dominant direction and down is the countertrend. Most of the time the market is in a bull mode; bear markets come along every so often but they are the exception not the rule.
- A Fibonacci extension measures a move to the upside
- A Fibonacci retracement measure a move to the downside
Here's the only difficult thing to understand about Fibonacci levels. They measure price movements relative to previous price movements. In other words, if stock X goes from 100 to 500, the subsequent selloff - the retracement - is measured as a % of that 100 - 500 move. And a future run-up will be measured as an extension of a previous run-up. In other words there is nothing fundamental you are measuring with Fibonacci levels. You are just measuring an emotional reaction in one direction relative to the last emotional reaction in the opposite reaction. That's it.
Here's a worked example. This is a real chart - it's a medium-term chart of Adobe common stock - I'm using it because it corresponds almost to the dollar to the textbook way in which Fibonacci extensions and retracements are supposed to work. And what that means is, to me at least, that ADBE stock is traded institutionally according to the Language Of Stocks. And what that means is that, in the future, it may very well be trade according to the same principles, and what that means is that the predictability of ADBE stock price movements will be a little bit better than just, I Haven't A Scooby's, which is if we are all honest is the baseline level of predictability of stock price movements.
You can open a full page version of this chart, here.
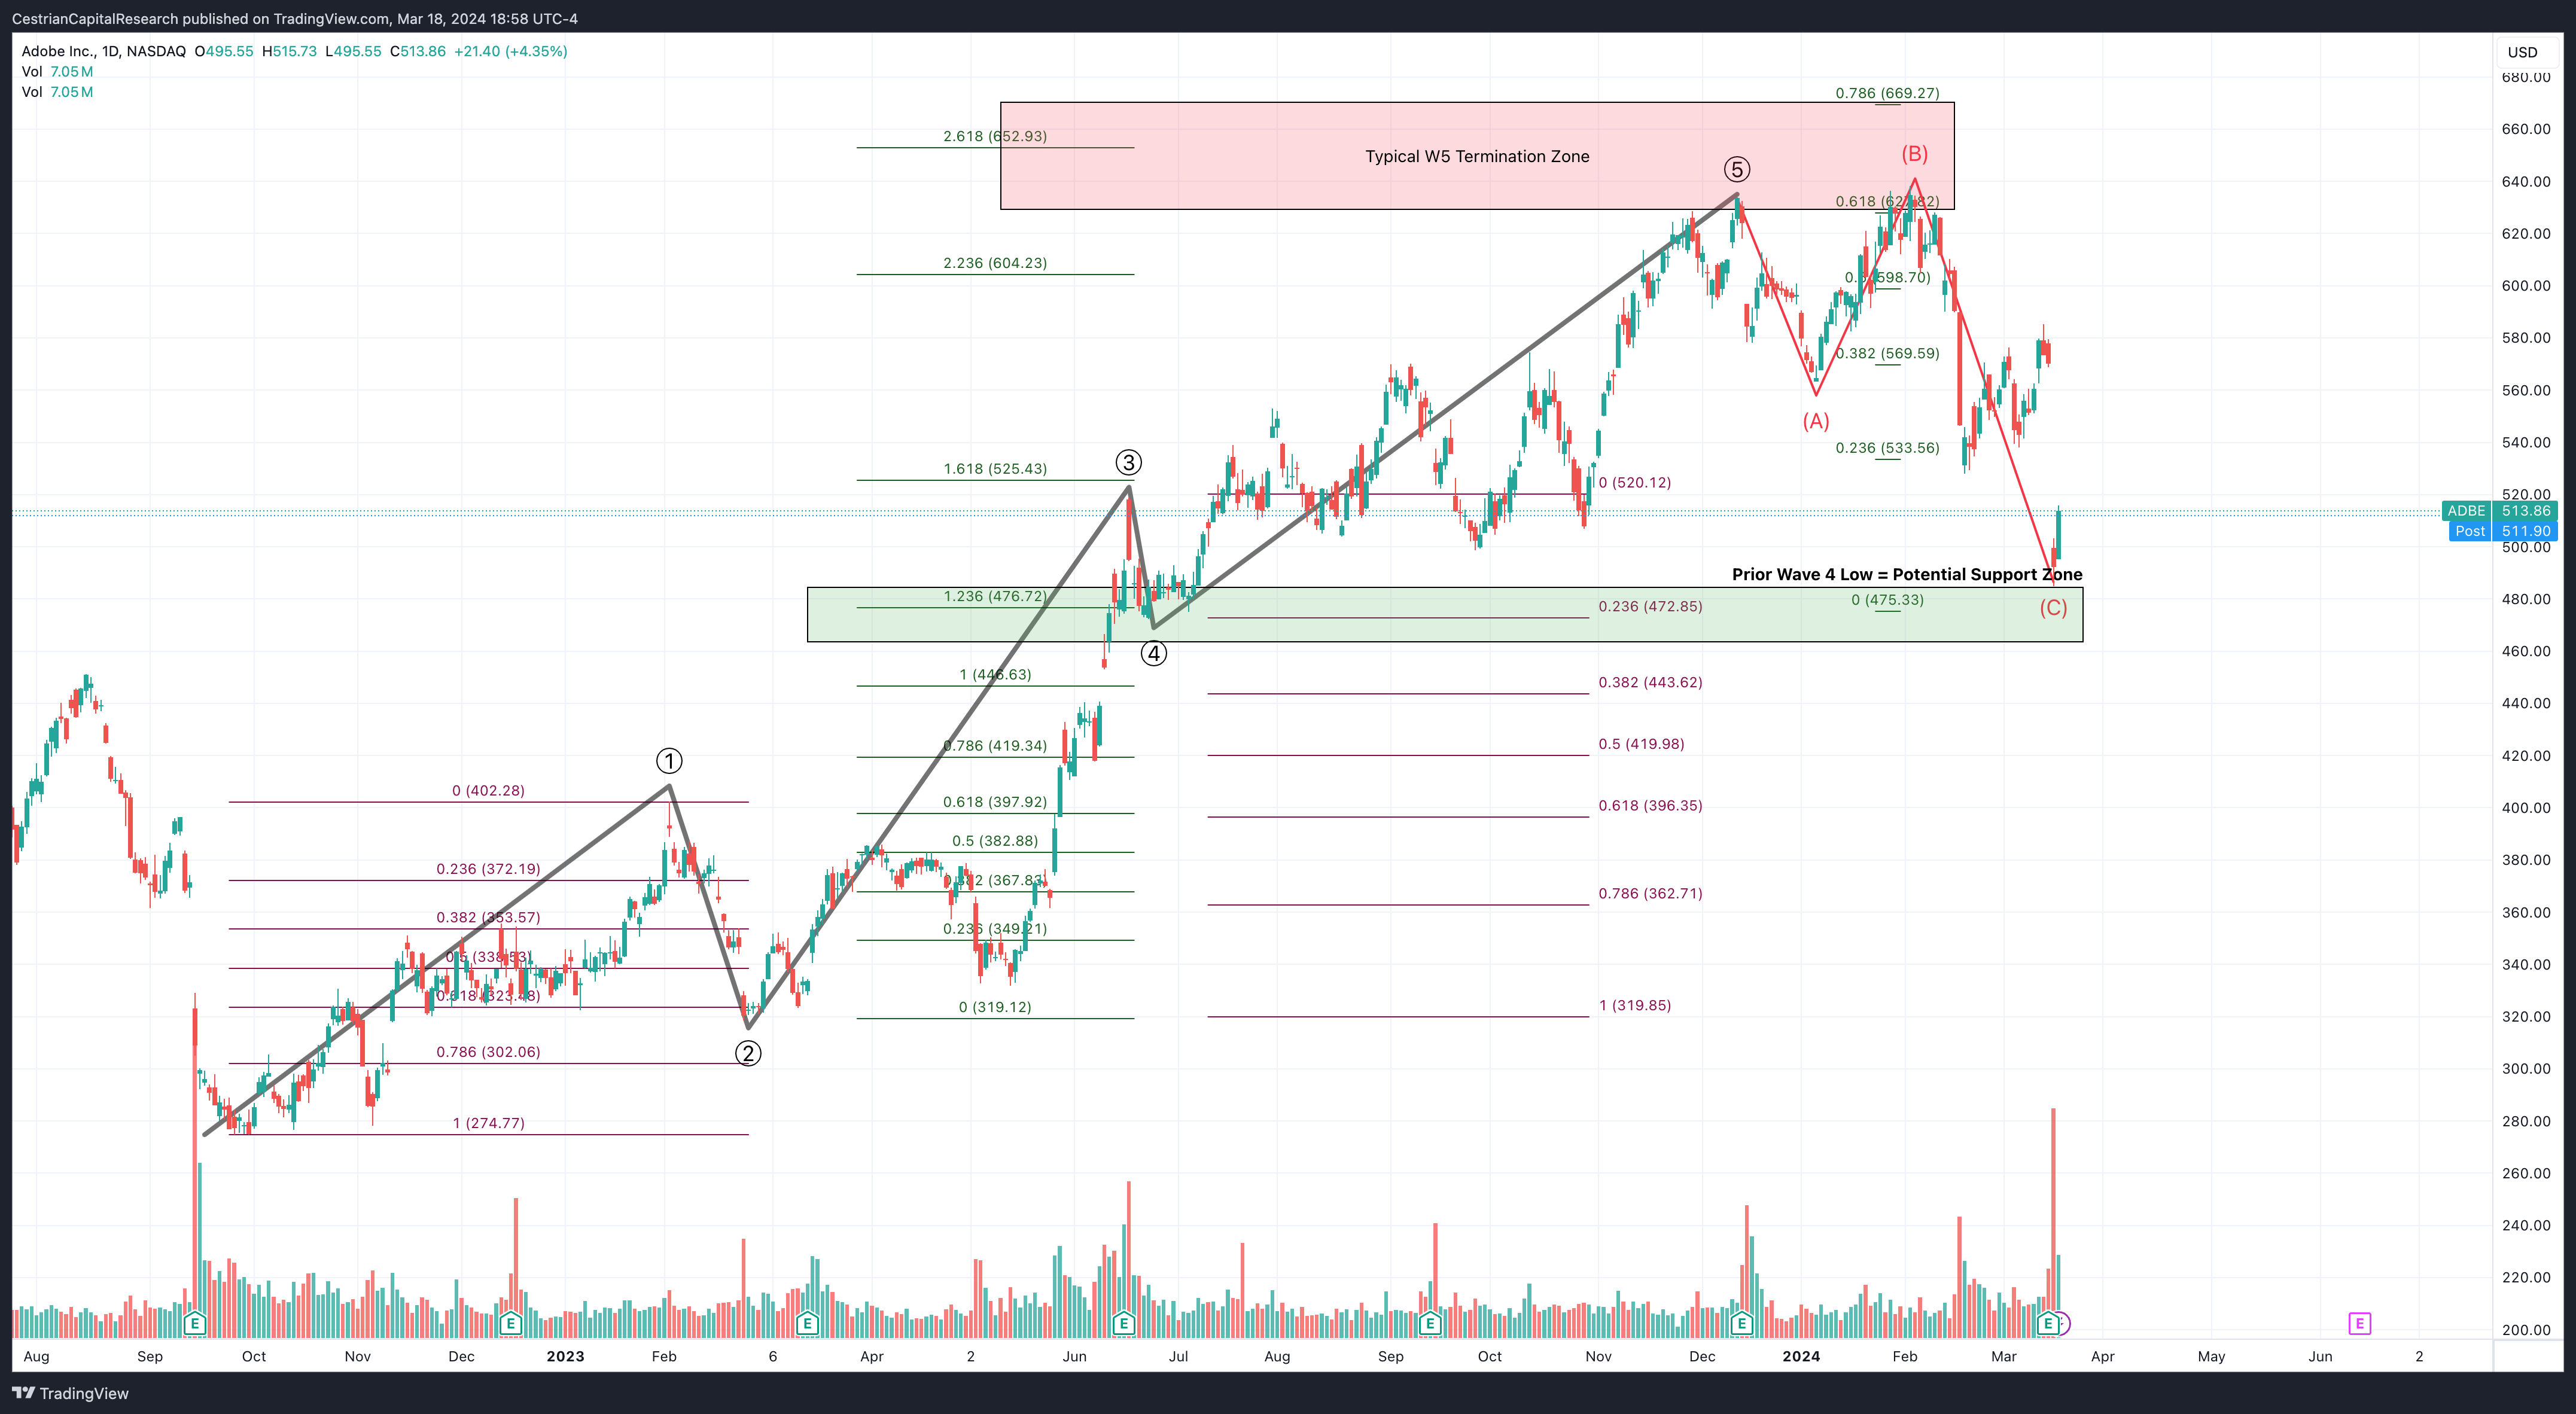
We'll get to Elliott Waves next week by the way. For now, look at the red ladders (retracements - down-moves) and the green ladders (extensions - up-moves).
What comes next involves numbers. If you want to speak market, these numbers matter. Don't glaze over. Read 'em. They're important. They're also not difficult, though most everyone will tell you they are.
Here's how this chart moves.
- Trade Point Zero is at the 2022 bear market lows in September; the stock was at $275.
- Wave 1 terminates at $402 in early February 2023, a $127/share move. And NOW we can start to measure emotion.
- The Wave 2 selloff hits the .618 Fibonacci retracement level before it finds support. That means that the stock gives up around 62% of all the value created in that Wave 1 up, finding support at around $319 in early March 2023. Now, a .618 retracement is an absolutely standard Wave 2 low. Sometimes they hit the .786 retracement (surrendering a little under 80% of value created in the Wave 1 up), sometimes a real dump can deliver a .886 retracement - ie. nearly a 90% drop.
- Wave 3 terminates at the 1.618 extension of the prior Wave 1 placed at the Wave 2 low. Sounds difficult, isn't. Take the share price change in Wave 1 - that's $127/share, multiply by 1.618, add to the Wave 2 low, there's your Wave 3 high. Now, a 1.618 Wave 3 extension is an absolutely standard Wave 3. You can set your watch by it more often than you might think.
- Wave 4 is a shallow selloff, down to the .236 retracement of Wave 3, in other words, the selloff in June 2023 sees the stock surrender a little under a quarter of the value created in that Wave 3 up.
- Wave 5 terminates between the .618 - .786 extension of the prior Waves 1-3, placed at the Wave 4 low. Again, sounds difficult, isn't. Measure the share price change from Trade Point Zero to the top of Wave 3. Multiply by .618. Add to the share price at the Wave 4 low. That's the low end of your typical Wave 5 termination zone. And the high end of the zone can be measured by multiplying that same share price change by .786. You would be surprised how often this termination zone measure proves righteous.
So, now you can measure emotion. Easy. You are no longer guessing but instead you have some yardsticks.
Big selloff - usually a Wave 2, somewhere between the .618-.886 retrace of the prior Wave 1
Big run up - usually a Wave 3, somewhere between the 100% - 161.8% extension of the prior Wave 1 placed at the Wave 2 low - but don't be surprised to see these big Wave 3 moves hit the 2.618, 3.618, sometimes even bigger multiples. META just put in a 5.618 extension!.
More modest selloff - usually a Wave 4, somewhere between a .236 (that's rare btw) and a .618 retrace; a .382 - .5 is common.
Final move up before a tougher correction - usually a Wave 5, termination zone between the .618 - .786 extension of the prior Waves 1-3 placed at the Wave 4 low.
Righto. Going to leave it there for today. Next week we'll talk about what the Waves mean, and we'll talk about that A-B-C correction you see on the ADBE chart above, too.
As always any questions, reach out in comments below.
Cestrian Capital Research, Inc - 19 March 2024.