
How Big Money Creates Returns Out Of Thin Air (No Paywall)
DISCLAIMER: This note is intended for US recipients only and, in particular, is not directed at, nor intended to be relied upon by any UK recipients. Any information or analysis in this note is not an offer to sell or the solicitation of an offer to buy any securities. Nothing in this note is intended to be investment advice and nor should it be relied upon to make investment decisions. Cestrian Capital Research, Inc., its employees, agents or affiliates, including the author of this note, or related persons, may have a position in any stocks, security, or financial instrument referenced in this note. Any opinions, analyses, or probabilities expressed in this note are those of the author as of the note's date of publication and are subject to change without notice. Companies referenced in this note or their employees or affiliates may be customers of Cestrian Capital Research, Inc. Cestrian Capital Research, Inc. values both its independence and transparency and does not believe that this presents a material potential conflict of interest or impacts the content of its research or publications.
Learn To Speak Market, Episode I
by Alex King, CEO, Cestrian Capital Research, Inc
Last week in our note, "Is The Market Rigged" (you can read that here), we said that over the coming weeks we would be laying out a series of notes explaining How To Speak Market. The notion being, price patterns in the liquid stocks, indices and ETFs are something of a lingua franca spoken by all manner of market participants regardless of origin. Learning to speak this common language is, in my view, a critical step to raising your game as an investor and/or trader. And when I refer specifically to price patterns, I mean stock charts.
Why Fundamentals Aren't Enough
A little background. My own personal background is as an institutional investor; specifically in venture capital and, later, leveraged buyouts. These two disciplines are primarily fundamentalist in nature. Venture capital-backed companies are measured largely in terms of revenue growth vs. capital consumed; leveraged buyouts largely in terms of revenue growth, cashflow growth, and optimization of the debt/equity mix on the balance sheet. Anyone who works for long enough in these disciplines is likely to pick up a pretty good working knowledge of fundamental analysis. And fundamental analysis is a useful tool in the kitbox when it comes to analyzing public stocks too. At extremes, fundamental valuation analysis can give you fairly good insights into when stocks are relatively cheap or relatively expensive. When Meta Platforms (META) was trading at 7.4x trailing twelve-month unlevered pretax free cashflow in 2022 - that was fundamentally cheap, and we said so, here.
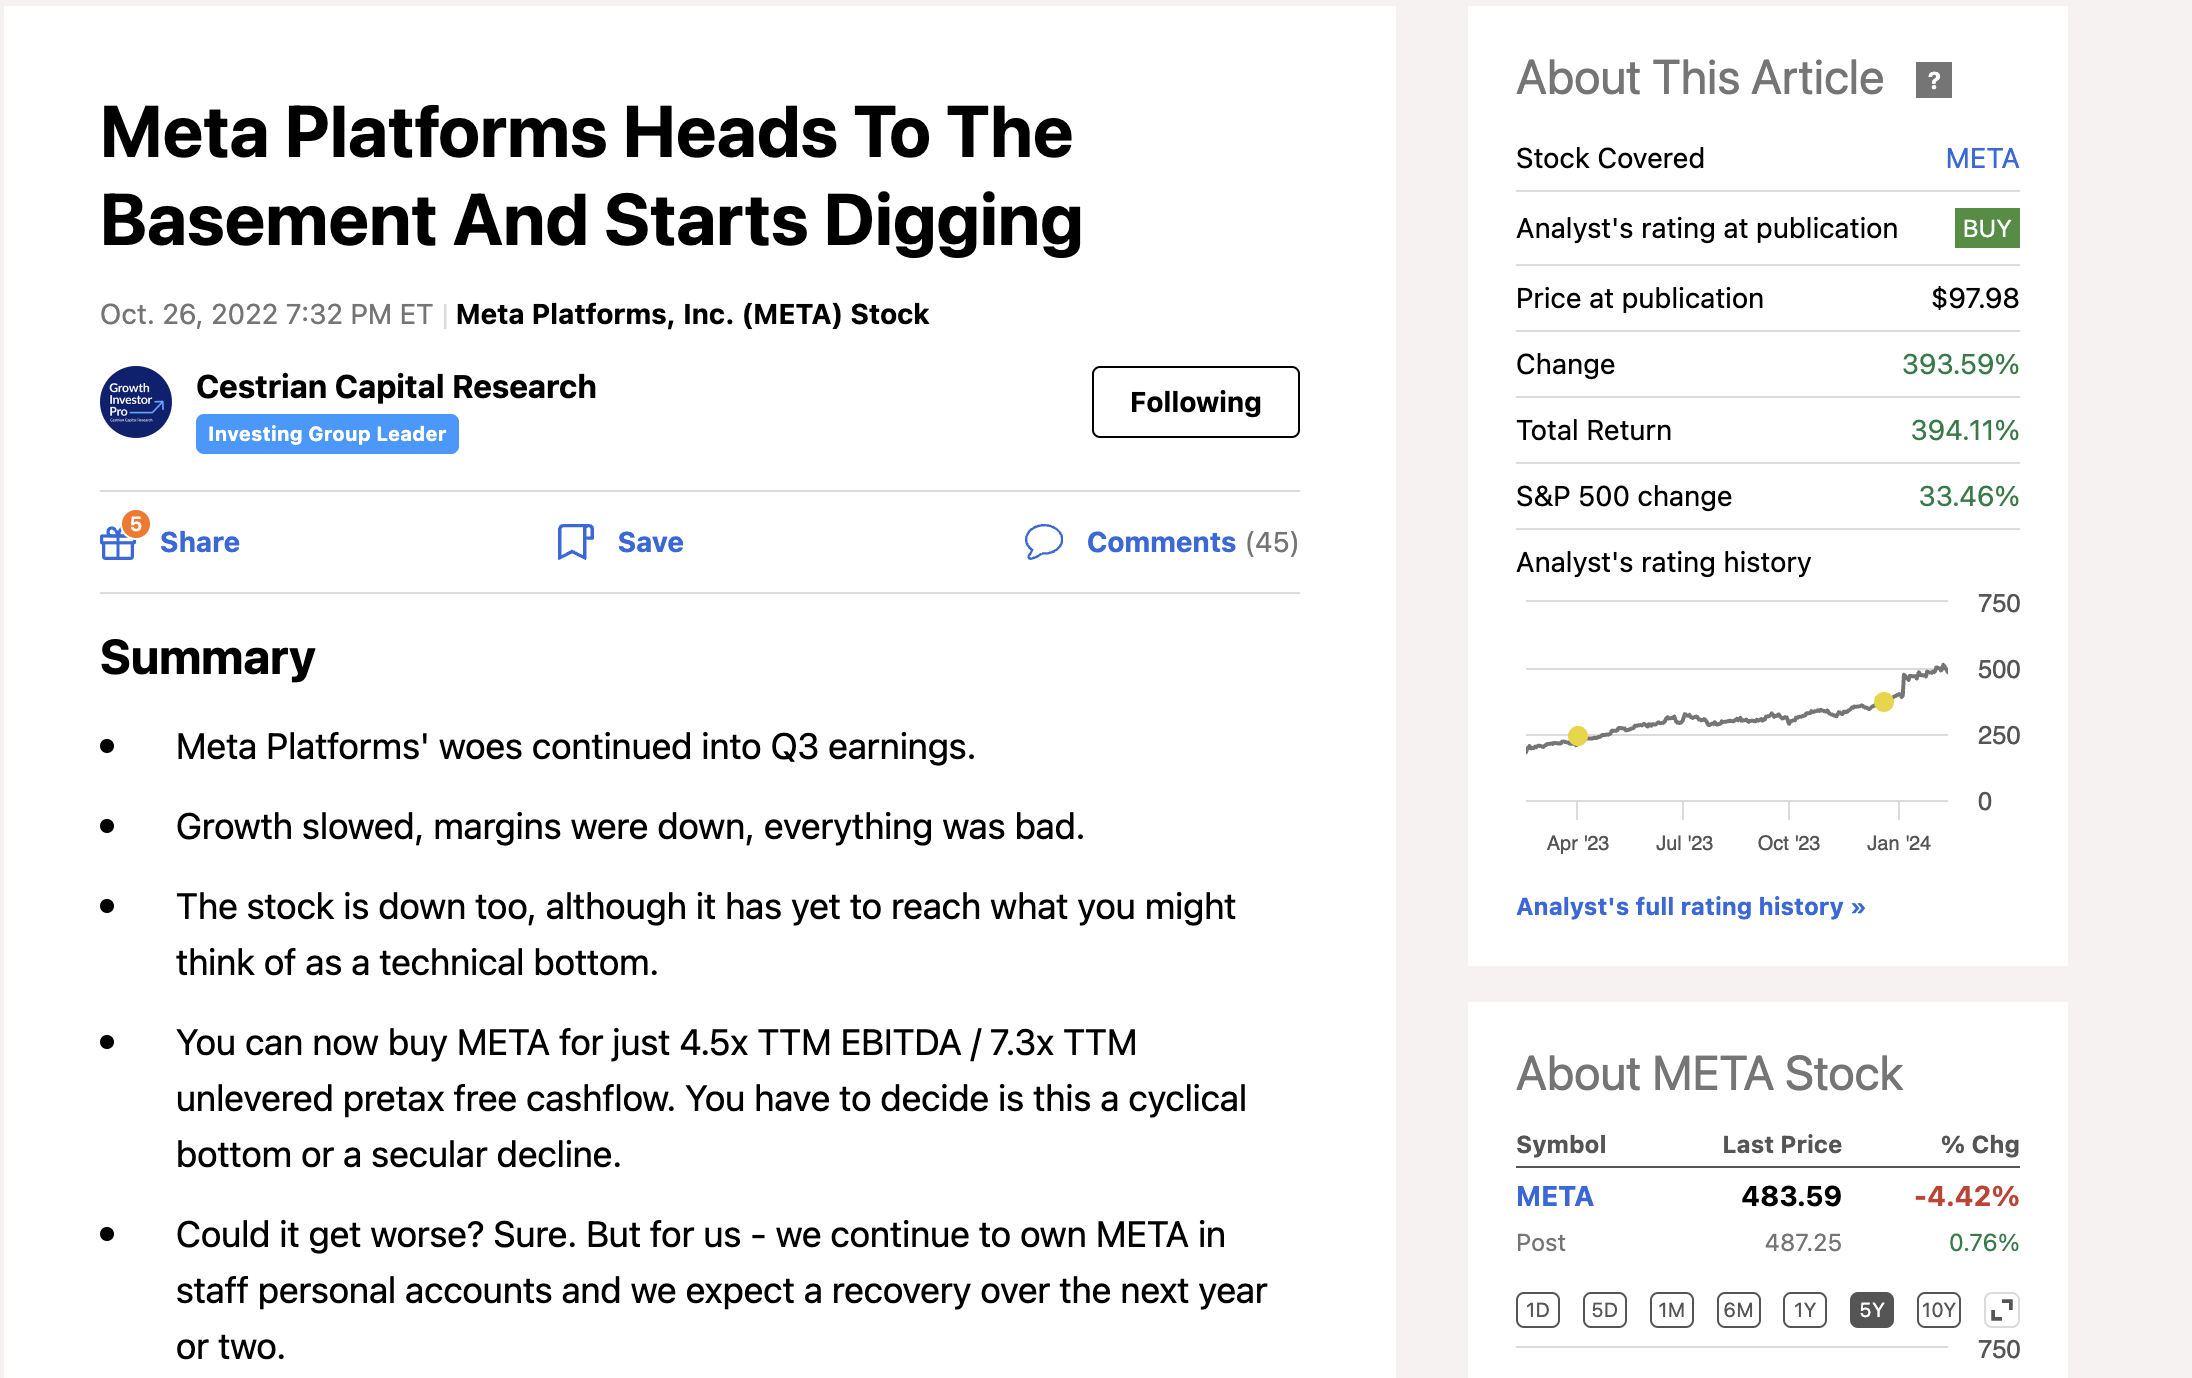
It was a righteous call, one of our best in fact.
Fundamentals alone, though, aren't all that helpful in deciding when to sell. Because when markets are pushing up and making new all-time highs, what kind of multiple of cashflow or revenue is too much? Is Nvidia too expensive at 64x TTM UFCF? Should it be sold as a result? Or is it cheap because cashflow is growing at such a rapid pace - the $33bn TTM UFCF reported in the most recent quarter is some 7.5x greater than the same measure a year prior.
This question - when should I sell? - is what led me to learn technical analysis, and from that, to dive deeper and deeper into the Stock Chart Rabbithole. This journey is what lies behind the Learn To Speak Market series of notes.
Today I want to start with a relatively simple concept which nonetheless is overlooked by most market participants. That concept is rotation.
The Downside Of Being Big Money
Big Money has relatively few weaknesses vs. Small Money; its primary problem is its very Bigness. If you run your own money, or family-office level money, or even hedge fund money measured in single-digit-billions-of-dollars, you can pretty much do what you like in the major stocks and indices, and nobody will notice. Because as long as you don't start messing about with small caps, your moves won't move the market, and won't attract attention that you don't want. Good for you. Have at it.
But what if you run Truly Huge Money - how then can you flex your muscle to get an edge, when adding 1% allocation even to Microsoft can, if you're not careful, tip the market the wink, cue momentum funds jumping on your idea like so many sucker fish?
The answer is by using rotation methods. Many folks have designed templates to help identify this but my own favorite is Wyckoff Rotation. Wyckoff, an early-20th-century market analyst, used the conceptual tool of pitting the individual investor - Small Money in our world - against the market at large which in this model was controlled by a single opponent - Big Money in our world. And defined four phases of behavior by Big Money which was capable of delivering gains solely by dint of the method and with no regard to exogenous factors such as earnings, GDP, and so forth.
In our own work at Cestrian Capital Research we simply this to the nth degree and conceive of those four phases per the below. And it is remarkable how often these patterns show up and can be taken advantage of. Our timeframe for this type of analysis is usually months/years by the way.
- Accumulation - Big Money slowly picking up a stake in a stock or ETF. Price action is usually sideways at the lows, at high volume on the price x volume indicator, and rangebound in nature.
- Markup - the stock breaks to the upside as good news stories arrive on a screen near you. At this point Big Money has done buying its allocation, and the good news acts as a dog whistle to Late Money of all kinds - momentum funds, retail and so forth. This is called Markup because in exchange for doing absolutely nothing, the position accumulated by Big Money during the Accumulation Zone suddenly becomes worth more.
- Distribution - Big Money slowly selling at the highs in a rangebound fashion at high volume on the price x volume chart. All the while you can expect the good news stories to continue.
- Markdown - once Big Money has done selling, the good news stories may evaporate and, with that, so too will buyers. But this is fine because there isn't much seller appetite either. With volumes low, late sellers drive down the stock quickly.
And then the cycle begins again.
In later episodes of this series we'll get into how to identify this capital rotation behavior in single-name stocks and ETFs, by overlaying technical analysis patterns as a way to find evidence supporting or opposing whatever part of the cycle you think that stock or ETF may be in.
But for now let's look at a very high level version of Wyckoff Rotation, being the rotation into and out of sectors.
This can be observed, and followed, very simply using sector ETF charts.
Buy Low, Sell High
Imagine you are sat at Big Money, HQ. You have, in this thought experiment, a fixed quantum of funds at your disposal. How do you create gains over and over, how do you compound up the capital you manage? Answer, buy sectors at the lows, hold, sell them at the highs. Rotate that capital into the sectors now at the lows, hold, sell them at the highs. Rinse and repeat.
We track this using the SPDR series of sector ETFs and we're always looking for which sectors may be at the highs and have been there for some time - prima facie that's a candidate to sell - and those at the lows and there for some time - prima facie that's a buy idea.
Here's the last 5 years price action in a selection of sector ETFs - this is price only, no dividends included.
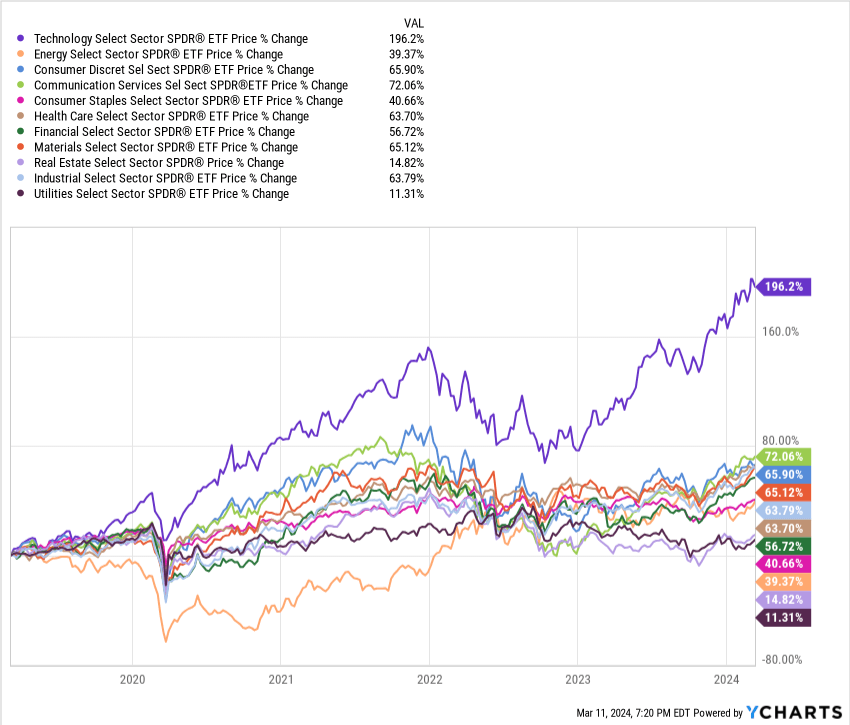
Tech (XLK) way out in front, and utilities (XLU) the laggard. Real estate (XLRE) too. So right there one might well be thinking, take profits in XLK - slowly! - and accumulate XLU and XLRE.
Now let's look shorter term. Last 12 months.
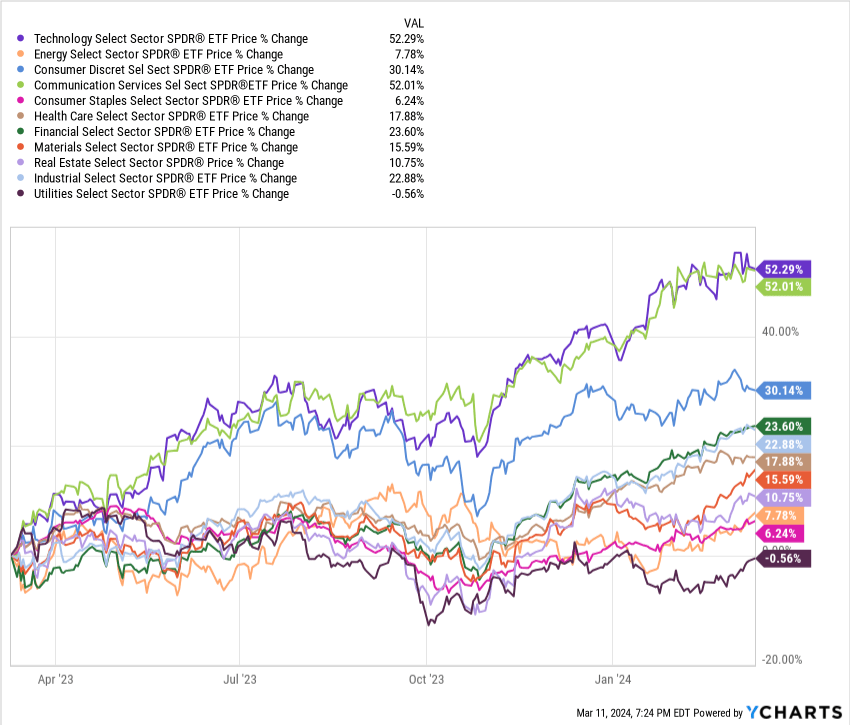
Tech (XLK) and communication services (XLC) out in front; and look - utilities (XLU) still the laggard, flat on the year.
Now the last three months. Comm services (XLC) and Financials (XLF) out front; utilities (XLU), real estate (XLRE) and consumer discretionary (XLY) the laggards. Notice how the same two names, XLU and XLRE, keep coming up as laggards. If you are following the rotation method this ought to be drawing your attention as a possible set of sectors to accumulate.
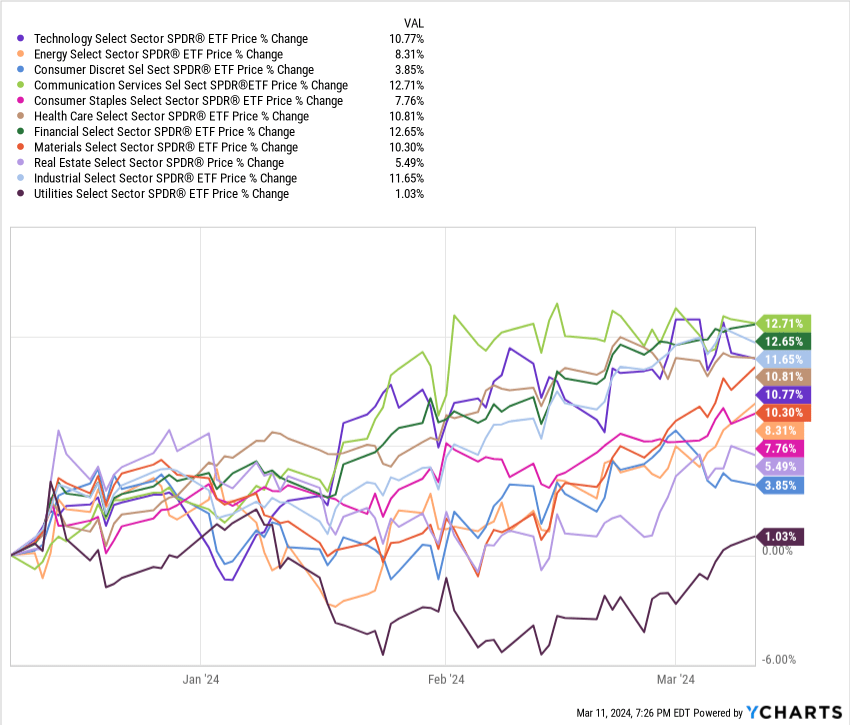
BUT WHY WOULD ANYONE BUY THESE THINGS, you may ask. Utilities! Real Estate! Boring beyond belief and they UNDERPERFORM THE MARKET, LOOK, YOUR OWN CHARTS SHOW THAT.
And we would say, well, nobody is saying own these things forever, or own them instead of those YOLO NVDA $3000 strike call options. We are saying that following this trail of breadcrumbs can help identify sectors at the lows ready to move up.
If you had applied this method in 2022 you would have found that tech (XLK) and comm services (XLC) were at the lows, primed to be accumulated prior to a move up. You know what happened to tech and comm services in 2023-4. Up, with bells on.
If you had applied this method in 2020 you would have found that energy (XLE) was the laggard, right into early 2021 in fact. And you know what happened to energy names in 2022. Brought to you by the letters U and P.
Last month?
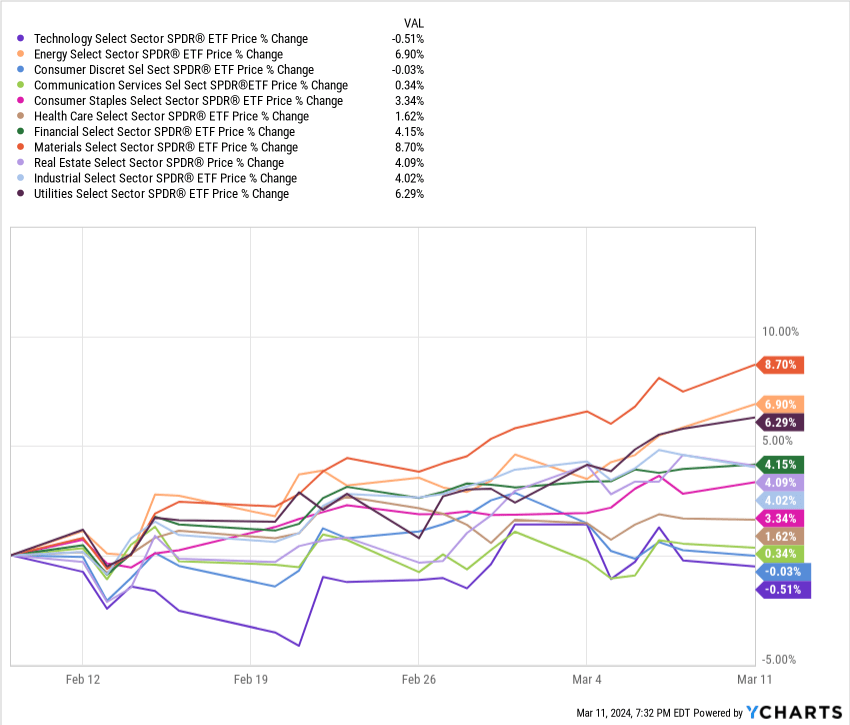
Utilities moving up - the third biggest mover in fact, and real estate the fifth.
This is an indicator - just a hint - that perhaps utilities and real estate have been under accumulation for some time and are ready to break out to the upside. And if you are Not As Big As Big Money, buying now won't move the stock prices but they may set you up for upside, particularly since the upside break is very recent, so you can place protective stops not a million miles from where the stock is today.
This is how sector rotation works. Buy energy ETFs and stocks in 2021 and ride them up into 2022, sell, sit back, do nothing, take gains in mid 2022 and rotate that capital into tech and comm services stocks and ETFs. Consider rolling capital into utilities and real estate names here at the lows for those sectors, sit back and wait for the good news stories to propel these sectors higher. Will utilities and real estate moon tomorrow? Probably not. Do we think they can trend higher over time? We do.
Further Into The Rabbithole
Next week we'll show you how to overlay technical analysis on the sector ETFs to confirm whether a particular ETF looks like it's under accumulation or not; and if so, how to go looking for single name stocks in that sector that may also be coiling for a break to the upside.
For now, any questions, reach out in comments below.
Cestrian Capital Research, Inc - 11 March 2024.
Disclosure: Cestrian Capital Research, Inc staff personal accounts hold long positions in, inter alia, NVDA.