
Been About 48 Hours Since Yesterday - Market On Open, Thursday 25 July

DISCLAIMER: This note is intended for US recipients only and, in particular, is not directed at, nor intended to be relied upon by any UK recipients. Any information or analysis in this note is not an offer to sell or the solicitation of an offer to buy any securities. Nothing in this note is intended to be investment advice and nor should it be relied upon to make investment decisions. Cestrian Capital Research, Inc., its employees, agents or affiliates, including the author of this note, or related persons, may have a position in any stocks, security, or financial instrument referenced in this note. Any opinions, analyses, or probabilities expressed in this note are those of the author as of the note's date of publication and are subject to change without notice. Companies referenced in this note or their employees or affiliates may be customers of Cestrian Capital Research, Inc. Cestrian Capital Research, Inc. values both its independence and transparency and does not believe that this presents a material potential conflict of interest or impacts the content of its research or publications.
B-Wave Incoming?
by Alex King
When a correction hits markets, more often than not they hit in an a-b-c pattern. This is very fancy talk as you can see. Highly technical. But allow me to explain. -
- The ‘a’ part is the first leg down, the selloff that “nobody saw coming”. (I mean, you saw it coming because you read our stuff and you think about the charts we post and even if we didn’t see it coming there is a good chance you did).
- The ‘b’ wave is the counter-trend move - in a selloff this means the b-wave moves back upwards. Now, b-waves are evil, tricksy things because they ‘feel’ very bullish and make you feel like the correction is all done and everyone can go back to being happy and upbeat about the future once more. This isn’t true. A b-wave exists so that anyone who didn’t sell at the start of the correction - at the top of the a-wave - gets a do-over. Only the discerning, of course, because most folks just think, well, yippee, glad that misery is all done with, off to the races we go! Followed, by WAIT WHAT JUST HAPPENED?
- The ‘c’ wave is what. The c-wave is the final dump of the correction which can be truly brutal, ending some way below the bottom of the a-wave. The c-wave is when you ‘feel’ that all is lost and nothing will ever rise, ever again. And then, in the end, the correction is done and things move up once more.
Since talk at the moment is that stocks only move down, you can have some confidence that a b-wave will commence soon. The narrative is there - GDP printed positively today, jobs look good too, and there will likely be a Fed cut in September. But if we do get a move up, I would say that caution is warranted. Sometimes a b-wave will head all the way back to the start of the correction point, and yea verily is there celebrating - before blammo, it’s all over for the bulls once more. This happened in Q1 2022 for instance. Here’s SPY. (You can open a full page chart, here.).This is the A-B-C correction from the January 2022 highs to the June 2022 lows.
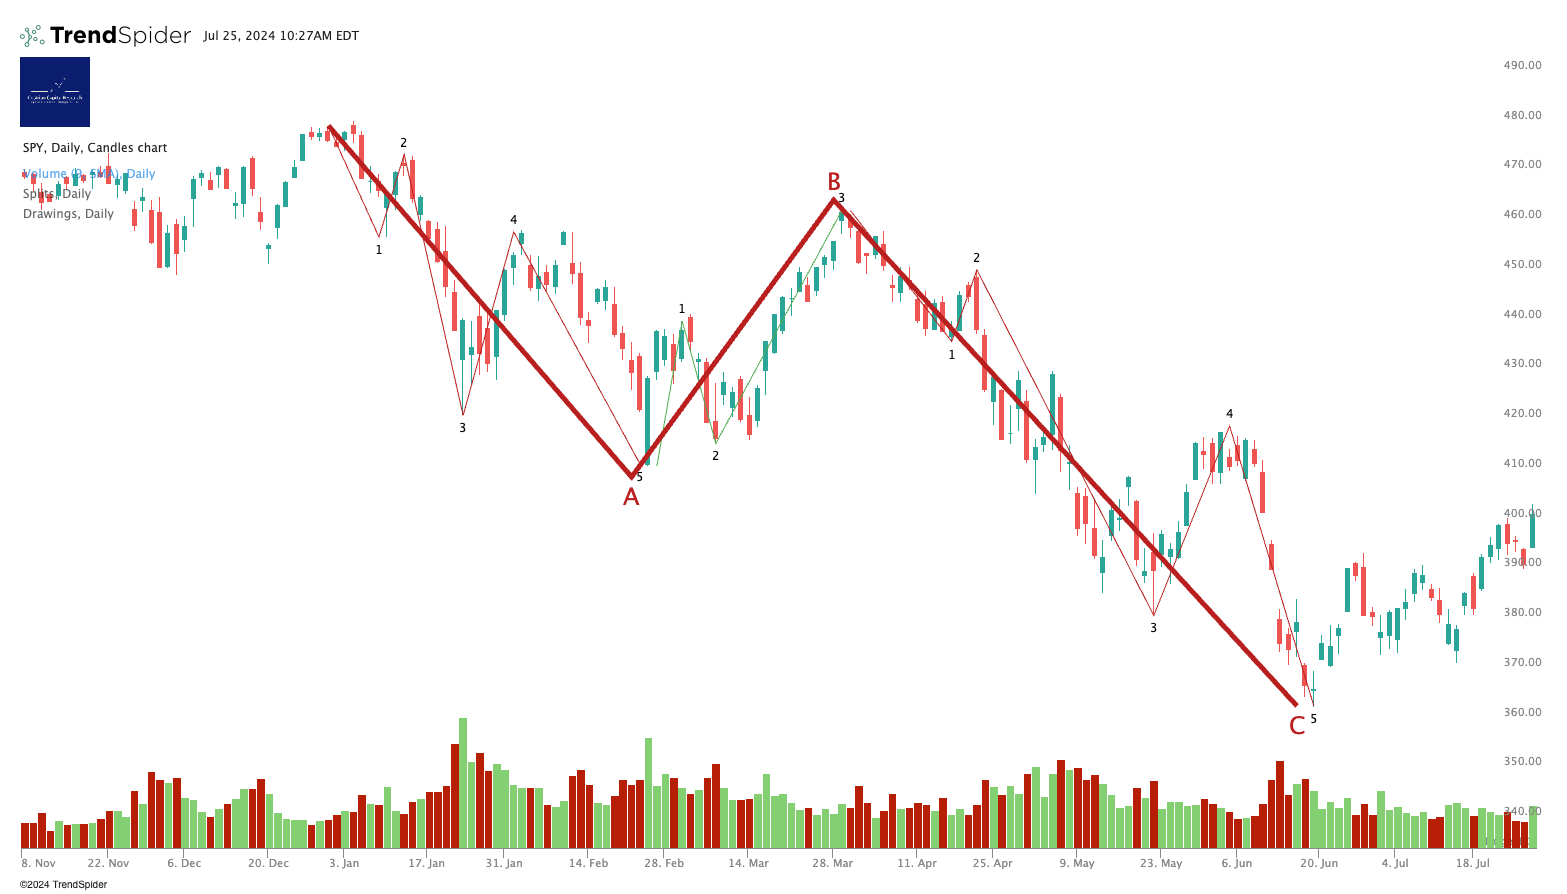
You can see how convincing that B-wave was; the A-wave was deep and scary and most people just wanted to believe that markets would rise once more - a powerful B wave was all the evidence they needed. The C-wave is where the real damage is done, as the chart shows.
Right now I think markets are looking for a B-wave. At the time of writing (1030 Eastern) one cannot say with any conviction that it has begun, but it may be on the horizon. If it happens then personally I plan to try to ride it up with longs, then re-hedge with shorts once it rolls over the top. Then ride the c-wave down hedged or even (if I am feeling particularly brave) net short. We’ll see how that plan survives the usual punch in the face, but for now that’s the plan.
Now, as always, it pays to react to price, not to anticipate it; but in my view it helps to have a map with which to navigate and to know which way to turn as events unfold. The charts we post here in the daily Market On Open note, available to any paying subscriber, are in my view a useful way of orienting oneself and understanding likely reversal, support and resistance levels in both the short and long term.
If you'd like real-time real-money trade disclosure alerts and a live ask-us-anything webinar each week, sign up for our Inner Circle service - consider doing so in July before prices rise 1 August. You can join up here.
Remember, just a few days to go before prices rise.
So Let’s Get To Work
As always in our market notes, we deal with long- and short-term charts covering the main US equity indices - that’s the S&P500, Nasdaq-100, Dow Jones-30, and the Russell 2000 - plus bonds, volatility, oil, and key sector ETFs. You can use these daily notes to help you navigate long-term investments, and/or to help you action short-term trading. Any paid-tier subscription here gets you these notes every trading day.