A Peek Into The Inner Circle

DISCLAIMER: This note is intended for US recipients only and, in particular, is not directed at, nor intended to be relied upon by any UK recipients. Any information or analysis in this note is not an offer to sell or the solicitation of an offer to buy any securities. Nothing in this note is intended to be investment advice and nor should it be relied upon to make investment decisions. Cestrian Capital Research, Inc., its employees, agents or affiliates, including the author of this note, or related persons, may have a position in any stocks, security, or financial instrument referenced in this note. Any opinions, analyses, or probabilities expressed in this note are those of the author as of the note's date of publication and are subject to change without notice. Companies referenced in this note or their employees or affiliates may be customers of Cestrian Capital Research, Inc. Cestrian Capital Research, Inc. values both its independence and transparency and does not believe that this presents a material potential conflict of interest or impacts the content of its research or publications.

Origin Story
This note was first published earlier today in our Cestrian Inner Circle service. We publish a note like it each and every trading day, covering the 4 major US indices, the 10-year yield, the 3x levered index ETFs, and three 3x sector ETFs too. Want to join? Learn more here.
OK. Here goes with today’s note.
Buy Dips, Sell Rips, Wait, Rinse, Repeat
by Alex King for Cestrian Capital Research, Inc.
Thank you for reading Cestrian Market Insight. This post is public so feel free to share it.
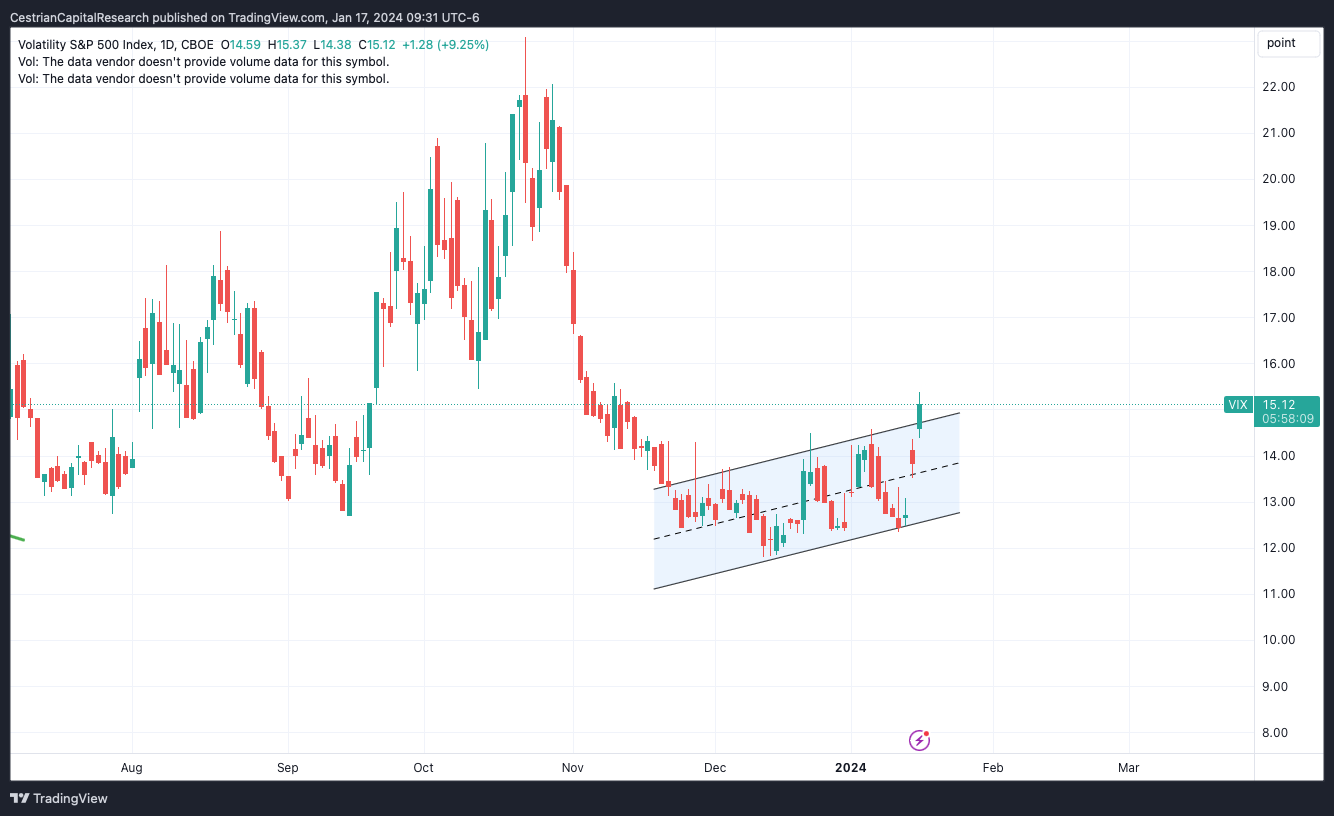
Still no direction from the market. You can sit and do nothing or you can try to buy dips and sell rips, all in the short term. The Vix - a measure of expected (implied) volatility in the S&P500 - has moved up a little in the last couple days which may be related to monthly options expiry which is now firmly in view. For now no sign of a market collapse nor of a rocket-fuelled liftoff. So, play golf or BTD / STR, you choose!
Vix - Trending Up In A Channel
Note - to open full-page versions of these charts, just click on the chart headings, which are hyperlinks.
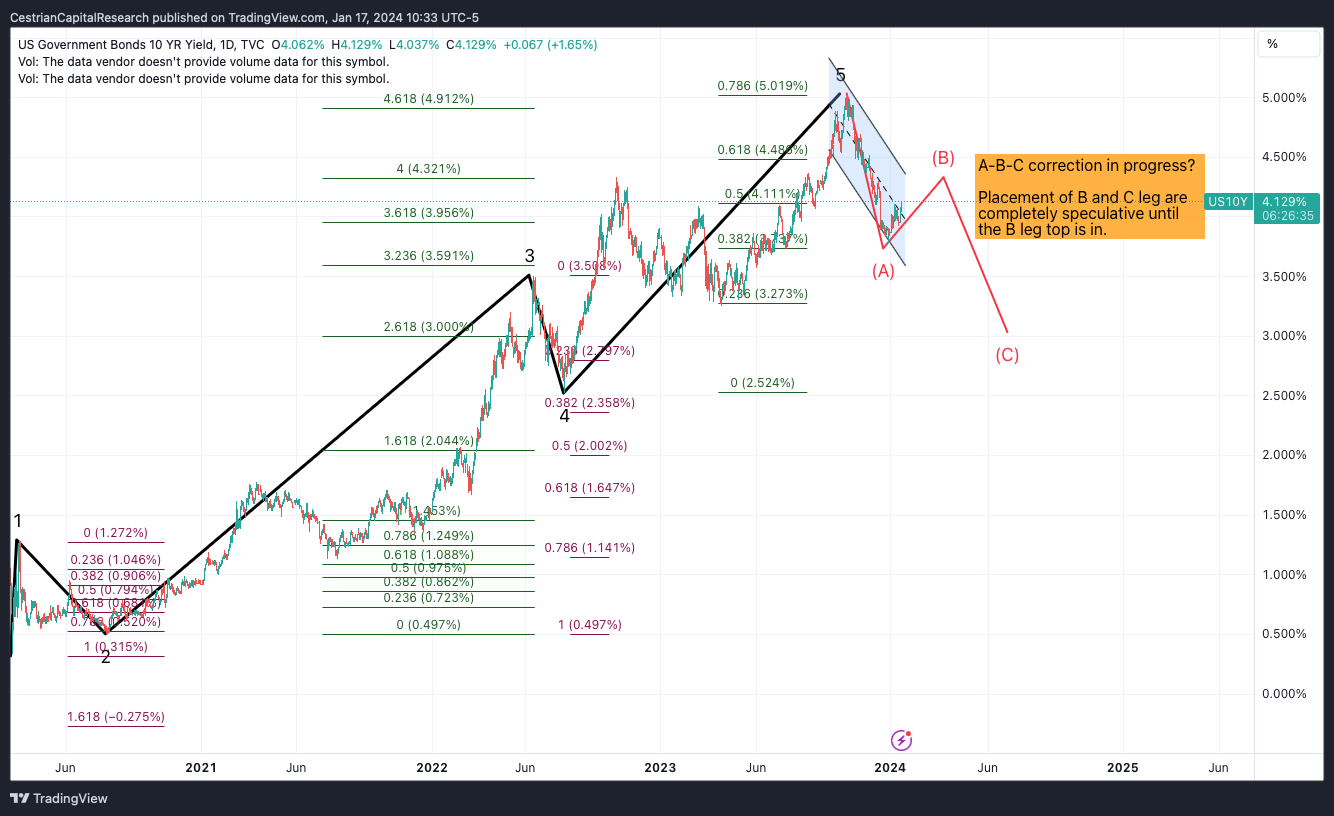
US 10-Year Yield
Heading to 4.3-ish% before another drop down?
S&P500 / SPY / ES / UPRO
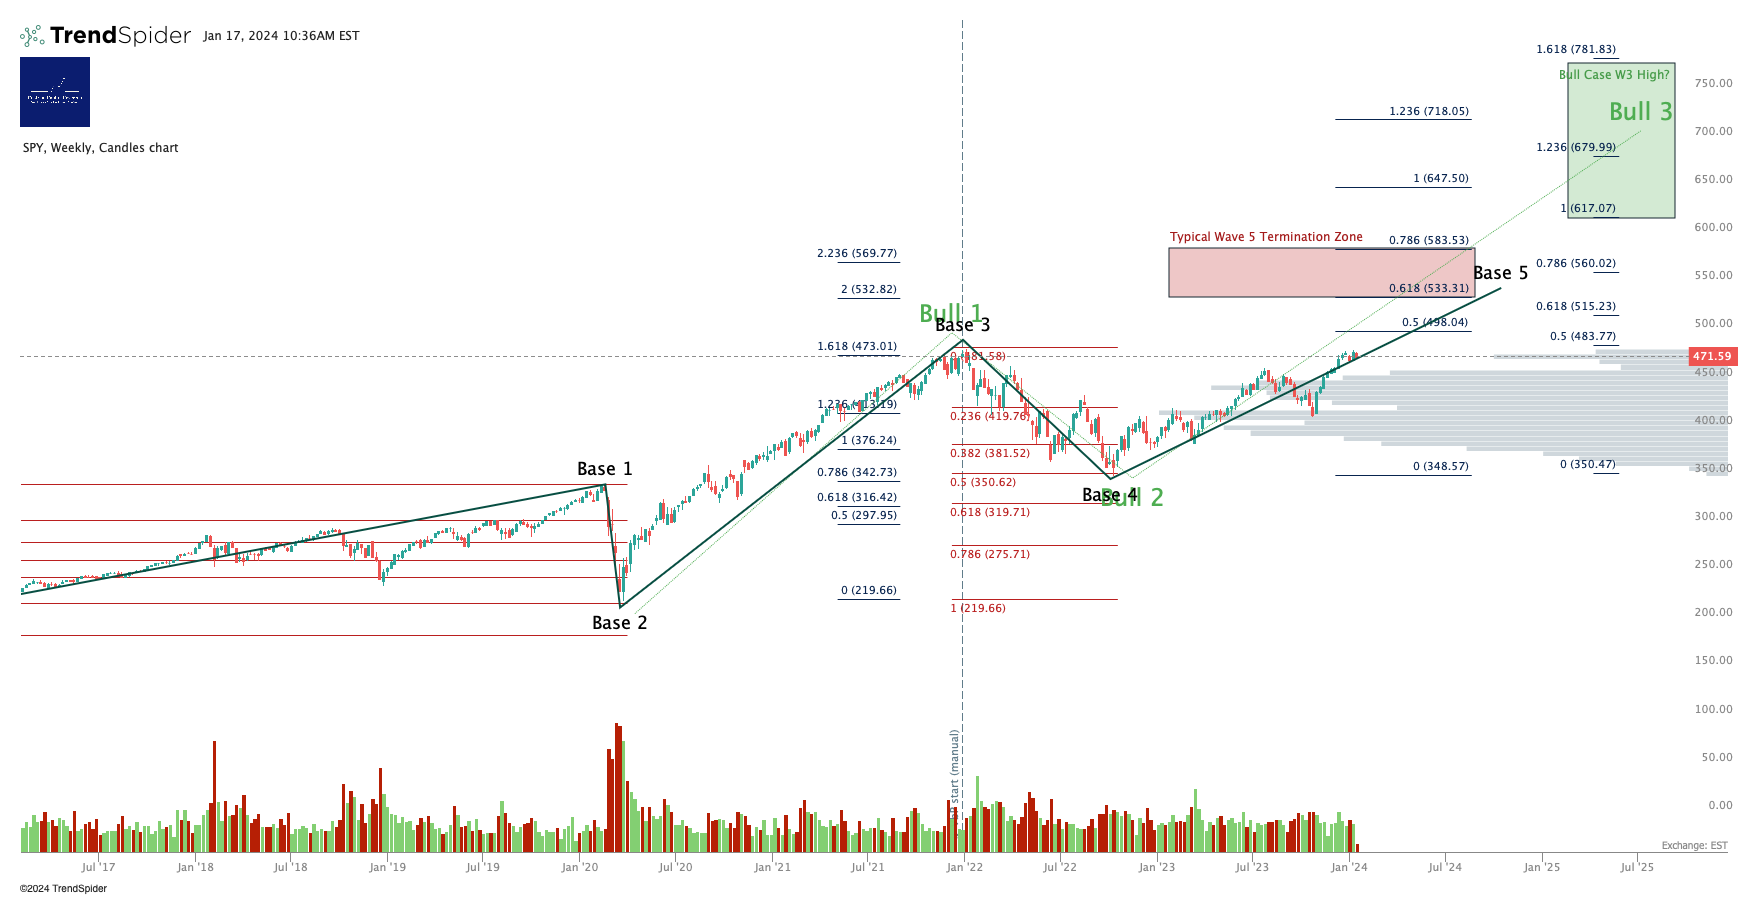
Larger Degree Base vs. Bull Case
Even if you take our base case as the outlook here, it looks like the S&P has some room to run up yet. Personally I added to UPRO today as I was underweight the S&P vs. the Nasdaq; if we get a selldown I will build up my SPXU position.
ES>4800, bullish. Simple. Put another way, ES>2021/22 high, bullish. Currently below.
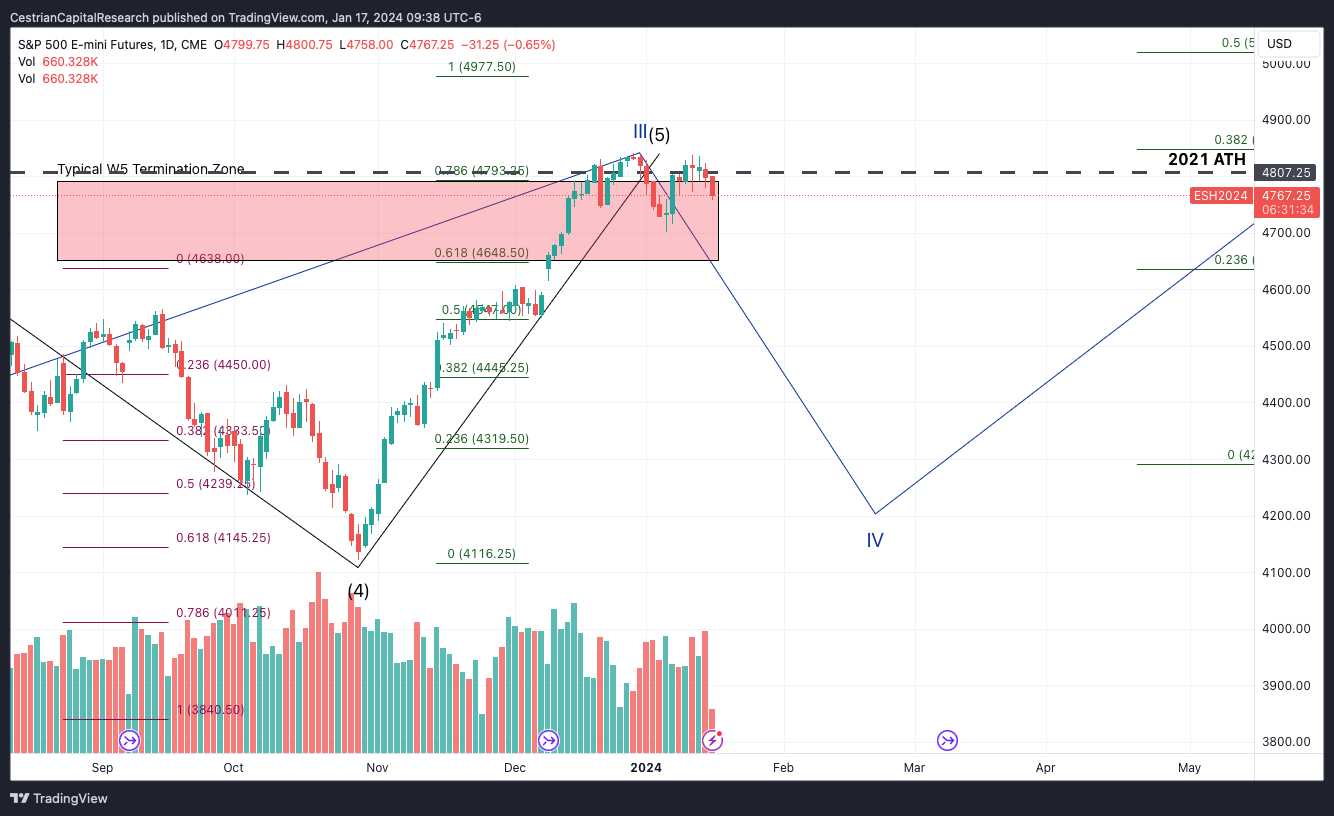
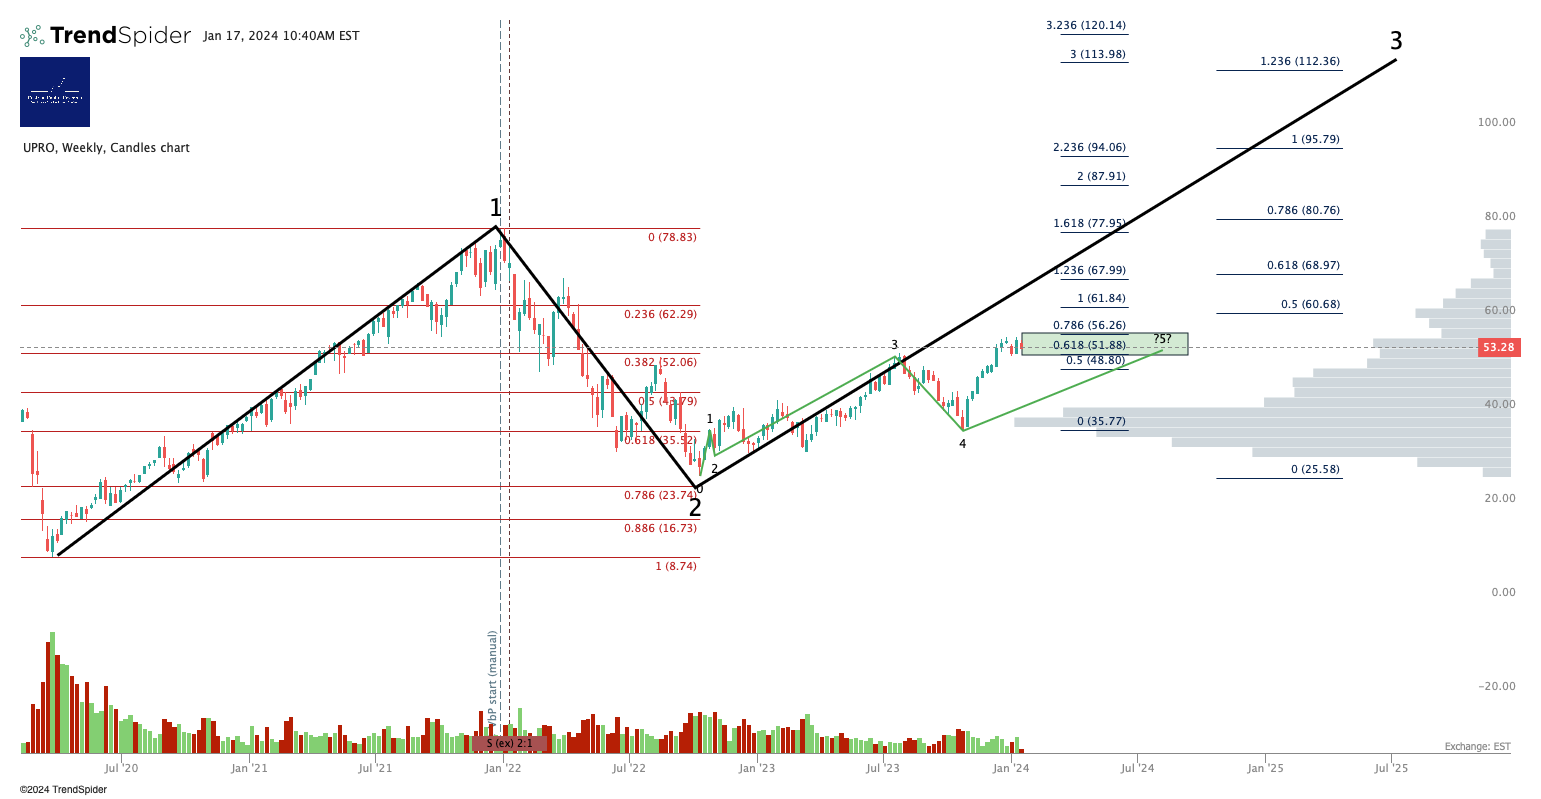
Personal Trading Plan Disclosure: I currently hold UPRO and SPXU in an approximate 3:1 ratio ie. I am 3:1 long:short the S&P500.
Nasdaq-100 / QQQ / NQ / TQQQ
Base vs Bull Case - Larger degree:
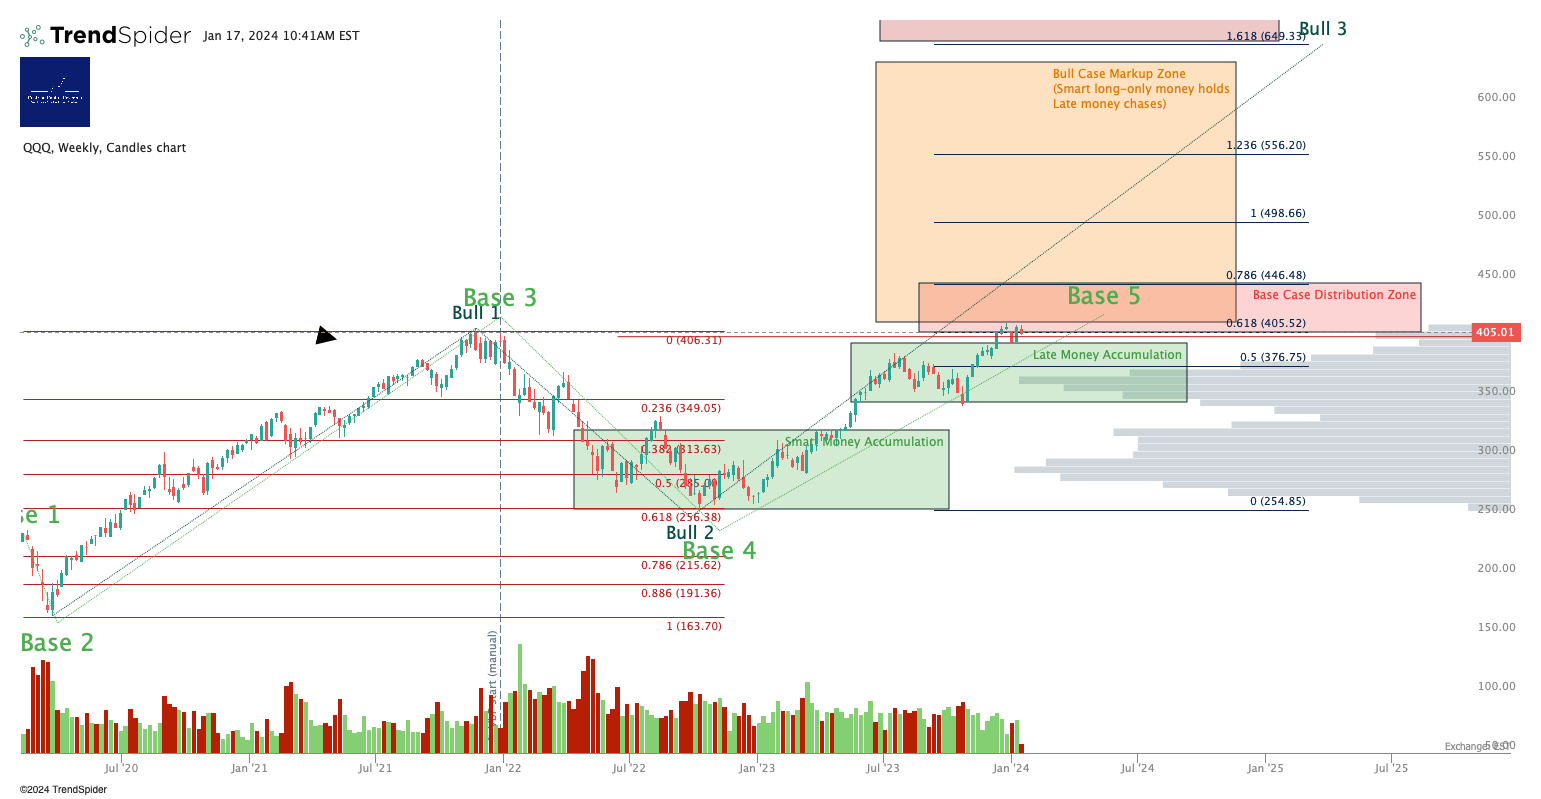
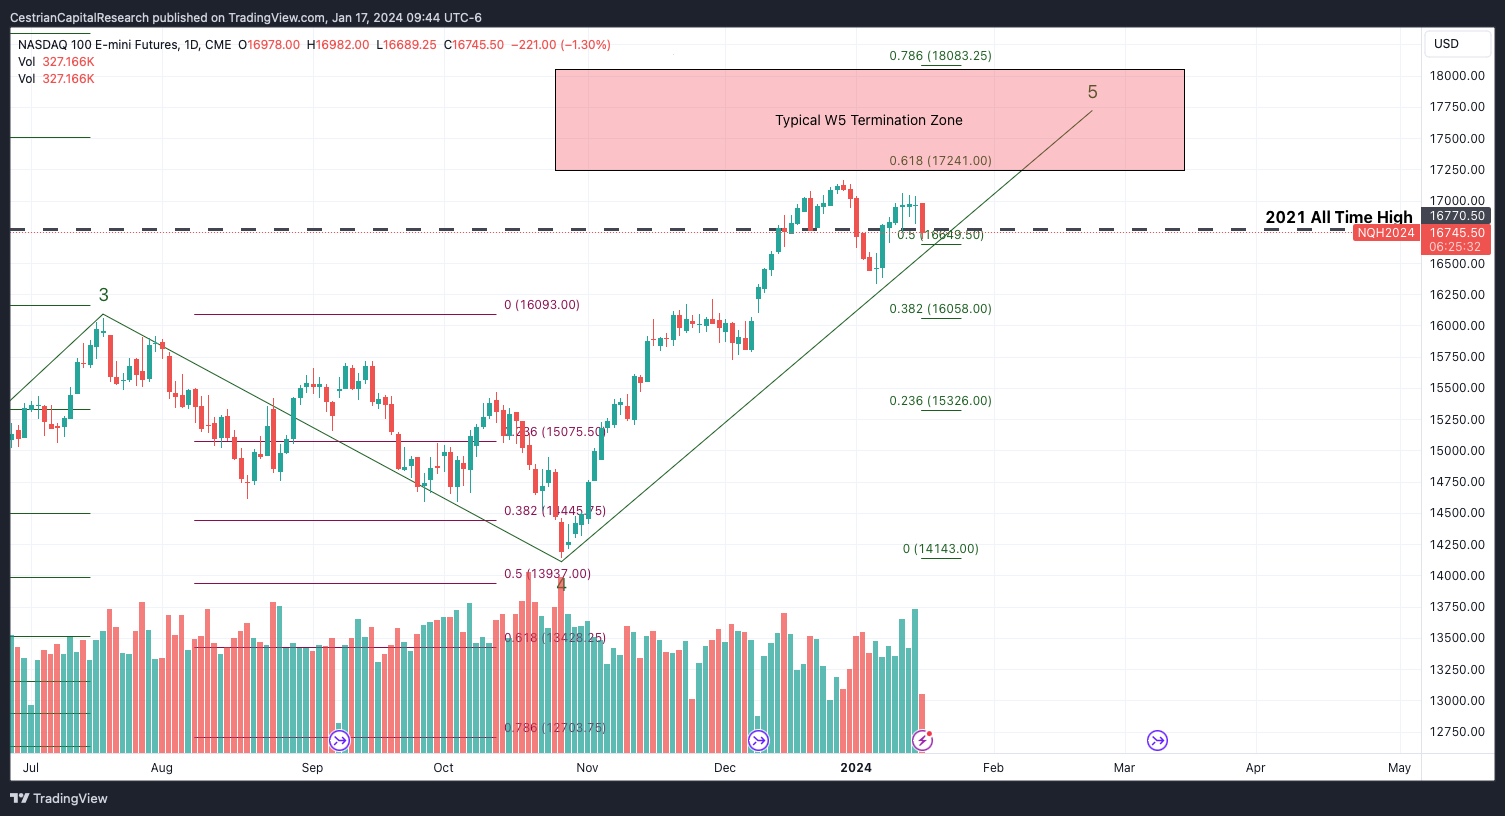
Below the 2021 ATH = bearish, above = bullish. That W5 termination zone is still above and not yet breached from below. That’s bullish too. Yesterday I sold all SQQQ positions and remain unhedged long TQQQ for this reason. NOTE in early trading today, NQ was below the 2021 high; that’s a warning shot which needs to be watched. If NQ closes above the 2021 high today, a selloff has been averted for another day, but a close below that level suggests something has changed.
If TQQQ can hold over $55 we may see a break to the upside. Until then, risk to the downside.
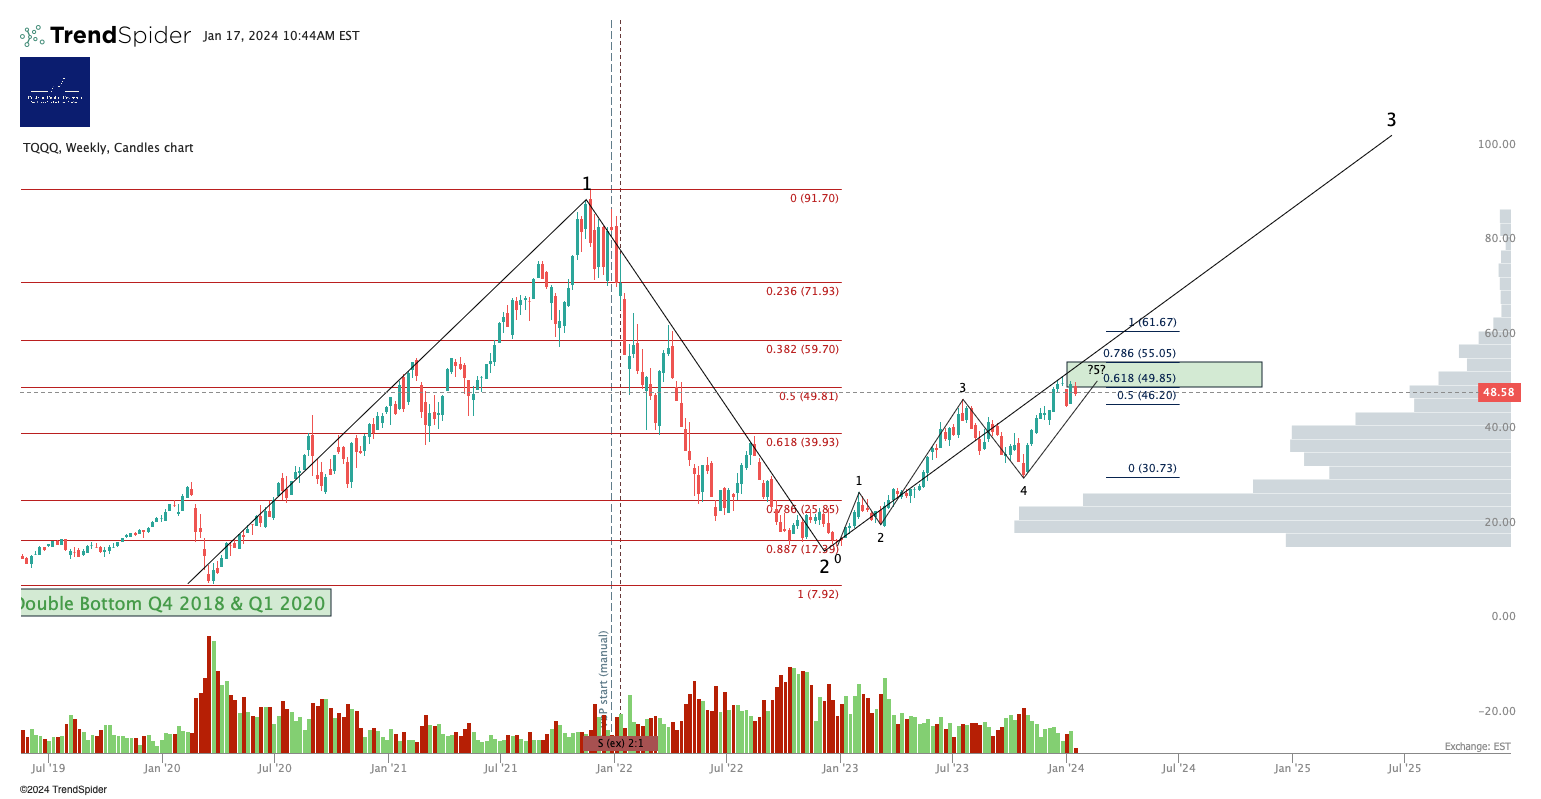
Personal Trading Plan Disclosure: I hold TQQQ unhedged at present.
Dow Jones / DIA / YM / UDOW
Base vs. Bull Case - Larger Degree
On this timeframe it looks like the Dow is going higher. I added to my UDOW position today with that in mind.
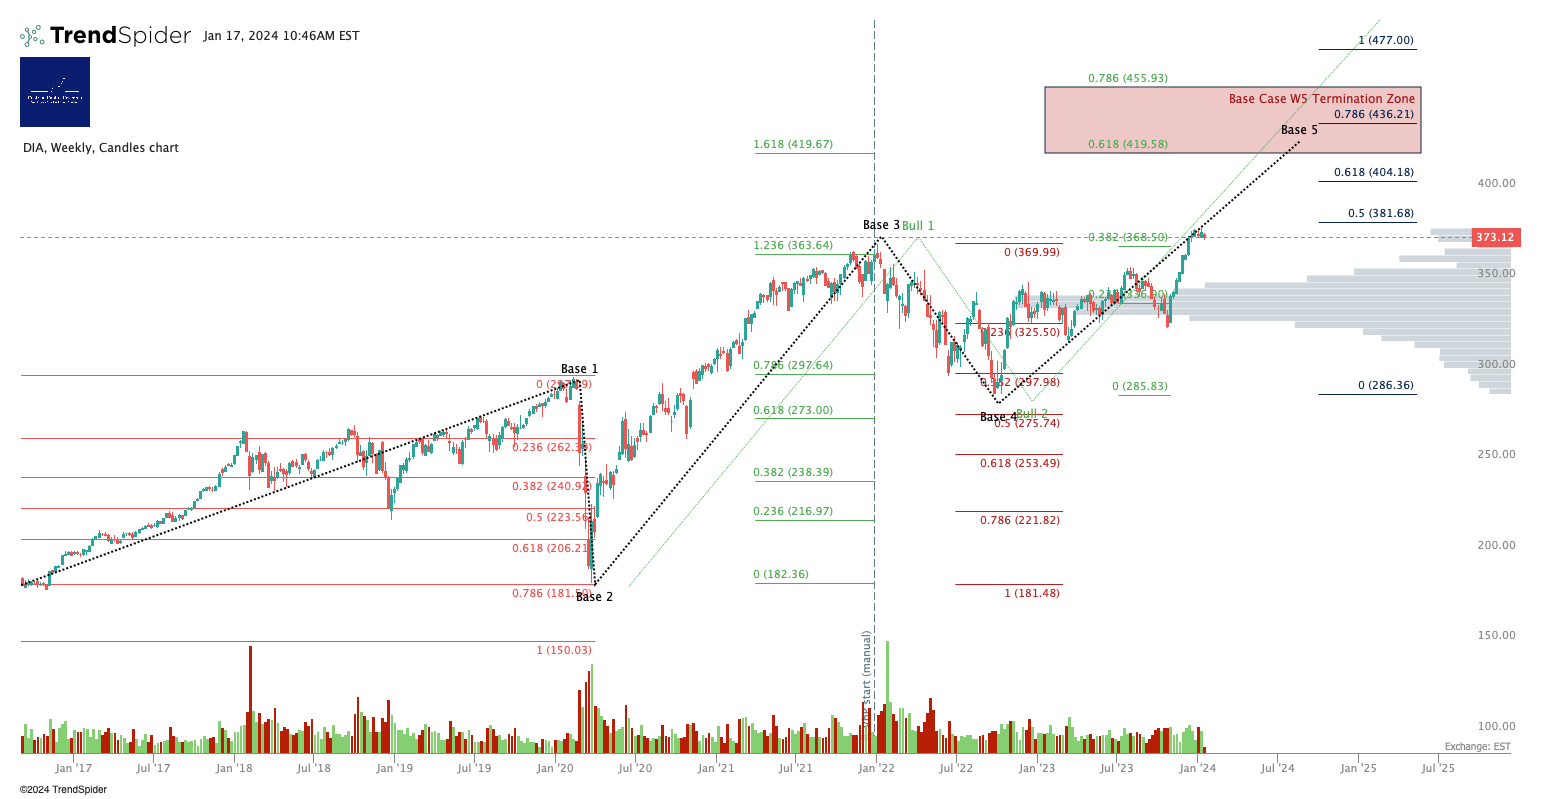
To repeat - again! - everything about this chart says that a pullback is due. So far no material drop. One must follow price not what one thinks price should be doing. I am presently unhedged long the Dow having banked modest SDOW gains yesterday. Ready to add SDOW again as and when the index starts to sell off in earnest.
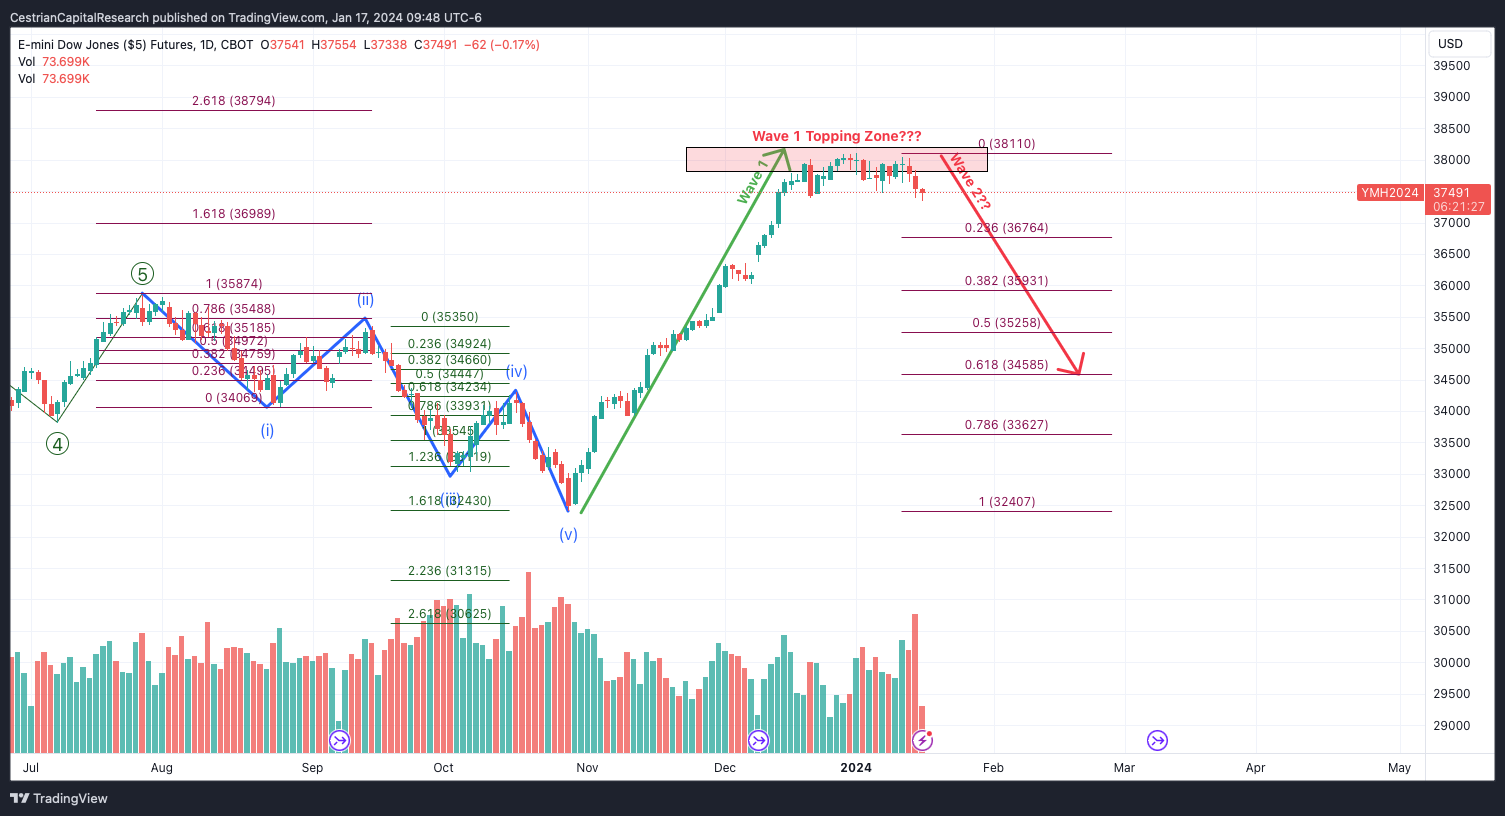
Upside ahead on this timeframe in our view.
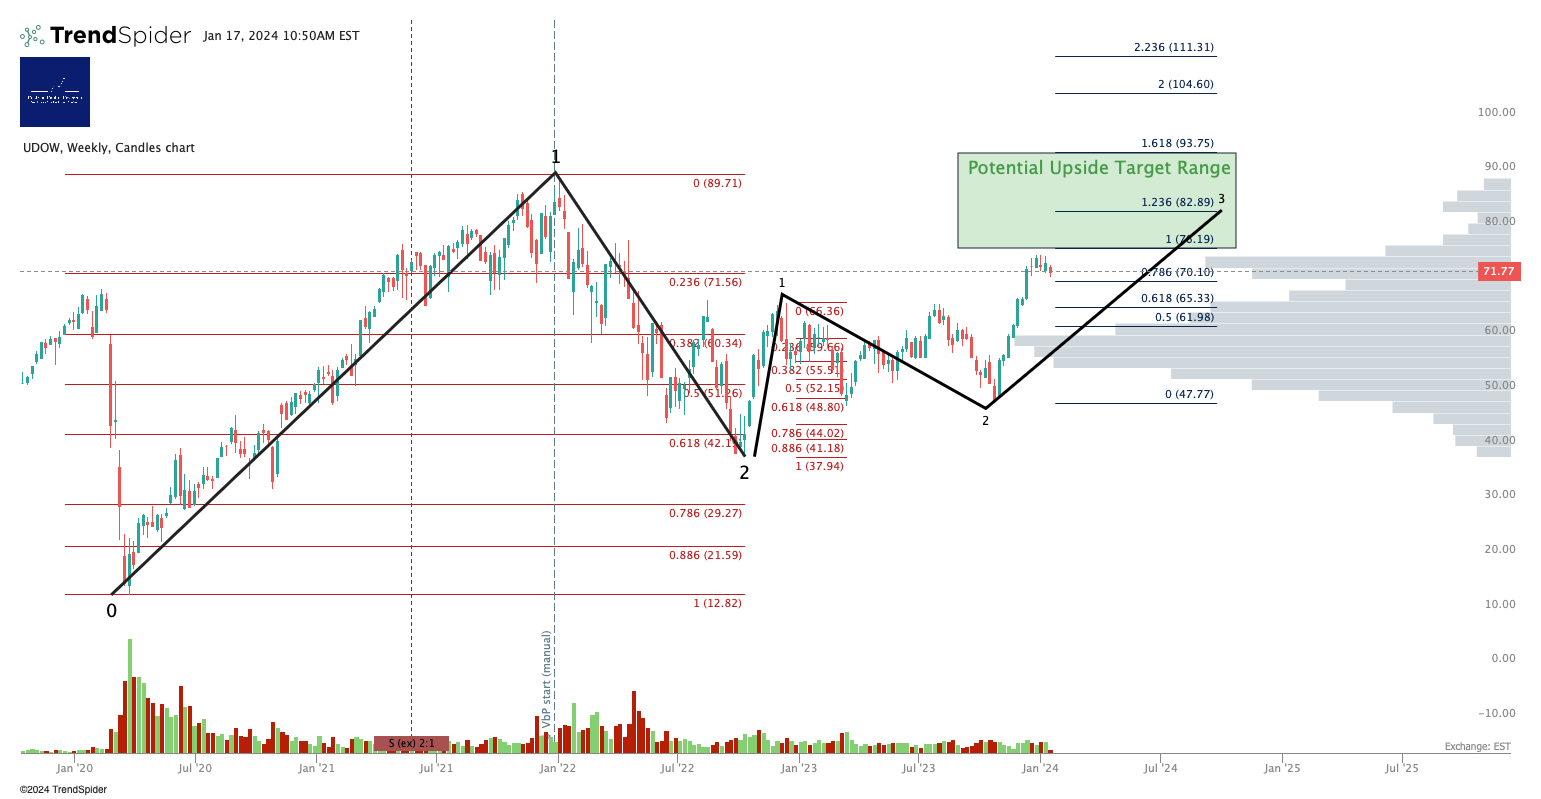
Personal Trading Plan Disclosure: I hold UDOW unhedged long.
Russell 2000 / IWM / RTY / TNA
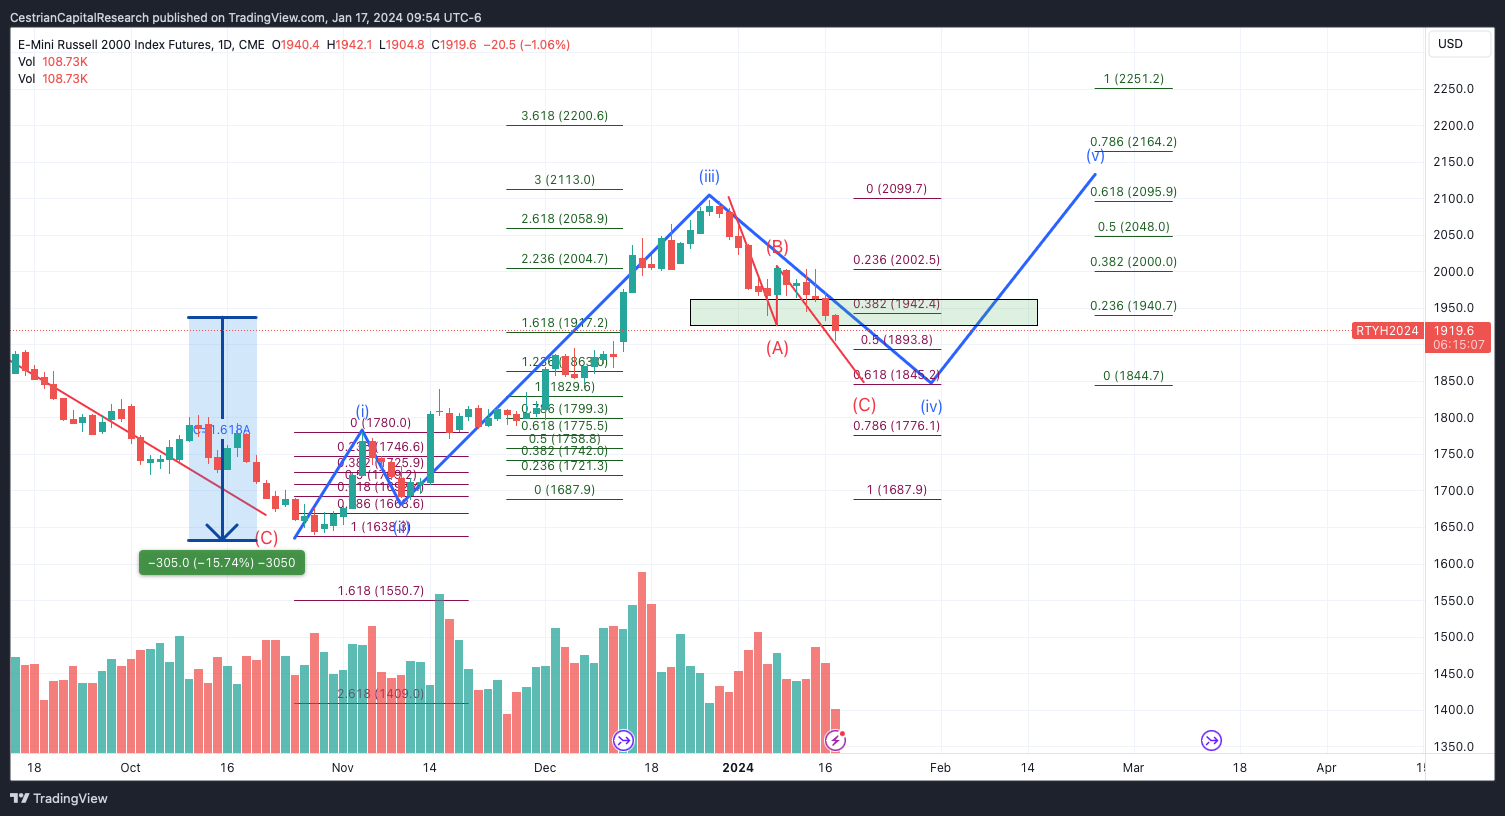
Selling off for now. Has hit about the level where we may start to see support, being the 0.5 retrace of that ginormo-move up in late 2023 (the RTY chart shows this most clearly).
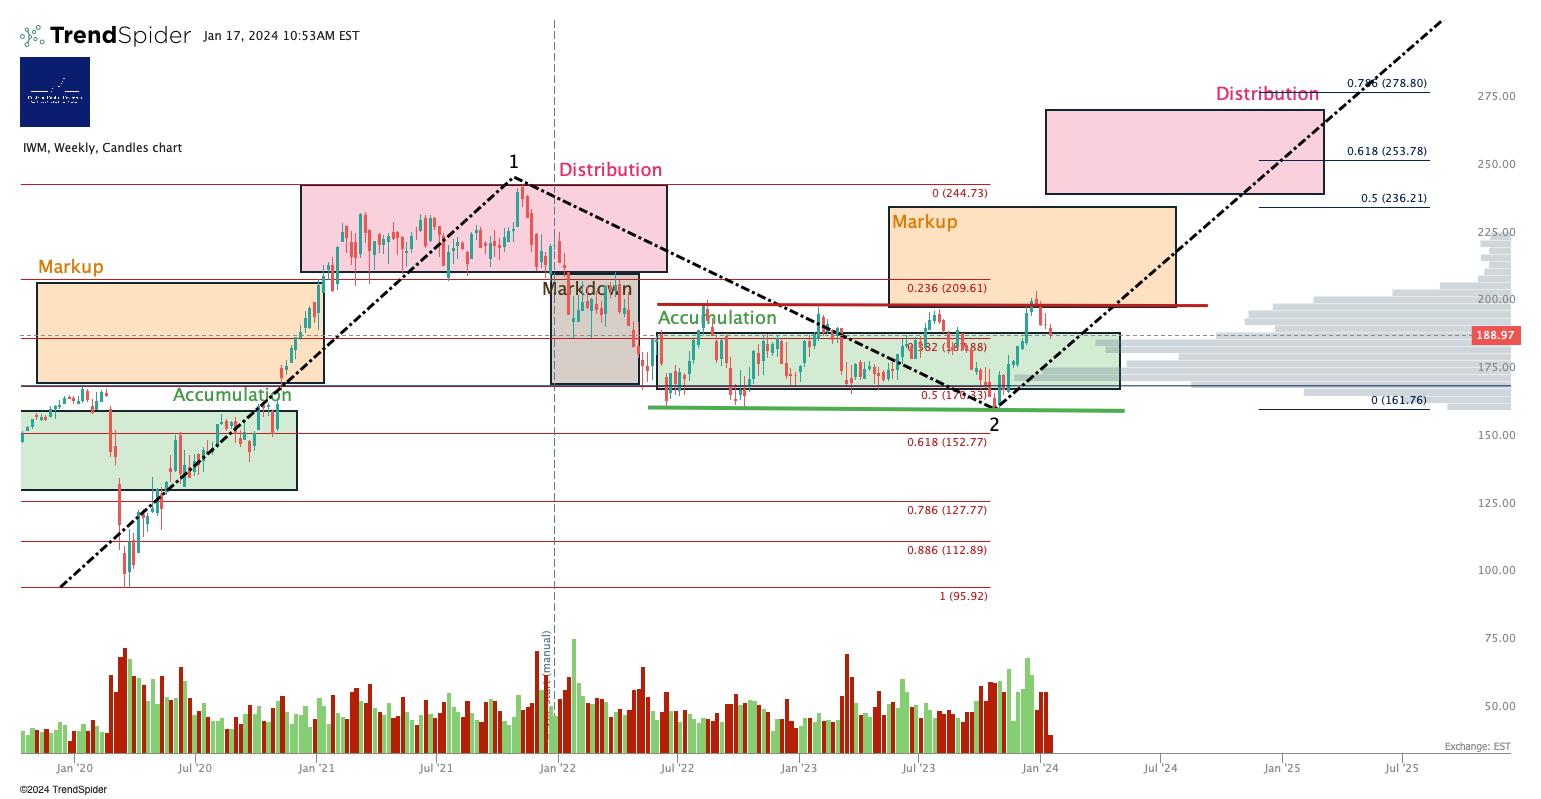
I continue to expect a further move down in that C-leg, to maybe the .618 retrace level, but what I think and what happens are independent variables so as always, one should follow price not opinion!
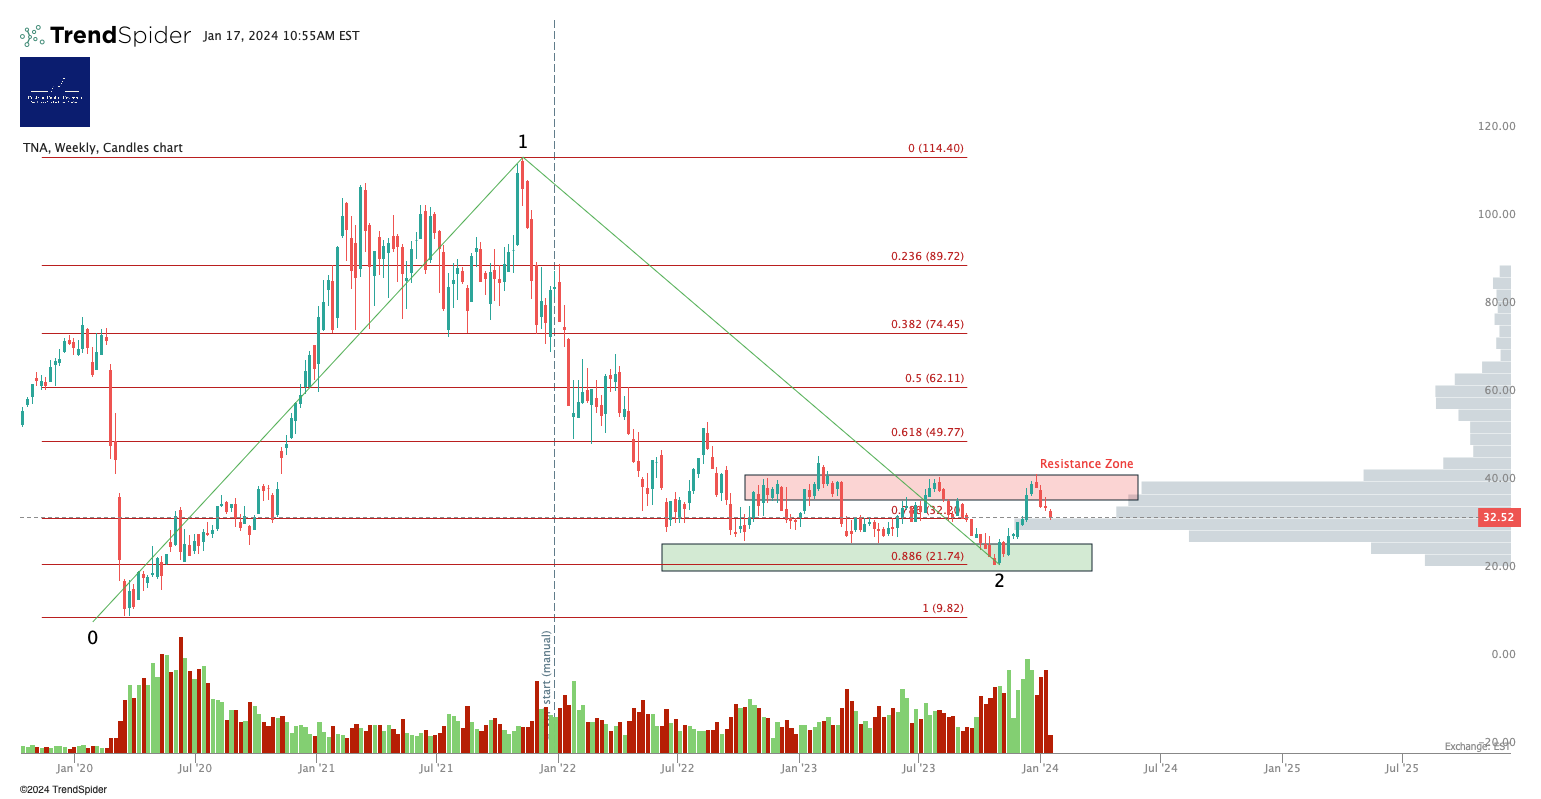
Personal Trading Plan Disclosure: Currently a small unhedged long TNA position.
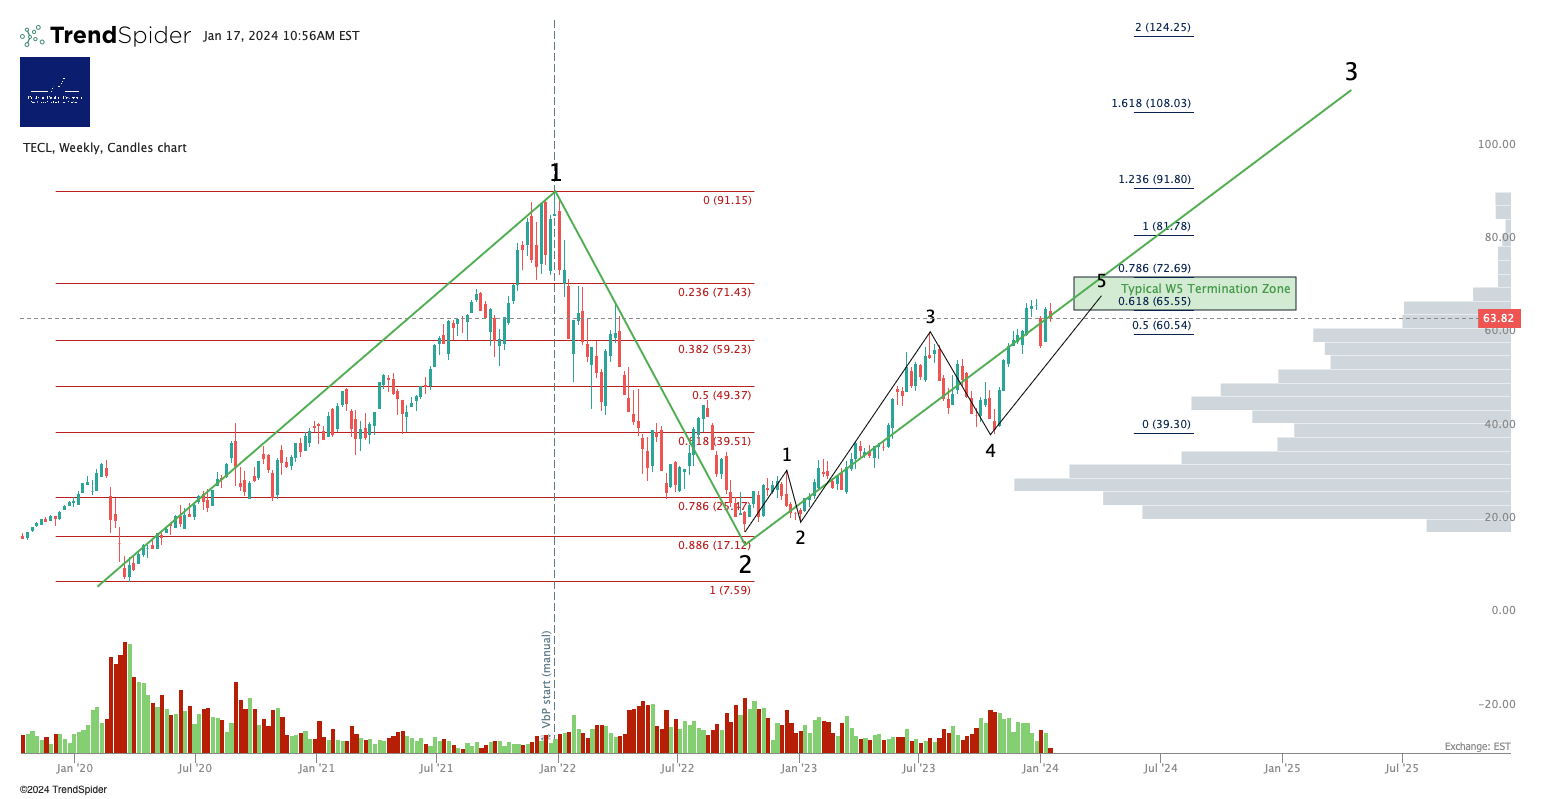
3x Levered Long XLK (Tech) - TECL
Rolled over right in the middle of our W5 termination zone. Consider TECS to the short side if you are using this instrument.
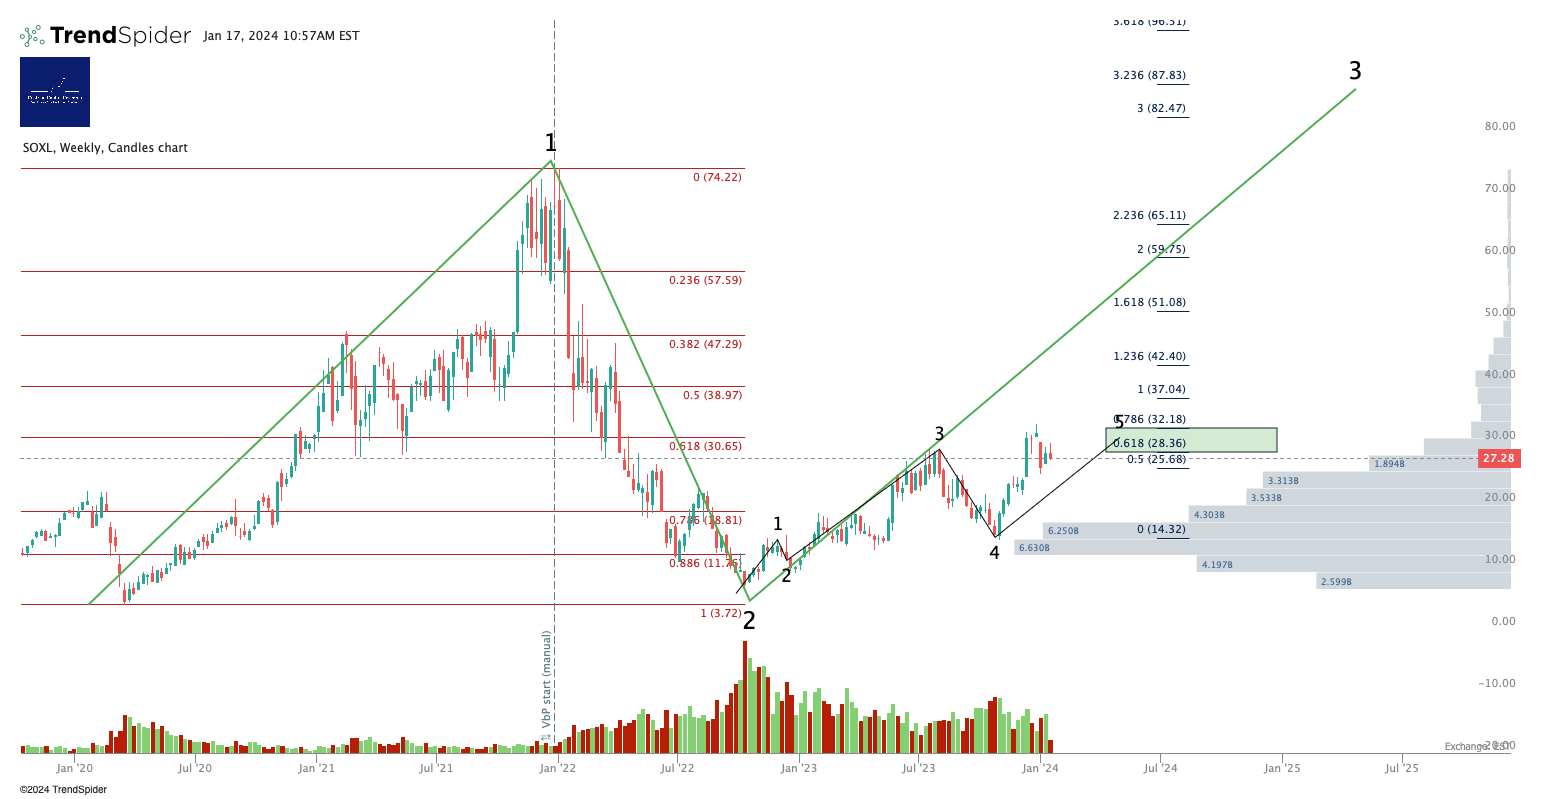
3x Levered Long SOXX (Semiconductor) - SOXL
Rolled over at the top of our W5 termination zone. Consider SOXS to the short side if you are using this instrument.
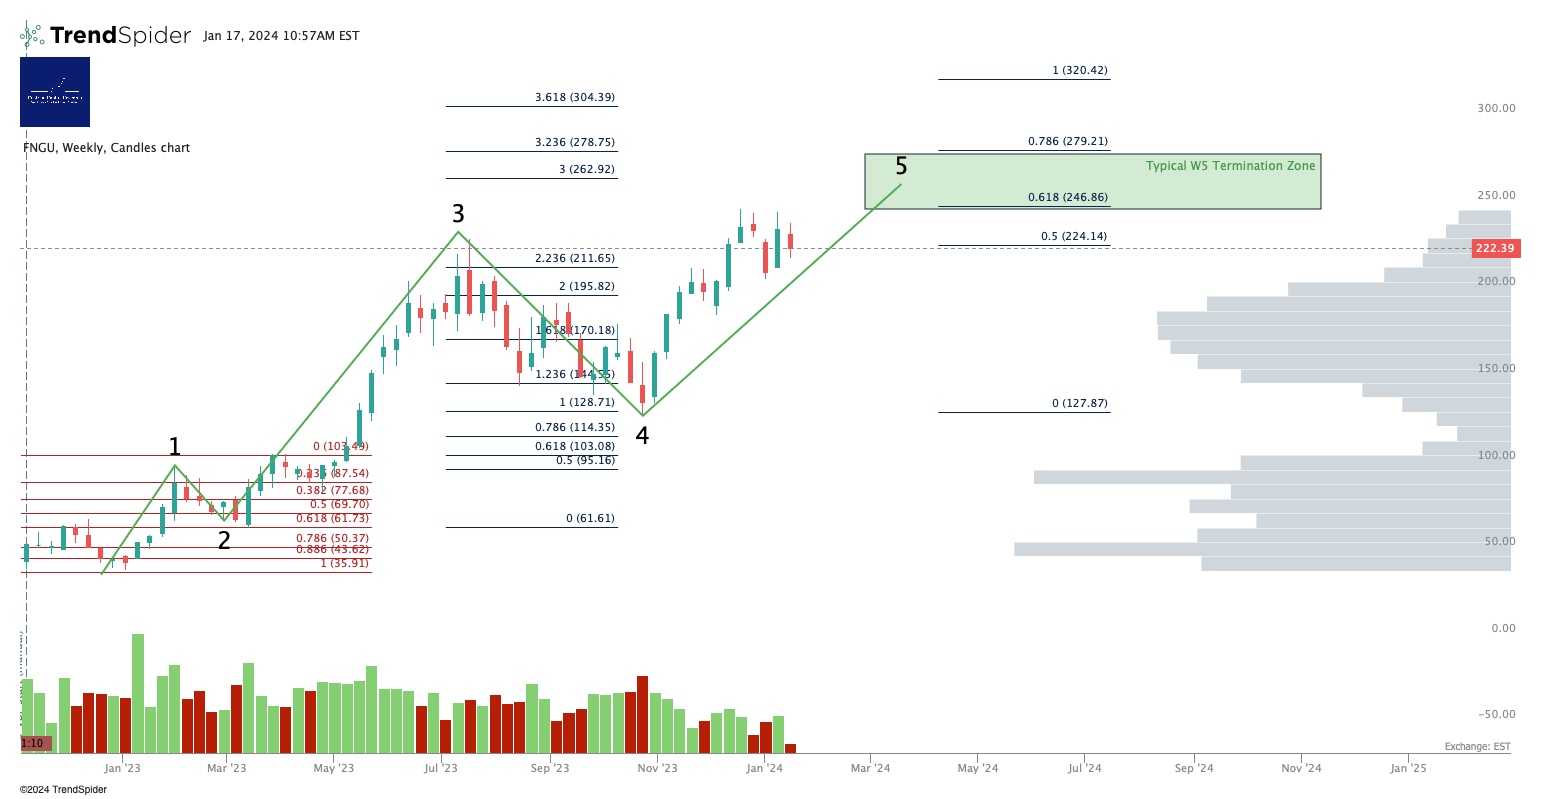
3x Levered Long Megacaps - FNGU
Rolled over at the low end of our W5 termination zone.
Alex King, Cestrian Capital Research, Inc - 17 January 2024. DISCLOSURE - Cestrian Capital Research, Inc staff personal accounts hold long positions in, inter alia, UPRO, SPXU, TQQQ, UDOW, TNA.
Thank you for reading Cestrian Market Insight. This post is public so feel free to share it.
